HAL Id: hal-01021035
https://hal.inria.fr/hal-01021035
Submitted on 9 Jul 2014HAL is a multi-disciplinary open access archive for the deposit and dissemination of sci-entific research documents, whether they are pub-lished or not. The documents may come from teaching and research institutions in France or abroad, or from public or private research centers.
L’archive ouverte pluridisciplinaire HAL, est destinée au dépôt et à la diffusion de documents scientifiques de niveau recherche, publiés ou non, émanant des établissements d’enseignement et de recherche français ou étrangers, des laboratoires publics ou privés.
Imaging of Early-Stage Cracking on Real-Size Concrete
Structure from 4-Points Bending Test
Yuxiang Zhang, Éric Larose, Thomas Planes, Gautier Moreau, Claude Rospars
To cite this version:
Yuxiang Zhang, Éric Larose, Thomas Planes, Gautier Moreau, Claude Rospars. Imaging of Early-Stage Cracking on Real-Size Concrete Structure from 4-Points Bending Test. EWSHM - 7th European Workshop on Structural Health Monitoring, IFFSTTAR, Inria, Université de Nantes, Jul 2014, Nantes, France. �hal-01021035�
I
MAGING OF EARLY
-
STAGE CRACKING ON REAL
-
SIZE CONCRETE
STRUCTURE FROM
4-
POINTS BENDING TEST
Yuxiang Zhang1, Eric Larose1, Thomas Planes2, Gautier Moreau3, Claude Rospars4-6
1 ISTerre, Université J. Fourier & CNRS, BP 53, 38041 GRENOBLE Cedex 9, France 2 Department of Civil and Environmental Engineering, Colorado School of Mines, Golden-CO,
USA 3 EDF R&D
4 Laboratoire Sols, Solides, Structures - Risques (3S-R), Domaine Universitaire, 38041
GRENOBLE Cedex, France
5EDF SEPTEN, 12-14 avenue Dutrievoz, 69628 Villeurbanne Cedex
6 IFSTTAR, 14-20 Boulevard Newton Cité Descartes, Champs sur Marne, 77447 Marne La Vallée
Cedex 2
yuxiang.zhang@ujf-grenoble.fr
ABSTRACT
Traditional ultrasonic imaging techniques encounter difficulty on complexes material such as concrete, which is in part due the use of coherent waves in a very heterogeneous material. From this angle, technique called LOCADIFF has been developed for monitoring heterogeneous media using multiply scattered waves [1-2]. We consider that modifications in the medium are equivalent to the presence of extra scatterers, which are characterized by their effective scattering cross-section 𝜎. Within this view, LOCADIFF allows to locate the modification by measuring the spatio-temporal de-correlation of multiply scattered waves and by solving the corresponding inverse problem. Based on LOCADIFF, a newly developed imaging technique has been reported [3]. By mapping the intensity of modification on localized microstructure, the new technique is able to detect perturbations at multiple locations. Here we present the application of this new technique on a real-size 15 tons concrete structure for imaging early-stage cracking procedure issued from four point bending load, as part of the CEOS.fr project. Experimental results show that this technique can not only locate cracks that appeared simultaneously at multiple locations, but also detect them and observe their developments since an early-stage.
KEYWORDS : LOCADIFF, Imaging, real-size concrete, cracking, 4-point bending. 1 INTRODUCTION
Being non-destructive, non-hazardous and naturally sensitive to elastic properties, ultrasonic waves are advantageous for characterizing material’s mechanical properties or damage detection [4]. By letting ultrasounds interact with defects (which are, in general, discontinuities representing high impedance contrast on surface) and analyzing thereby produced echo, traditional ultrasonic non-destructive testing (NDT) methods (e.g. impact echo or pulse echo) are capable of detecting, locating or even imaging defects in a homogeneous medium [5]. However, their capacity is restrained when the propagation medium is heterogeneous.
The propagation of elastic waves in a heterogeneous medium is complex and highly depends on their frequencies [4]. In the case of ultrasounds in concrete, the multiply scattering effect occurs due to random distributed scatters (aggregates) and leads to a noise-like appearance of recorded signal. In general, one can either use the part of the signal that formed only by coherent waves, or decrease
frequency to avoid such multiple scattering effects. However, from one hand, the use of coherent waves requests a smaller propagation distance [2] which makes global inspection impossible when the structure has large dimensions. On the other hand, lowering frequency makes propagation medium less heterogeneous to ultrasounds and easier for them to propagate. Nevertheless, the consequential increase of wavelength will degrade the spatial resolution and detection sensitivity. Such dilemma confines the application scope of traditional ultrasonic NDT methods on concrete [2]. Meanwhile, being the mostly used civil engineering material, the NDT technique of concrete has been always in large demand.
Despite its noise-like appearance, record of multiply scattered waves (a.k.a. coda waves) contains detailed information about propagation medium and is highly sensitive to time-lapse perturbation. Based on such features, a technique called coda wave interferometry (CWI) has been developed by Poupinet [6] and Snieder [7], and considered as a promising NDT technique on concrete. Efforts have been made from different angles to use CWI analysis for damage detection of concrete [8-10]. A new imaging technique for heterogeneous medium has been recently reported its application using multiply scattered seismic waves [3]. In this manuscript, we present its application for crack-imaging on a massive concrete structure using ultrasonic waves. This technique is based on method called LOCADIFF. Different from previously reported method [1], which allows locating the presence of one defect in heterogeneous medium, here we aim at imaging defects appearing simultaneously at different locations and at monitoring their evolutions. After a brief introduction of CWI analysis and the LOCADIFF imaging technique, an experimental study performed on a real-size concrete beam will be reported. Experimental results are then compared to acoustic emission results for discussion.
2 METHOD
For the sake of robustness and better precision, CWI analyses are performed using the “stretching method” [11-12]. This method simulates a variation in propagation velocity by dilating/compressing the signal on a given ratio αi. The stretched signal is then compared to a reference signal by
evaluating their correlation coefficient within a given time-window [𝑡1, 𝑡2].
CC(
α
i) = hp[t(1+α
i)]⋅ hi[t]dt t1 t 2∫
h2 p[t(1+α
i)]dt ⋅ h 2 i[t]dt t1 t 2∫
t1 t 2∫
. (1)Amount all possible value of αi, the one that maximizes 𝐶𝐶 𝛼 = 𝑀𝐴𝑋 𝐶𝐶 𝛼𝑖 is considered as
the apparent relative variation of propagation velocity as
α = Δ v v
. The remnant de-correlation coefficient Kd can be calculated:Kd = 1− CC(α)
. (2)This parameter quantifies the level of perturbation in the waveforms, which can be the result of a localized modification of microstructure in the propagation medium. According to Larose et al. [1],
Kd caused by the presence of an extra diffuser (a crack in our case) observed by a given
source-receiver pair (S-R) at a propagation time 𝑡 could be theoretically predicted as:
KdS−R(rD, t) = c0
2 ⋅
σ
⋅ KS−R(rR, t) (3)using sensitivity Kernel introduced by Pacheco and Snieder [12]:
)
,
,
(
)
,
,
(
)
,
,
(
)
,
(
0t
r
r
g
du
u
r
r
g
u
t
r
r
g
t
r
K
R S t R D D S R R S∫
⋅
−
=
− . (4)EWSHM 2014 - Nantes, France
g(r
i, r
j, t)
is the probability function for the ultrasounds transfer from location ri to rj after apropagation time t, and can be estimated experimentally from the acoustic intensity. Note that 𝑟!, 𝑟!,
𝑐!refer to the source location, receiver location and the propagation velocity; the extra diffuser is characterized by its location rS and its effective cross-section σ. The sensitivity kernel
K
S−R(r
R, t)
can be understood as the spatial distribution of ultrasounds time-spent at location 𝑟! (in relative) as
a function of arrival time t. By reforming Equation 3 into a matrix form, one can obtain the following relation:
d = Gm. (5)
In this expression d represents experimental Kd values obtained from experimental signals recorded at two different moments;
G = σ ⋅ c
0⋅ K
S−R(r
R, t)
; and m is the spatial distribution model of density of σ that we are looking for.By solving the related inverse problem one can image the modifications in the propagation medium’s microstructure (model m) that occurred between two records. In order to do so, we used the minimum square method for linear problem proposed by Tarantola and Valette [14]:
m = m0+ CmG t (GCmG t + Cd) −1 (dobs− Gm0), (6)
where Cm is the covariance matrix of model, Cd is the covariance matrix of the model and m0 is the
initial model which is filled with zeros in our case [15]. 3 EXPERIMENTAL PROCEDURE
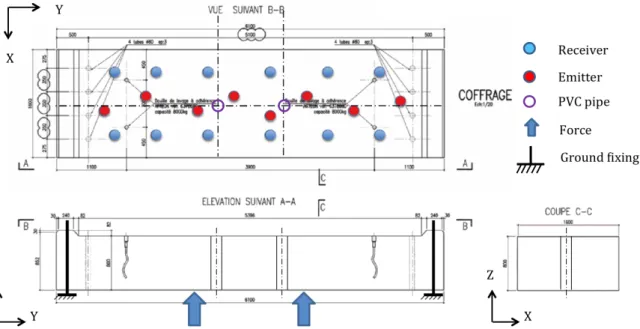
A real-size reinforced concrete beam (6.1m × 1.6m × 0.8m) weighting 15 tons is the specimen at test. This beam is part of an experimental program on massive beams and thick walls of the French research project CEOS.fr on the behavior of cracking on massive elements, creep and shrinkage (c.f. references [16-17] for details). Having its both ends firmly tied on the ground and the forces applied upward at two symmetric locations along Y-axis by actuators (c.f. Figure 1), the beam is subjected to 4-points bending load. By placing two PVC pipes into the specimen during the cast of concrete, two cylindrical cavities that passing through the beam are formed in order to be representative of inclusion of pre-stressed cable duct. For the loading procedure, applied force increases step-by-step with an increment of ~150kN to a maximum level of ~2500 kN. With this increase of loading level, we observe that cracks start to appear on the surface at the end of loading step 4 (loading level of 600 kN) and concrete beam reached its ultimate strength and failed at the end of the test. Since this manuscript mainly focuses on damages at early stage, only results obtained from the first four loading steps will be shown and discussed in Section 4.
For ultrasonic measurement, 20 identical ultrasonic transducers are glued on the upper surface of the beam. As illustrated in figure 1, 20 transducers are ranged approximately into 3 rows (along Y-axis): the 8 in the middle serve as emitters while the other 12 serve as receivers. The transducers are not perfectly aligned deliberately to avoid symmetries. Given the loading condition and for symmetry reasons, we assume that the produced cracks are transversal along X-axis, and that they develop in depth along the Z-axis and/or open along the Y-axis. Therefore, the primary objective of damage-imaging is locating cracks’ position along Y-axis and Z-axis. During the experiment, an acoustic emission measurement has been performed and its results will be compared to that of LOCADIFF.
For each acquisition, a chirp signal (frequency increases from 50 kHz to 200 kHz) is amplified and sent to concrete using one of the emitters. Simultaneously, every receiver starts to pick up a 5-ms-long signal. At the end of each loading step, 50 acquisitions are performed continuously (repetition frequency of 25 Hz) using each and every emitter.
By source-correlating the 50 averaged signals recorded by a same source-receiver pair (i.e. a same receiver and a same emitter) a total number of 96 signals (8 emitters × 12 receivers) are obtained with a significantly good signal to noise ratio. These signals are referred to as coda signals in further analyses.
Figure 1: Three view drawing of the experimental set-up: a concrete beam in dimensions of 1.6m ×6.1m ×0.8m is subject to a 4-points bending load with 12 receivers and 8 emitters are glued on the upper surface of
the specimen for ultrasonic measurements (CEOS.fr database).
4 EXPERIMENTAL RESULT
Table 1 contains physical parameters that are necessary to perform CWI analysis and LOCADIFF imaging calculation. Their values are obtained experimentally from the specimen used in our experiment. Except for 𝑐!, the propagation velocity of coda waves, whose value is estimated under assumption of energy equipartition between longitudinal waves and shear waves [18].
Table 1: List of physical parameters for CWI analysis and LOCADIFF.
Parameter Notation Value
Propagation velocity of coda (m/s) 𝑐! ~2500
Diffusion constant (m²/s) 𝐷 140
Transport mean free path (m) 𝑙∗= 3𝐷/𝑐! 0.16
Transport mean free time (μs) 𝑡∗=𝑙∗/𝑐! ~60
We perform CWI analysis by comparing a signal-to-test (a signal recorded by a given source-receiver pair at a loading step from 1 to 4) to a corresponding reference signal (a signal recorded at loading step 0 using a same source-receiver pair) within six different time-windows, and six Kd are derived accordingly. The beginning of the first time-window is set to 400μs such that the propagation time is much longer than the transport mean free time t*. The width of the time-window
is set to 500μs so it contains enough information (several oscillations) to ensure the quality of analysis. We obtained 576 Kd values for each loading steps (96 source-receiver pairs × 6 windows), but considered only the reliable ones, i.e. average signal to noise ratio within the window > 20 dB, and with a physical significance (i.e. the center time of corresponding
time-EWSHM 2014 - Nantes, France
window > the arrival time of ballistic waves). These values formed the experimental data 𝑑!"# used
for solving inverse problem (Equation (6)).
The propagation medium (concrete beam) is meshed by cubic voxels (mesh length is set to 𝑙∗), the positions of which are referred by the coordinates of their center locations (𝑥, 𝑦, 𝑧). For each source-receiver pair, six sensitivity kernels 𝐾𝑡𝑆!𝑅 𝑥, 𝑦, 𝑧 = 𝐾𝑆!𝑅 𝑥, 𝑦, 𝑧, 𝑡 are calculated for 6 time-windows used in CWI analysis where t refers to their center times. In corresponding to each element of 𝑑𝑜𝑏𝑠, a sensitivity kernel 𝐾𝑡𝑆!𝑅 𝑥, 𝑦, 𝑧 calculated under the same condition (i.e. same source-receivers pair and same time-window) is used to form G matrix.
By solving the inverse problem as described (c.f. Section 2), we obtain a 3D matrix 𝑚(𝑥, 𝑦, 𝑧) for each loading step. It maps the modification in propagation medium- compared to its initial status (loading step 0) –with a density of changes σ (m2/m3) within each voxel. The higher the value of
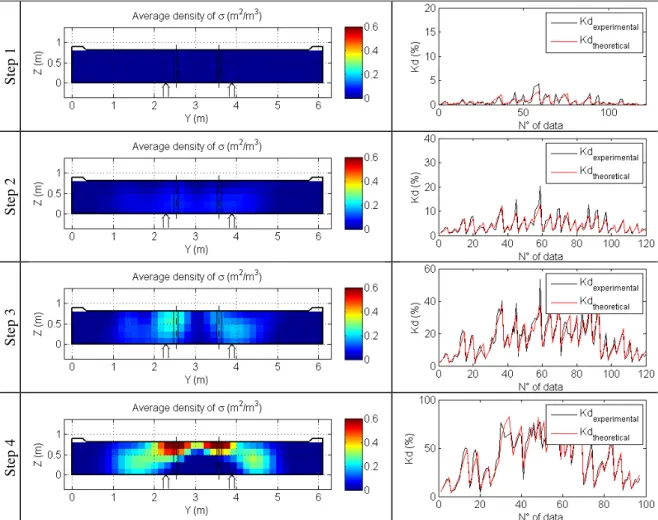
𝑚(𝑥, 𝑦, 𝑧)is, the more important the modification of microstructure at location (𝑥, 𝑦, 𝑧). In the case of our experiment, modification is majorly caused by cracking or development of cracks. As cracks are assumed transversal along X-axis (c.f. Section 3), and for the sake of clarity in illustration, only 𝑚(𝑦, 𝑧)- the average values of 𝑚(𝑥, 𝑦, 𝑧) along x dimension -are displayed in figure 2 for each loading step. St ep 1 St ep 2 St ep 3 St ep 4
Figure 2: Schematic representation of inversion analysis results. For each loading step, the left image is the 2D illustration of 𝑚(𝑦, 𝑧) which indicates the average density of effective cross-section 𝜎 (m²/m3) by
The four images at the left of figure 2 are illustrating 𝑚 𝑦, 𝑧 obtained at each loading step. The locations of PVC pipes and applied forces are also illustrated. By putting four images in a fixed color scale, we observe that the modifications are initiated as early as loading step 2 and become more and more important. Theoretical prediction of Kd is calculated using obtained the output model 𝑚(𝑥, 𝑦, 𝑧) (Equation 5). For demonstrating the quality of the inversion analysis, comparisons between theoretical and experimentally Kd are illustrated in the images at the right side of figure 2. As two values fit rather well each other in all four images, we believe that the inverse problem has been correctly solved.
From the illustration of 𝑚(𝑥, 𝑦, 𝑧) for loading step 4, we observe that microstructure modifications (red in color map) show high concentration at two locations: horizontally (on Y-axis) centered at the locations of the PVC pipes and near the upper surface. This result coincides with the expectation that: 1) under 4-points bending load, the upper part of the beam between actuators is under traction and is subject to cracking; and 2) the presence of PVC pipes might favor the cracks initiation. The acoustic emission measurement confirms these ultrasonic results too: according to the acoustic emission measurement: 1) during loading step 4, a large number of acoustic emission event have been captured which indicating the creation of crack(s); 2) these events are located horizontally (on Y-axis) around the level of two PVC pipes.
Knowing that the observation of acoustic emission event is the capture of energy in form of elastic waves released by the opening of cracks, and that there is nearly no noticeable event observed before, it can be conclude that most micro-cracks occurred during loading step 4. However, ultrasonic results show modification of microstructure since loading step 2. And such modification continues and shows a concentration around the left PVC pipe at loading step 3. Cracking on surface appeared really 2 steps latter and the position is not corresponding exactly to the PVC pipe position. To understand this difference in observation between the two techniques, author would like to propose two possible explanations: 1) cracks (or micro-cracks) are indeed created during loading step 3, though their released-energy are not strong enough to be capture by acoustic emission measurement; or 2) crack is not created before loading step 4, and the modification of microstructure observed by ultrasonic method at the end of loading step 3 are caused by localized deformations. Either explanation indicates that with LOCADIFF imaging technique, the detection of damages might be archived at a very early-stage (i.e. when cracks are about to form or damages are only micro-cracks that too small to be detected by other method, e.g. acoustic emission).
5 CONCLUSION & PERSPECTIVES
In this manuscript, we presented the application of a newly developed imaging technique on a real-size concrete structure for cracks’ imaging. A concrete beam is subject to a 4-point bending load for the creation of cracks. By analyzing multiply scattered ultrasonic waves recorded using 8 emitters and 12 receivers with CWI analysis and LOCADIFF imaging technique, the localized microstructure modification are mapped with density of 𝜎. At the end of loading step 4, cracks appeared with applied force reaches 600 kN. LOCADIFF imaging results show concentration of microstructure modification around the position of two pre-casted cavities. Acoustic emission measurement also confirms the formation of cracks around these locations during loading step 4. Thus, influence of the pipes only occurs during the formation of micro-cracking at core, before occurrence of the first crack on surface. Therefore, we conclude that this imaging technique is able to detect first micro-damage at early stage and to locate them even damages appear simultaneously at multiple places.
Considering the mechanism of LOCADIFF imaging technique, two further research directions at NDT purposes are conceivable:
EWSHM 2014 - Nantes, France
• The location of possible damaged before the actual creation of cracks, especially of damages caused by locally concentrated stress. Due to acoustoelastic effect of concrete, localized concentration in stress cause localized variation of propagation velocity, which can be detected by CWI analysis and located by LOCADIFF imaging technique;
• The imaging of macro cracks. By connecting scattering cross-section to real dimension of the scatterers, one can not only locate a crack but also estimate its shape, direction and even its dimensions.
6 ACKNOWLEDGEMENTS
The investigation and results reported herein are partly supported by the French National Program CEOS.fr (Study and design of specific structures in relation to cracking and shrinkage) sponsored by the French Ministry in charge of sustainable development (MEDDE-DRI).
REFERENCES
[1] V. Rossetto, L. Margerin, T. Planès, E. Larose. Locating a weak change using diffuse waves: Theoretical approach and inversion procedure, J. App. Phys. 109: 034903, 2011.
[2] E. Larose, T. Planes, V. Rossetto, L. Margerin. Locating a small change in a multiple scattering environment, Appl. Phys. Lett. 96 (20): 204101. 2010.
[3] A. Obermann, T. Planes, E. Larose, M. Campillo. Imaging pre- and co-eruptive structural changes of a volcano with ambient seismic noise, J. Geophys. Res. 118: 6285–6294, 2013.
[4] T. Planès, E. Larose, A review of ultrasonic Coda Wave Interferometry in concrete, Cem. Con. Res. 53:248-255, 2013.
[5] H. Wiggenhauser, Advanced ndt methods for the assessment of concrete structures, in 2nd International
Conference on Concrete Repair, Rehabilitation and Retrofitting, 19–30, 2009.
[6] G. Poupinet, W. L. Ellsworth, J. Fréchet, Monitoring velocity variations in the crust using earthquake doublets: an application to the Calaveras fault, California, J. Geophys. Res. 89: 5719–5731, 1984
[7] R. Snieder, A. Grêt, H. Douma, J. Scales, Coda wave interferometry for estimating nonlinear behavior in seismic velocity, Science, 295 (5563): 2253–2255, 2002.
[8] S. Stähler, E. Niederleithinger, C. Sens-Schönfelder, Monitoring stress changes in a concrete bridge with coda wave interferometry, J. Acoust. Soc. Am., 129:1945–1952, 2011
[9] D. P. Schurr, J. -Y. Kim, K. G. Sabra, L. J. Jacobs, Damage detection in concrete using coda wave interferometry, NDT & E International, 44(8):728 – 735, 2011.
[10] Y. Zhang, O. Abraham, F. Grondin, A. Loukili, V. Tournat, A. Le Duff, B. Lascoup, and O. Durand, Study of stress-induced velocity variation in concrete under direct tensile force and monitoring of the damage level by using thermally-compensated coda wave interferometry, Ultrasonics, 52(8): 1038 – 1045, 2012
[11] C. Sens-Schönfelder E. Larose. Lunar noise correlation, imaging and monitoring, Earthquake Science 23:519-530, 2010.
[12] C. Hadziioannou, E. Larose, O. Coutant, P. Roux, M. Campillo. Stability of Monitoring Weak Changes in Multiply Scattering Media with Ambient Noise Correlation: Laboratory Experiments, J. Acoust. Soc.
Am. 125: 3688-3695, 2009.
[13] C. Pacheco, R. Snieder. Time-lapse travel time change of multiply scattered acoustic waves. J. Acoust.
Soc. Am., 118:1300-1310, 2005
[14] A. Tarantola, B. Valette, Generalized nonlinear inverse problems solved using the least squares criterion.
Rev. Geophys., 20(2):219–232 , 1982
[15] T. Planes, E. Larose, V. Rossetto, L. Margerin. Imaging local changes in heterogeneous media with diffuse waves, preprint
[16] L. Demilecamps, Reliable shrinkage and crack design: CEOS.fr French national research program, experimental aspects, 3rd fib international congress, 2010, Washington
[17] C. Rospars, D. Chauvel, CEOS.fr experimental program and reference specimen tests results, European
[18] R. Snieder, Coda wave interferometry and the equilibration of energy in elastic media, Physical Review
E. 66: 046615. 2002.
EWSHM 2014 - Nantes, France