HAL Id: hal-02104385
https://hal.archives-ouvertes.fr/hal-02104385
Submitted on 16 May 2020
HAL is a multi-disciplinary open access
archive for the deposit and dissemination of sci-entific research documents, whether they are pub-lished or not. The documents may come from teaching and research institutions in France or abroad, or from public or private research centers.
L’archive ouverte pluridisciplinaire HAL, est destinée au dépôt et à la diffusion de documents scientifiques de niveau recherche, publiés ou non, émanant des établissements d’enseignement et de recherche français ou étrangers, des laboratoires publics ou privés.
Nassim Ait-Mouheb, Juliette Schillings, Jafar Al-Muhammad, Ryad
Bendoula, Séverine Tomas, Muriel Amielh, Fabien Anselmet
To cite this version:
Nassim Ait-Mouheb, Juliette Schillings, Jafar Al-Muhammad, Ryad Bendoula, Séverine Tomas, et al.. Impact of hydrodynamics on clay particle deposition and biofilm development in a labyrinth-channel dripper. Irrigation Science, Springer Verlag, 2019, 37 (1), pp.1-10. �10.1007/s00271-018-0595-7�. �hal-02104385�
Impact of hydrodynamics on clay particle deposition and biofilm development in a labyrinth-channel dripper
Nassim Ait-Mouheb1, Juliette Schillings1, Jafar Al-Muhammad1, 2, Ryad Bendoula 1, Séverine Tomas1, Muriel
Amielh 2, Fabien Anselmet 2
1IRSTEA Montpellier, Université de Montpellier, 361 rue Jean-François Breton, 34090 Montpellier, France
2CNRS -Aix Marseille Université -École Centrale Marseille, IRPHE, 49 Rue Frédéric Joliot-Curie, BP 146,
13384 Marseille, Cedex 13, France Corresponding author: nassim.ait-mouheb@irstea.fr
Phone: +33 4 67 16 64 03
Abstract:
In order to better understand physical and biological clogging in drip-irrigation, a study was conducted on the impacts of hydrodynamic conditions on clay particle deposition and biofilm development in drippers using an optical method. A transparent milli-fluidic system composed of labyrinth channels was used to identify areas most susceptible to particle clogging using two different types of clay suspensions: sodium bentonite and kaolin.
The impact of salt addition ([NaCl] =200 mg.L-1) on the clay deposition was also analyzed. Biofilm development
was studied using the same methodology using a nutritive solution (chemical oxygen demand,
COD = 200 mg.L -1). In addition, fluid dynamics simulations were performed along the labyrinth channel to
understand the effect of flow behaviour on the fouling. Computational Fluid Dynamics results show two types of
flow topology: high velocity in the main flow (around 1m.s-1) and low velocity in the vortex zones (less than 0.2
m.s-1) found in the channel corners. Using an optical method, kaolin deposition and biofilm growth in the dripper
were observed to occur mainly in the inlet channel and initial vortex zones, which are characterized by lower mean velocity and turbulent kinetic energy values. This part of the dripper can be considered as a bottleneck that amplifies the fouling phenomena and which should be optimized. With the addition of NaCl, kaolin particles tend to form bigger flocs. Therefore, more significant particle deposition is observed, but this is not the case of bentonite for which no fouling is observed along the dripper.
Introduction
Drip-irrigation is highly relevant in the context of water scarcity as it can be used to save water by improving irrigation efficiency by around 90% (Camps et al. 2000; Luquet et al. 2005). Indeed, drip irrigation is thought to be much more efficient than other irrigation techniques such as furrow or sprinkler irrigation (Benouniche et al. 2014). Less water is lost in conveyance, and water is applied directly in the immediate vicinity of the plant, thereby saving water. Secondly, drip irrigation enables a more uniform distribution of water over the field (i.e. all plants receive almost the same quantity of water) and facilitates the application of water (ease of use, higher
irrigation frequency), thereby improving crop yields (Wu and Gitlin 1983; Wang et al. 2013). It is also considered beneficial for crop production and the environment since fertilizers can be applied continuously, thus reducing the total application (Phene et al. 1993; Ayars et al. 1999). Energy costs are also reduced because it has lower pressure demands than other pressurized systems.
In most irrigation conditions, dripper clogging is considered the main maintenance problem associated with drip irrigation because it affects water application uniformity (Oron et al. 1979; Nakayama and Bucks 1981). Since the first international conference on drip irrigation in 1971, numerous attempts to solve clogging problems have been made (Bucks and Nakayama 1979; Niu et al. 2013, Katz et al. 2014). Emitter clogging is generally linked to water quality issues, narrow channel size or, in the case of pressure-compensating dripper, the low flow interspace between the membrane and the emitter walls. It often results from the combination of several physical, biological and chemical conditions (Bucks et al. 1979; Adin and Sacks 1991; Tarchitzky et al. 2013, Zhou et al. 2016, Rizk et al. 2017). As a result, emitter clogging is one of the key factors that determines whether drip-irrigation systems can success.
Physical clogging caused by solid particles is considered as the most common source of emitter plugging (Pitts et al. 2003). To reduce particle deposition, filtration is essential in drip-irrigation, and it is often coupled with the initial removal of large particles, and with screen filters for finer materials (Lamm and Camp 2007). Depending on filter mesh size, small particles, such as sand (>50µm), silt (>2µm) or clay (<2µm), can still enter the emitter, and may cause physical clogging due to different phenomena such as aggregation, cementation and transport. Numerical studies of Wei et al. (2009) and Liu et al. 2010 showed that velocity of suspended particles, particle diameters and sediment concentrations are the main factors responsible for physical clogging. The likelihood of emitter clogging is significantly increased when particle diameter exceeds 50µm (Wei et al. 2009). The average size of the labyrinth channel width is approximately 1mm (Zhang et al. 2010). Niu et al. (2013) observed that large particle deposition is usually located at the inlet and channel corners. However, emitters can also be obstructed by the accumulation of fine particles such as silt and clay (Bounoua et al. 2016, Oliveira et al. 2017). The nature of clay can strongly modify clogging mechanisms (Oliveira et al. 2017). The presence of salts can also amplify the aggregation mechanisms of clays (Cuisset 1979; Stawinski et al. 1990).
Concerning biological clogging, the presence of nutrients in irrigation water, such as treated wastewater, is a favorable environment for the rapid growth of algae and bacteria (Adin and Sacks 1991; Li et al. 2013; Qian et al. 2017). Micro-organisms such as bacteria can cling to the surface of solids in water environments. The treated wastewater source commonly contains nutrients, such as inorganic salt, nitrogen, and phosphorous, which can amplify the biofilm growth kinetics. For example, using a synthetic effluent with high COD concentration
(COD=200mg.L-1), Gamri et al. (2014) noticed that 83% of the turbulent type emitters (12 drippers) were totally
clogged by biofilm after 10 weeks. Ravina et al. (1992) chose 12 types of emitters and conducted drip irrigation experiments with lake water and reclaimed wastewater, which indicated that the clogging was a gradual process, and that the partial clogging of emitter was more frequent than complete clogging. In these studies, there are neither continuous optical observations of clogging nor their coupling with the hydrodynamic effect on biofilm. Biofilm formation kinetics and particle deposition or transport are highly influenced by hydrodynamic conditions occurring along the dripper channel (Bounoua et al. 2016). Numerically, several studies have been performed based on computational fluid dynamics (CFD) to visualize and analyze the flow inside the labyrinth-channel
dripper (Wei et al. 2009; Al-Muhammad et al. 2016). These researchers observed that the flow can be divided into two areas: the main flow area characterized by high velocity and the vorticity zones in channel corners. In these numerical flow studies, there are no correlations made with clogging mechanisms.
The aim of this paper is to better understand particle deposition and biofilm fouling by considering flow behavior in drippers. Experimentally, an optical method and a transparent milli-fluidic system were used to define the main clogging areas and to observe the two clogging phenomena mentioned above. At first, two clay suspensions using sodium-bentonite (Na-bentonite) and kaolin were studied in either the presence or absence of
sodium chloride (NaCl). Secondly, a synthetic solution with COD equal to 200 mg.L-1 was added to biofilm
fouling determinations. Clogging analyses are coupled with numerical flow studies to better understand the hydrodynamic effect.
Materials and methods
Experimental procedure
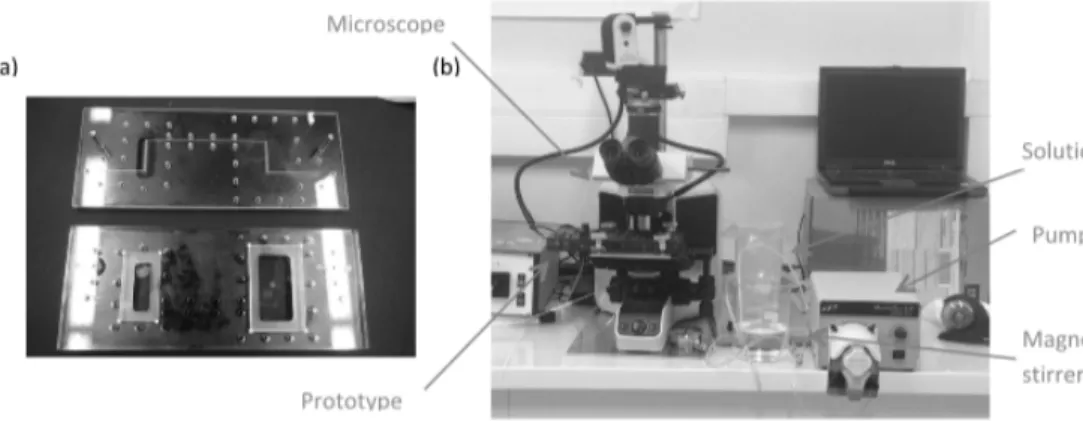
In order to study clogging mechanisms, a transparent milli-fluidic prototype, which reproduces a section of a labyrinth-channel dripper, is built using milled polymethyl-methacrylate (PMMA) (fig.1a). This device is made up of two layers: a bottom layer including the channel structures with two labyrinth channels fitted with 10 baffles each, and a top PMMA layer for fluid connections and glass plates for optical access. Glass is chosen as the most suitable material in order to minimize biofilm formation (Habouzit et al. 2011). The flow channel has a 1 mm width and 0.5 mm depth. This geometry reproduces part of a commercial turbulent dripper. In irrigation equipment markets, there are several dripper types with different geometries and flow section. In our project the geometry of milli-fluidic prototype is the most widespread in micro-irrigation. Both PMMA plates are pressed together (Fig.1).
Fig. 1 (a) Transparent milli-fluidic device (b) Experimental setup with optical system
For physical clogging analysis, the flow channel is supplied with two types of clay solutions in distilled water
using a peristaltic pump (Masterflex L/S): Na-bentonite (2.65 g.cm-3 density) and kaolin (2.4 g.cm-3 density).
These two types of clay are chosen because they had different aggregations in the presence of water or salts and they are commonly found in surface water irrigation. The size of Na-bentonite and kaolin is not measured. A
single concentration of clay, equal to 200 mg.L-1 (Bounoua et al. 2016), is assumed in order to compare the
effect of clay properties (the aggregation and swelling behaviors). In order to analyze the salinity effect on clay
deposition associated with wastewater reuse in irrigation, a concentration of NaCl is added at 10-2 M. This
concentration corresponds to the salinity found in treated wastewater at the outlet of a sand filtration wastewater
will be interesting to vary the salt concentration and type (Oliveira et al. 2017). The particle transport experiments were carried out over one week to identify the main clogging zones.
Concerning biofilm development, a synthetic wastewater solution (Gamri et al. 2014) is used to study biological clogging. Solution composition is detailed on Table 1. To fasten bacterial growth, the chemical oxygen demand
(COD) is maintained at about 200 mg.L-1. According to the wastewater discharge standards, this concentration is
approximately twice more than the standard COD concentration of wastewater after treatment plant. Because, this laboratory study issue is to analyze biofilm development in time related to hydrodynamic effects. The synthetic solution is changed every 48 hours to provide sufficient nutrient supply and stable solution concentrations. Mean solution temperature and pH, of 22°C (±2°C) and 7.2 (±1.5) respectively, are measured during the experiments. All fouling analyses were repeated two times.
Tab. 1 Synthetic solution of COD = 200 mg.L-1 composition
Components Concentration (g.L-1)
Meat extract 0.65
Sucrose 0.035
Ammonium chloride 0.028
Phosphoric acid 0.0038 x10⁻³
In the inlet channel, the flow rate is maintained at 1.44 L.h-1 which corresponds to a Reynolds number equal to
400, using:
. .
µ (1)
where represents fluid density [kg.m-3], mean velocity [m.s-1], d is the hydraulic diameter [m] and µ dynamic
fluid viscosity [kg.m-1.s-1].
Measurement methods
The observations are conducted with an optical microscope (Olympus BX43), characterized by x10 magnification, and with 8.8 µm focus depth. The field of view for a magnification of x10 is about 1.25 mm (length) to 2 mm (width). The visualizations were recorded along the channel using an Olympus EP-L3 digital camera.
The measurement plane in the labyrinth channel is divided into different zones in order to locate the images observed during the experiment. Fig. 2 represents the whole labyrinth-channel with the measurement zones. The optical observations are carried out as a function of time.
Computational processes
In this work, hydrodynamic profiles along the labyrinth channel are investigated using CFD. The numerical simulations are performed using the commercialized CFD solver called ANSYS Fluent 14. The computational domain is 3D and geometry are virtually the same as these used for studying the flow regime in labyrinth-channel by Al-Muhammad et al. (2016). The geometry includes inlet and straight outlet labyrinth-channels and fives baffles (Fig. 2). The dimensions of the inlet and outlet channels are 10 mm (length) x 1 mm (width) x 1mm (height), while the outlet dimensions are 10 mm (length) x 1.2 mm (width) x 1mm (height) and for the baffle
channel D2=3.25mm (length) x d1=1.35mm (flow width) x d2=1.3mm (baffle height). The channel depth of
experimental and numerical studies is slightly different due to the precision of the machining process.
The computations are performed using a hexahedral grid. The influence of mesh size is tested in order to choose
the appropriate computation grid. The optimum number of cells is 3×10⁵. Pressure/velocity coupling is obtained
using the Simple scheme, while the QUICK scheme is set as spatial discretization to solve the momentum, turbulent kinetic energy and turbulent dissipation rate equations. The k-ε turbulence model is used in this study. Steady state, turbulent, single-phase and incompressible fluid conditions are assumed. The fluid is pure liquid water and supposed not to be subject to gravity forces.
Boundary conditions for both configurations are specified in the following way: a uniform velocity profile is
imposed at the inlet section with Re=400 (1.44 L.h-1). For outflow conditions, the flow rate chosen is equal to the
flow rate at the inlet. The turbulent intensity and hydraulic diameter are chosen for the turbulence specification method to calculate the turbulence effect. Enhanced wall treatment is chosen to model the flow near the wall
with y+~1 at the first node (for more information about the Computational Fluid Dynamics, see Ferziger and
Peric 2001; Pope 2000).
Results
Numerical characterization of flow behaviors in labyrinth channels
The three-dimensional numerical simulations are performed on 5 identical baffles and Re=400 (flow rate equal
to 1.44 L.h-1) in order to better understand the hydrodynamic effects on clay and biofilm fouling. Fig.3 shows the
mean velocity modulus fields along the labyrinth-channel and the streamline details obtained in the 3rd baffle at
the middle of the channel (z=0.5 mm). The flow reaches its maximum velocity value (red zone) at the channel center and near the wall where it changes direction. In the main flow zone, the mean velocity modulus varies
from 0.6 to 1 m.s-1. Secondly there are several low-velocity areas highlighted in blue, which correspond to vortex
Fig. 3 Mean velocity fields obtained numerically along the labyrinth channel and velocity streamlines in the 3rd
baffle at z=0.5 mm and Re=400
In order to compare flow development progress at different points along the labyrinth channel, the velocity profiles are plotted at different positions, x=-8.3 mm (line 3), x=-11.6 mm (line 4) and x= -14.7 mm (line 5). In Fig. 4 for these 3 lines, in the mainstream flow, the velocity magnitude is the same for all positions. However, in
the vortex zone, some differences are observed in the vortex zone (0.07 m.s-1 in the vortex zone), which were the
velocity magnitude remains relatively low. Consequently, the flow can be considered as stable from the 3rd baffle onwards.
Fig. 4 Mean velocity modulus profiles at lines 3, 4 and 5 for Re=400
Clay deposition zones in labyrinth millichannels
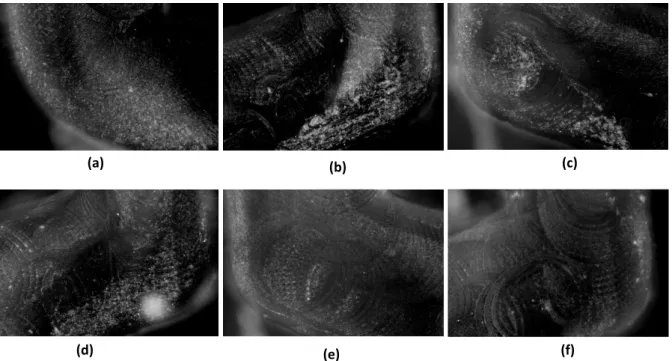
Experimentally, in order to study the primary clogging zones in drippers, two different types of clay are used, which represent one category of particles found in physical clogging (Nakayama and Bucks 1991). Using a kaolin solution, Fig.5 shows channel observations after t=24 hours in different parts of the labyrinth channel. On Fig.5.a, zone 1 is the first corner on the inlet channel. On Fig 5.b, c, zones 3, 5, 7, 13 and 15 are located in labyrinth channel corners of the 1st, 2nd , 3rd and 9th baffles respectively.
Fig. 5 Kaolin particle deposition in the labyrinth-channel at t=24 hours - zone 1 (a), zone 3 (b), zone 5 (c), zone
7 (d), zone 13 (e) and zone 35 (f)
The white particles on the corners of Fig. 5.a, b, c, d and f are kaolin particle depositions at the wall bottom. At t=24 hours, deposition has been observed at the channel inlet (Fig. 3.a) and in the vortex regions (Fig 3.b, c) of
the 1st baffle, until the middle of the channel section. In the second baffle, some particles are found in zone 7
(Fig. 5.d). There were no measurable particle deposits in zones 2 and 4 (Fig. 5. e. f), which correspond to the main high-velocity flow areas (Fig. 3), nor at the next eight baffles.
Fig. 6 Particle accumulation over time (third zone) at t=6 hours (a), t=24 hours (b) and t=53 hours (c)
Temporal analyses were conducted in order to observe particle accumulation along the labyrinth channel. Fig. 6 shows the accumulation of kaolin clay at t=6 hours, t=24 hours and t=53 hours in zone 3, where more significant particle accumulation in the vortex zone was observed. There was a two to threefold increase in particle accumulation in this zone in 48 hours. Particle accumulation was also observed at the inlet corner, and as well as
in zones 5 and 7. After the 3rd baffle, the other areas showed no evidence of particle accumulation after 168
hours.
The same experiments were conducted with Na-bentonite solution (200 mg.L-1) in distilled water in order to
compare the aggregation and transport behaviors of this type of clay. The experiment showed no particle deposition along the channel after 168 hours (Fig.7). In the case of the distilled water solution, this result can be
explained by the presence of sodium ions (Na+) in Na-bentonite, which form diffuse ionic layers surrounding the
bentonite particles and cause electrostatic repulsion between them (Luckham and Rossi 1990). Therefore, due to their small size (<2µm), the bentonite particles remained in the main flow and were transported out of the channel.
Fig. 7 Bentonite solution - (a) zone 5 (b) zone 7 and (c) zone 35 after 168 hours of experiment
NaCl addition effect on clay deposition in labyrinth millichannels
The effect of NaCl addition ([NaCl]=10-2M) is studied on kaolin clay deposition and compared to the
Na-bentonite clay. Fig.8 shows different zones of particle deposition (inlet, zones 3 and 5) at t=71 hours. Particle deposition mainly occurred in the same regions as previously observed without NaCl.
Fig. 8 Kaolin + NaCl deposition in zone 1 (a), 3 (b) and 5 (c) at t=72 hours
According to Fig. 8, the addition of NaCl induced higher particle deposition than for solutions without NaCl.
Using the optical method, the presence of 10-2M of NaCl led to suggest an increase of kaolin agglomeration, but
it was not possible to quantify the particle size evolution with this method. The formation of these aggregates is due to the decrease of zeta potential resulting from salinity. When this potential decreases, attraction forces become stronger than repulsion forces; which results in higher particle agglomeration (Cuisset 1979).
Conversely, the experiment conducted on bentonite suspension in presence of NaCl =10-2M revealed no
determinate particle deposition in the labyrinth channel during the total duration of the experiments. These results are in agreement with Stawinski et al. (1990), and there is no bentonite aggregation for NaCl
concentrations equal to 10-2M.
Biofilm growth kinetic
The second part of the fouling investigation concerns the study of the primary zones of biofilm growth in labyrinth channels. Biological clogging was studied using a synthetic solution with high COD concentration
(COD=200 mg.L-1) and the solution was changed every 48 hours to enhance biofilm growth. Tests were
conducted over 168 hours and were repeated twice.
Fig. 9 Biofilm formation after t=24 hours (a) zone 1 (b) zone 3 (c) zone 5 and (d) zone 7
Fig. 9 shows the observations after running the experiments for 24 hours in the inlet channel (zone 1) and the vortex region of the first baffles (zones 3, 5 and 7). As the biofilm develops, it takes a filamentous form at the inlet channel and in the first two baffles (zones 1, 3, 5 and 7). These growth locations are similar to those obtained with clay studies. After 72 hours, the measurements evidenced significant and compact biofilm
development in the 1st baffle. In zone 5, biofilm surface area increased from 10% to 67% of the channel width. In
this same baffle, biofilm fouling became constant after 120 hours and remained so until the end of
measurements. High shear stress in the main flow could explain this stabilization. From the 3rd baffle, biofilm
started to develop after 180 hours, but in very modest proportions, in the vortex zones. In zone 9 for example, biofilm growth is initiated only after 72 hours.
Discussion
Emitter clogging is a major bottleneck that which acts as a brake to the implementation and popularization of drip irrigation technologies. Using commercial drippers, previous studies were not able to observe in real time the key clogging zones in real time as a function of irrigation water types. A transparent milli-fluidic system, as proposed in the present work, makes this possible to study makes these observations possible.
Kaolin clay and biofilm fouling results show that clogging occurs in the same areas of the labyrinth in both cases, and are significantly influenced by flow behavior. These areas can be divided into two types along the labyrinth channel.
First, at the bifurcation of inlet channel (Fig.3), as evidenced with CFD simulations. This is linked to the low fluid velocity produced by the flow direction rotation and streamline detachment, which explains the deposition of kaolin particles (Fig. 6.a). Moreover, kaolin particle deposition occurred mainly in the vortex regions of the
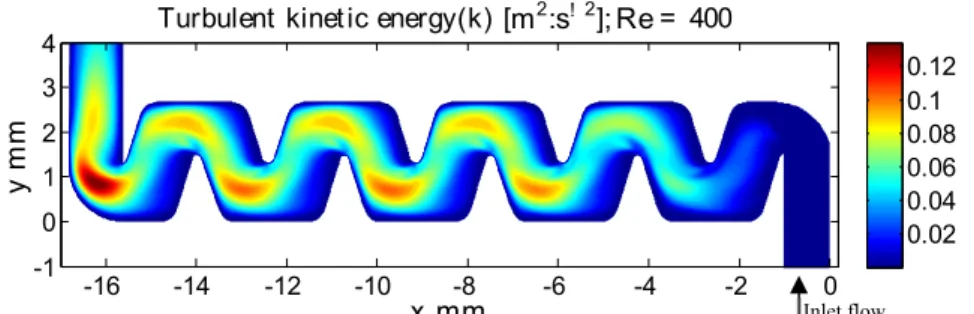
first baffle (Fig. 6.b). According to numerical results, low velocity (around 0.2 m.s-1, Fig. 3) and low turbulent
kinetic energy (k) values were observed (around 2.10-5 m².s-², Fig.10) in this part of channel, which favors
particle deposition and accumulation in the vortex zones.
Fig. 10 Turbulent kinetic energy field obtained by CFD simulation at locations adjacent to the wall (z=0.05mm)
for Re=400
At low velocity values, particle collusion and deposition in the vortices frequently occur due to: small particle sizes, and the large drag force of the latter. Consequently, the particles failed to escape from the vortices. This
behavior is amplified with salt addition at 10-2M in a kaolin solution. The particles accumulate and form bigger
aggregates (Oliveira et al. 2017). Subsequently, blockages in the drip emitters occur.
Secondly after the 3rd baffle, there is no observable kaolin particle deposition in vortex regions after 7 weeks of
study. This result is probably due also to the turbulent kinetic energy effect, which is higher for these baffles
compared to the 1st baffle (Fig. 10). High values of k improve suspended particle mixing in flows and decrease
the possibility of sedimentation in the vortex regions. Niu et al. (2013) also observed in commercialized flat drippers that clogging mainly occurred at the same locations: the inlet channel and corners of the first labyrinth channel. However, small size and non-aggregation of Na-bentonite clay did not favor deposition in the sensible vortex zones of the emitter. Consequently, Na-bentonite is supposed to be transported by the main high velocity flow to the outflow and does not cause physical clogging.
Regarding biofilm fouling, there are many factors affecting biofilm formation in drip-irrigation systems, including fluid dynamic behavior (velocity and hydraulic shear force), nutrient and suspended bacteria quantity, water temperature and the drip-irrigation material properties, i.e., the roughness or surface tension (Horn et al. 2003, Gouidera et al. 2009). Water dynamic characteristics were one of the most influential of these factors along the labyrinth channel. Cheng et al. (1991) confirmed that a significant increase in velocity affects the detachment of biofilm. Early research by Rittmann (1982) showed that the detachment rate was proportional to
the 0.58th power of hydrodynamic shear force. In our paper, the initiation areas of biofilm growth are observed in
similar positions to those obtained with the kaolin studies. In the inlet channel and first vortex zones, low velocity and turbulent kinetic energy values (Fig.3 and 10) also provide favorable conditions for biofilm
development. Conversely, the zones with higher k and shear stress values from the 3rd baffle onwards favored
reduced biofilm fouling.
Conclusion
In this present paper, the three following conclusions are drawn:
1. Using CFD simulations, the flow can be divided into 2 distinct zones, which significantly affects fouling along the labyrinth channel. In the inlet channel, and up to the first baffle, velocity and turbulent kinetic energy is characterized by low values. From the third baffle onwards, flow is hydraulically established with a mainstream zone in the center characterized by high velocity values and recirculation zones where mean velocity and turbulent kinetic energy levels are low.
2. Suspended particles, i.e., Na-bentonite and kaolin clays, were used to better understand flow and size effects on the transport, or deposition, of particles in the dripper. Kaolin particles tend to aggregate into larger particles and then drop to the bottom mainly in the inlet channel or the vortex zones of the first baffles, whereas, in the case of Na-bentonite, no deposition was observed. With increasing particle size and the addition of NaCl, Kaolin particles tend to form bigger flocs. Therefore, more significant particle deposition is observed in the dripper.
3. Analysis based on flow velocity distribution and hydraulic shear stress characteristics, show biofilm growth in the same dripper areas as kaolin clay, thus confirming the significant impact of hydrodynamics on the inlet dripper. After a fast growth phase, biofilm development reached homeostasis, due to the
growth-detachment-regrowth cycle. Moreover, to improve the anti-fouling properties of drippers velocity and turbulent kinetic energy values must be increased in the first section of the dripper through the optimization of channel geometry.
In this paper, several interesting preliminary research results are presented and discussed on the effects of flow behaviors on biofilm growth and two clay types deposition along the labyrinth channel, which were also linked to numerical flow characterization. Nevertheless, there are still several issues that need to be addressed in the future:
1. The paper restricts itself to the study of: i. clogging effects linked to particle-related fouling using two types of clay both with, or without, salt concentrations, ii. clogging effects caused by biofilm fouling using a synthetic effluent. The analysis of clogging caused by different water quality or dripper geometries should also be performed, along with studies based on outdoor irrigation water or treated wastewater in order to further our understanding of the clogging mechanism in drip irrigation systems.
2. A more in-depth analysis is required of regarding the response about biofilm growth and detachment, topography and structure of biofilm or particle transport to various inlet Reynolds numbers. The quantitative analysis of dripper clogging can also be a perspective of this paper, using for example the optical coherence tomography (OCT) method. Moreover, a more comprehensive understanding of topology and formation mechanisms at work at the inlet of labyrinth-channels is required to construct a dynamic fouling model linked to the CFD simulation method in order to optimize the non-fouling geometry of drippers.
Acknowledgements
The authors wish to express their gratitude for the financial support provided by the Water4Crops FP7 project, “Integrating bio-TWW with enhanced water use efficiency to support the Green Economy in EU and India”, N° 311933.
References
Adin A, Sacks M (1991) Dripper Clogging Factors in Wastewater Irrigation. Journal of Irrigation and Drainage Engineering 117: 813-826
Al-Muhammad J, Tomas S, Anselmet F (2016) Modeling a weak turbulent flow in a narrow and wavy channel: case of micro-irrigation. Irrig Sci 34(5): 361-377
Ayars JE, Phene CJ, Hutmacher RB, Davis KR, Schoneman, RA, Vail SS, Mead RM (1999) Subsurface drip irrigation of row crops: a review of 15 years of research at the Water Management Research Laboratory. Agriculture Water Management 42:1-27
Benouniche M, Kuper M, Hammani A, Boesveld H (2014) Making the user visible: analysing irrigation practices and farmers’ logic to explain actual drip irrigation performance. Irrig Sci 32:405-420
Bounoua S, Tomas S, Labille J, Molle B, Granier J, Haldenwang P, Nuur Izzati S (2016) Understanding physical clogging in drip irrigation : in situ, in lab and numerical approaches. Irrig Sci 34: 327
Bucks DA, Nakayama FS, Gilbert RG (1979) Trickle Irrigation water quality and prevention maintenance. Agricultural Water Management 2:149-162
Camp CR, Lamm FR, Evans RG, Phene CJ (2000) Subsurface drip irrigation-past, present and future. In: Proceedings of the 4th decennial national irrigation symposium, Phoenix AZ, ASAE, St. Joseph, MI, November 14-16,363-372
Chang HT, Rittmann BE, Amar D, Heim R, Ehlinger O, Lesty Y (1991) Biofilm detachment mechanisms in a liquid fluidized bed. Biotech Bioeng 38(5):499-506
Cuisset O (1979) Le potentiel électrocinétique des argiles : Influence de la Salinité. Bull de Liaison des Laboratoires des Ponts et Chaussées 2407:104
Ferziger JH, Peric M (2002) Computational Methods for Fluid Dynamics (3rd edition), Springer-Verlag, ISBN 3-540-42074-6, Berlin Heidelberg New York
Gamri S, Soric A, Tomas S, Molle B, Roche N (2014) Biofilm development in micro-irrigation emitters for wastewater reuse. Irrig Sci 32:77-85
Gouidera M, Bouzida J, Sayadi S, Montiel A (2009) Impact of orthophosphate addition on biofilm development in drinking water distribution systems. J Hazard Mater 167:1198-1202
Habouzit F, Gaëlle G, Hamelin J, Steyer JP, Bernet N (2011) Influence of support material properties on the potential selection of Archaea during initial adhesion of a methanogenic consortium. Bioresource Technology 102:4054-4060
Horn H, Rciff H, Morgenroth E (2003) Simulation of growth and detachment in biofilm systems under defined hydrodynamic conditions. Biotech Bioeng 81(5):607-617
Katz S, Dosoretz C, Chen Y, Tarchitzky J (2014) Fouling formation and chemical control in drip irrigation systems using treated wastewater. Irrig Sci. 32:459-469.
Lamm FR, Camp CR (2007) Subsurface drip irrigation. Chapter 13 in Microirrigation for Crop Production -Design, Operation and Management. F.R. Lamm, J.E. Ayars, and F.S. Nakayama (Eds.), Elsevier Publications. 473-551
Li Y, Zhou B, Liu Y, Jiang Y, Pei Y, Shi Z (2013) Preliminary surface topographical characteristics of biofilms attached on drip irrigation emitters using reclaimed water. Irrig Sci 31(4):557-574
Liu HS, Li YK, Liu YZ, Yang PL, Ren SM, Wei RJ, Xu HB (2010) Flow characteristics in energy dissipation units of labyrinth path in the drip irrigation emitters with DPIV technology. Journal of Hydrodynamics Ser B 22 (1):137-145
Luckham, PF, Rossi S (1990) The colloidal and rheological properties of bentonite suspensions. Advances in Colloid and Interface Science 82:43-92
Luquet D, Vidal A, Smith M, Dauzat J (2005) ‘More crop per drop’: how to make it acceptable for farmers?. Agricultural Water Management 76(2):108-119
Nakayama FS, Bucks DA (1981) Emitter clogging effects on trickle irrigation uniformity. Trans. ASAE 24 (1):77-80
Nakayama FS, Bucks DA (1991) Water quality in drip/trickle irrigation: a review. Irrig Sci 12(4):187-192 Niu W, Liu L, Chen X (2013) Influence of fine particle size and concentration on the clogging of labyrinth emitters. Irrig Sci 31(4):545-555
Oliveira FC, Lavanholi R, Camargo AP, Frizzone JA, Ait Mouheb N, Tomas S, Molle B (2017) Influence of Concentration and Type of Clay Particles on Dripper Clogging. Journal Irrigation & Drainage Systems Eng 6:184. DOI: 10.4172/2168-9768.1000184
Oron G, Shelef G, Turzynski B (1979) Trickle irrigation using treated wastewaters. J Irrig Drain Div 105: 175-186
Phene CJ, Bucks DA, Hutmacher RB, Ayars JE (1993) Research successes, applications and needs of subsurface drip irrigation, 15th Congress on Irrigation and Drainage, ICID-CIID, La Hague, Netherlands, 30 August- September. 249-267
Pitts DJ, Haman DZ, Smajstrla AG (2003) Causes and prevention of emitter plugging in microirrigation systems. BUL258, Gainesville, University of Florida, IFAS, Extension
Pope SB (2000) Turbulent flows. Cambridge University Press, London
Qian J, Horn H, Tarchitzky J, Chen Y, Katz S, Wagner M (2017) Water quality and daily temperature cycle affect biofilm formation in drip irrigation devices revealed by optical coherence tomography. Biofouling 33 (3):211-221
Ravina I, Paz Z, Sofer A, Marcu A, Shisha A, Sagi G Ravina E, Sofer Z, Marcu A et al (1992) Control of emitter clogging in drip irrigation with reclaimed wastewater. Irrig Sci 13(3):129-139
Rittmann BE (1982) The effect of shear stress on biofilm loss rate. Biotech Bioeng 24(2):501-506
Rizk N, Ait-Mouheb N, Bourrié G, Molle B, Roche N (2017) Parameters controlling chemical deposits in micro-irrigation with treated wastewater. J Water Supply Res T 66 (8):587-59
Stawinski J, Wierzcho J, Garcia-Gonzalez M T (1990) The influence of calcium and sodium concentration on the microstructure of bentonite and kaolin. Clays and Clay Minerals 38(6): 617-622
Tarchitzky J, Rimon A, Kenig E, Dosoretz CG, Chen Y (2013) Biological and chemical fouling in drip irrigation systems utilizing treated wastewater. Irrig Sci 31(6):1277-1288
Wang J, Gong S, Xu D, Yu Y, Zhao Y (2013) Impact of drip and level basin irrigation on growth and yield of winter wheat in the North China Plain. Irrig Sci 31(5):1025-1037
Wei Z, Cao M, Tang Y, Lu B (2009) Two-phase flow analysis and experimental investigation of micro-PIV for emitter micro-channels. Seventh International Conference on CFD in the Minerals and Process Industries. CSIRO, Melbourne, Australia
Wu IP, Gitlin HM (1983) Drip irrigation application efficiency and schedules. Trans Am Soc Agric Eng 26(1):92-99
Zhang J, Zhao WH, Tang YP, Lu BH (2010) Anti-clogging performance evaluation and parameterized design of emitters with labyrinth channels. Comput Electron Agric 74:59-65
Zhou B, Li YK, Song P, Xu ZC, Bralts VF (2016) A kinetic model for biofilm growth inside non-PC emitters under reclaimed water drip irrigation. Agric. Water Manage 168:23-34
Fig. 3 (a) Transparent milli-fluidic device (b) Experimental setup with optical system
Fig. 4 Observation zone boundaries inside the labyrinth channel
Fig. 3 Mean velocity fields obtained numerically along the labyrinth channel and velocity streamlines
in the 3rd baffle at z=0.5 mm and Re=400 x mm ym m Mean velocity [m:s! 1]; Re = 400 -16 -14 -12 -10 -8 -6 -4 -2 0 0 2 4 0.2 0.4 0.6 0.8 1 x mm ym m
Mean velocit y st reamline [m:s! 1], Re= 400
-10 -9 -8 0 0.5 1 1.5 2 2.5 0.2 0.4 0.6 0.8 1 Inlet flow
Fig. 4 Mean velocity modulus profiles at lines 3, 4 and 5 for Re=400
Fig. 5 Kaolin particle deposition in the labyrinth-channel at t=24h - zone 1 (a), zone 3 (b), zone 5 (c),
zone 7 (d), zone 13 (e) and zone 35 (f)
Fig. 6 Kaolin particle deposition in the labyrinth-channel over time (third zone) at t=6h (a), t=24h (b)
and t=53h (c) 0 0.5 1 1.5 2 2.5 0 0.2 0.4 0.6 y [mm] ve lo ci ty [m :s !1 ] Line 3 Line 4 Line 5 D2 d3 d1 d2 10 mm 10 mm section I:I Line 1 Line 2 Line 3 Line 4 Line 5 di nl et Flow direction I I di nl et ddepth Inlet Outlet doutl et (a) (b) (c) (a) (b) (c) (d) (e) (f)
16
Fig. 7 Bentonite solution without NaCl - (a) zone 5 (b) zone 7 and (c) zone 35 after seven days of
experiment
Fig. 8 Kaolin with NaCl solution deposition in zone 1 (a), 3 (b) and 5 (c) at t=71 hours
(a) (b) (c) (a) (b) (c) (a) (b) (c)
Fig. 9 Biofilm formation after t=18hours (a) zone 1 (b) zone 3 (c) zone 5 and (d) zone 7
Fig. 10 Turbulent kinetic energy field obtained by CFD simulation at locations adjacent to the wall
(z=0.05mm) for Re=400
x mm
ym
m
Turbulent kinetic energy(k) [m2:s! 2]; Re= 400
-16 -14 -12 -10 -8 -6 -4 -2 0 -1 0 1 2 3 4 0.02 0.04 0.06 0.08 0.1 0.12 Inlet flow