Publisher’s version / Version de l'éditeur:
Vous avez des questions? Nous pouvons vous aider. Pour communiquer directement avec un auteur, consultez la Questions? Contact the NRC Publications Archive team at
[email protected]. If you wish to email the authors directly, please see the first page of the publication for their contact information.
https://publications-cnrc.canada.ca/fra/droits
L’accès à ce site Web et l’utilisation de son contenu sont assujettis aux conditions présentées dans le site LISEZ CES CONDITIONS ATTENTIVEMENT AVANT D’UTILISER CE SITE WEB.
Review of Scientific Instruments, 90, 5, 2019-05
READ THESE TERMS AND CONDITIONS CAREFULLY BEFORE USING THIS WEBSITE. https://nrc-publications.canada.ca/eng/copyright
NRC Publications Archive Record / Notice des Archives des publications du CNRC :
https://nrc-publications.canada.ca/eng/view/object/?id=4d4c132b-2f05-4572-b2b6-78fd37ed86d2
https://publications-cnrc.canada.ca/fra/voir/objet/?id=4d4c132b-2f05-4572-b2b6-78fd37ed86d2
This publication could be one of several versions: author’s original, accepted manuscript or the publisher’s version. / La version de cette publication peut être l’une des suivantes : la version prépublication de l’auteur, la version acceptée du manuscrit ou la version de l’éditeur.For the publisher’s version, please access the DOI link below./ Pour consulter la version de l’éditeur, utilisez le lien DOI ci-dessous.
https://doi.org/10.1063/1.5090583
Access and use of this website and the material on it are subject to the Terms and Conditions set forth at
Towards a transportable aluminium ion quantum logic optical clock
Hannig, S.; Pelzer, L.; Scharnhorst, N.; Kramer, J.; Stepanova, M.; Xu, Z. T.;
Spethmann, N.; Leroux, I. D.; Mehlstäubler, T. E.; Schmidt, P. O.
quantum logic optical clock
Cite as: Rev. Sci. Instrum. 90, 053204 (2019); https://doi.org/10.1063/1.5090583
Submitted: 29 January 2019 . Accepted: 07 May 2019 . Published Online: 31 May 2019
S. Hannig, L. Pelzer, N. Scharnhorst, J. Kramer, M. Stepanova, Z. T. Xu, N. Spethmann, I. D. Leroux, T. E. Mehlstäubler, and P. O. Schmidt
COLLECTIONS
This paper was selected as an Editor’s Pick
ARTICLES YOU MAY BE INTERESTED IN
Closed-cycle, low-vibration 4 K cryostat for ion traps and other applications
Review of Scientific Instruments
90, 065104 (2019);
https://doi.org/10.1063/1.5088593
A cryogenic radio-frequency ion trap for quantum logic spectroscopy of highly charged
ions
Review of Scientific Instruments
90, 073201 (2019);
https://doi.org/10.1063/1.5100594
Magnetic field stabilization system for atomic physics experiments
Towards a transportable aluminium ion
quantum logic optical clock
Cite as: Rev. Sci. Instrum. 90, 053204 (2019);doi: 10.1063/1.5090583
Submitted: 29 January 2019 • Accepted: 7 May 2019 • Published Online: 31 May 2019
S. Hannig,1 L. Pelzer,1 N. Scharnhorst,1,2 J. Kramer,1 M. Stepanova,1,2 Z. T. Xu,3 N. Spethmann,1 I. D. Leroux,1,a)
T. E. Mehlstäubler,1 and P. O. Schmidt1,2,b)
AFFILIATIONS
1Physikalisch-Technische Bundesanstalt, Bundesallee 100, 38116 Braunschweig, Germany
2Institut für Quantenoptik, Leibniz Universität Hannover, Welfengarten 1, 30167 Hannover, Germany
3MOE Key Laboratory of Fundamental Physical Quantities Measurement, School of Physics, Huazhong University of Science
and Technology, 430074 Wuhan, People’s Republic of China
a)Current address: National Research Council Canada, Ottawa, Ontario K1A 0R6, Canada. b)Author to whom correspondence should be addressed:[email protected]
ABSTRACT
With the advent of optical clocks featuring fractional frequency uncertainties on the order of 10−17 and below, new applications such as chronometric leveling with few-centimeter height resolution emerge. We are developing a transportable optical clock based on a single trapped aluminum ion, which is interrogated via quantum logic spectroscopy. We employ singly charged calcium as the logic ion for sympathetic cool-ing, state preparation, and readout. Here, we present a simple and compact physics and laser package for manipulation of40Ca+. Important features are a segmented multilayer trap with separate loading and probing zones, a compact titanium vacuum chamber, a near-diffraction-limited imaging system with high numerical aperture based on a single biaspheric lens, and an all-in-fiber40Ca+repump laser system. We present preliminary estimates of the trap-induced frequency shifts on27Al+, derived from measurements with a single calcium ion. The micromotion-induced second-order Doppler shift for27Al+has been determined to beδνEMM
ν = (−0.4
+0.4
−0.3) × 10−18and the black-body radia-tion shift is δνBBR/ν = (−4.0 ± 0.4) × 10−18. Moreover, heating rates of 30 (7) quanta per second at trap frequencies of ωrad,Ca+≈ 2π × 2.5 MHz (ωax,Ca+≈ 2π × 1.5 MHz) in radial (axial) direction have been measured, enabling interrogation times of a few hundreds of milliseconds. © 2019 Author(s). All article content, except where otherwise noted, is licensed under a Creative Commons Attribution (CC BY) license (http://creativecommons.org/licenses/by/4.0/).https://doi.org/10.1063/1.5090583
I. INTRODUCTION
For more than 50 years, the definition of the SI-second has been based on the transition frequency between the two hyperfine levels of the ground state of the cesium-133 atom, which lies in the microwave regime. The SI-second is realized in cesium foun-tain primary frequency standards, achieving a fractional frequency inaccuracy in the low 10−16range.1–4Clocks based on optical transi-tions facilitate substantially lower fractional frequency uncertainties, as their transition frequencies can be up to 105times higher for com-parable linewidths. In the last decade, optical clocks5,6surpassed the best microwave fountain clocks by achieving 10−17 estimated sys-tematic uncertainties.7–11Besides enabling a possible future redefi-nition of the SI-second,12,13they also allow for the search for a vari-ation of fundamental constants14–16and pave the way toward new
applications such as chronometric leveling,17,18where the differen-tial gravitational red shift is measured by comparing two spadifferen-tially separated clocks to determine their height difference.19,20 Trans-portable optical clocks that have been calibrated to a reference clock are required to facilitate this novel approach by deploying them at geodetically relevant sites and comparing them to the reference clock, e.g., through phase-stabilized optical fiber links.21–24A trans-portable optical single Ca+ clock has been reported25 to reach a systematic uncertainty of 7.8× 10⁻¹⁷in a system occupying a vol-ume of less than 1 m3. Furthermore, a87Sr optical lattice clock with an estimated fractional systematic uncertainty of 7× 10⁻¹⁷has been installed in a car trailer.26It has been employed in the first measure-ment campaign involving a transportable optical clock to determine the gravitational red shift of the Modane underground laboratory relative to clocks at INRIM (Turin).27
Aluminum is a promising candidate for a high-accuracy single-ion clock since it has the smallest black-body radiatsingle-ion shift of all realized optical frequency Refs.28and29. Therefore, the difficult-to-control temperature environment seen by the atoms needs to be known to only 18.2 K at room temperature30to reach 10−18 sys-tematic uncertainty of this shift, instead of the few-10 mK uncer-tainty required for, e.g., Sr.9 Moreover, Al+ has only small linear and quadratic Zeeman shifts31and negligible quadrupole shift.32The dominant shifts for Al+are second-order Doppler shifts from secular and micromotion, which are both trap related and will be addressed in this work.
Direct cooling and state detection of Al+ requires deep ultra-violet (UV) radiation at 167 nm, which to our knowledge is not commercially available. This challenge can be overcome by quantum logic spectroscopy,33where a clock ion and an additional so-called logic ion of a different species are confined in the same trap. The logic ion provides sympathetic cooling to the clock ion in case of the Al+ clock.34 For readout, the internal state of the clock ion is transferred to the logic ion via a shared motional mode using a series of laser pulses. Afterward, the internal state of the logic ion is determined by electron shelving detection.
The first Al+ clocks were operated at NIST8,31,35 and have been evaluated to a fractional systematic uncertainty of as low as 8.6× 10⁻¹⁸. Using these clocks, the first optical-clock-based labora-tory measurement of the dependence of the gravitational red shift on a change in the height difference has been performed.36Since then, a number of groups have started new Al+clock setups,37–39including our own at PTB.40,41
Here, we report on the characterization of PTB’s second Al ion clock setup which is operated with40Ca+as logic ion. It is designed for transportability to enable side-by-side comparisons with other clocks and to perform chronometric leveling in a nonlaboratory environment. The entire physics package is nonmagnetic since all metal parts are made of titanium. The measurements are conducted in a laser-cut segmented multilayer ion trap made of the printed circuit board material Rogers
®
4350. The trap includes on-chip fil-tered compensation electrodes and temperature sensors.42,43Atomic beams of the required species are produced by ablation44,45with a pulsed Nd:YAG laser that is frequency doubled to 532 nm. A pho-toionization pulse, following the ablation pulse after an adjustable time of flight (TOF), allows kinetic-energy-selective loading of27Al+. All required wavelengths for Ca+ cooling, repumping, and coher-ent manipulation are generated directly from diode lasers. The repumper laser system for Ca+is fully fiberized and therefore com-pact and robust. All laser systems are mounted on breadboards that can be stacked up to reduce the footprint of the system.We demonstrate single Ca+imaging with a diffraction-limited resolution of 0.79 µm in the object plane by using a custom bias-pheric lens (ASL) and a compact standard scientific complementary metal-oxide-semiconductor (CMOS) camera. 10% of the fluores-cent light is directed to the camera, while 90% is directed toward a photomultiplier tube (PMT). With the CMOS camera, we obtain a signal-to-noise ratio (SNR) of 80 for a region of interest around a single ion and a 300 ms exposure time, while the PMT provides state discrimination with an error of below 0.2% for 25 µs detection time. We have compensated excess micromotion (EMM) down to an overall residual ac electric field of (67.8± 6.9) V/m at the trap center, which corresponds to a fractional frequency second-order Doppler
shift of δνEMM
ν = (−0.4
+0.4
−0.3) × 10−18for a single Al+. Ground state cooling of a single Ca+has been achieved in all three modes.
The paper is structured as follows: in Sec.II, we introduce the reduced term schemes of the involved ions. In Sec.III, we describe the experimental setup. The results on the imaging performance, micromotion compensation, heating rate measurements, and Al+ initial cooling times after ablation loading are presented in Sec.IV, including a partial uncertainty budget.
II. ION SPECIES
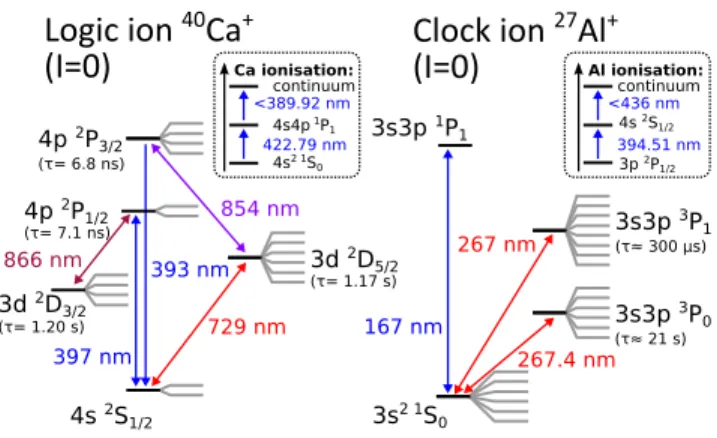
Figure 1shows the reduced level schemes for27Al+and40Ca+ including the transitions relevant for a 27Al+/40Ca+ clock. Alu-minum features an 8 mHz narrow clock transition at 267.4 nm connecting the1S0ground state to the (20.6± 1.4) s long lived31 3P
0level and a “logic” transition at 266.9 nm46connecting the1S0 ground state to the 3P1, F = 7/2 excited state suitable for state preparation and readout. We employ sympathetic cooling47,48of the clock ion with an ion of another species and quantum logic spec-troscopy33,35to transfer the internal state of27Al+to the logic ion via a shared motional mode. The logic ion needs to provide acces-sible closed transitions for Doppler cooling and electron shelving detection.49Furthermore, a mass ratio of the species close to unity is advantageous to enable efficient sympathetic cooling.3440Ca+is an advantageous choice as logic ion especially for a transportable clock since all required wavelengths can be generated in compact and reliable diode lasers and guided in commercially available opti-cal fibers, which allow for a modular setup. Moreover, quantum logic operations on40Ca+are very well developed through its use in quantum information processing,50while its mass still matches well with27Al+.
40Ca+ provides a cooling transition at 396.847 nm51 with a
linewidth of 22.4 MHz, inferred from its 7.1 ns52upper state life-time. Since the upper2P1/2 level decays with a branching ratio of 0.064 35(7)53 to the metastable 2D3/2 level with a lifetime54 of 1.195(8) s, a repumping laser at 866.214 nm55is required. Electron shelving is implemented on the 137 mHz narrow quadrupole transi-tion54at 729.147 nm.56,57For initialization and sideband cooling, the upper2D5/2level is cleared out via a 854.209 nm laser58to the 6.8 ns
FIG. 1. Reduced Ca+and Al+level schemes (not to scale). Gray lines depict the Zeeman levels when an external magnetic field is applied. The insets show the employed ionization schemes for neutral atoms of both species consisting of a first resonant and a second nonresonant step in both cases.
short lived582P3/2level which decays predominantly to the ground state, quenching the 729 nm transition.
III. EXPERIMENTAL SETUP
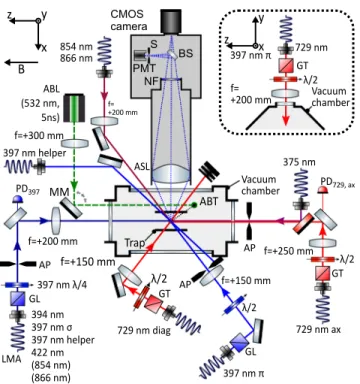
Figure 2shows two schematic cross sections of the vacuum chamber and the surrounding optics. We chose a segmented mul-tilayer linear Paul trap with an ion-electrode distance of 700 µm based on precisely aligned stacked 250 µm thick RogersTMprinted circuit boards as described by Herschbach et al.42for its low excess micromotion43 and heating rates.59 The electrode structures are laser cut. All conductive structures are coated with a NiPdAu plat-ing, where a 3 µm–7 µm thick nickel layer provides adhesion for a 0.05 µm–0.25 µm thick palladium and 300 nm thick gold layer. The stack is glued onto a rigid carrier board made of AlN that provides a good thermal connection to the environment. The trap features multiple zones for loading and operating the clock. The experiment zones are 1.0, 1.5, and 2.0 mm long, respectively. These different lengths allow for a compromise between the max-imum achievable axial trap frequency for a given voltage and the
FIG. 2. Schematic horizontal cross section of the vacuum chamber and the sur-rounding optics (not to scale). The ablation laser (ABL) spot on the ablation target (ABT) is aligned via the motorized mirror (MM). Fluorescence light is collected with a 42.6 mm effective diameter biaspheric lens (ASL) through a viewport. Behind a spectral notch filter (NF), a beamsplitter (BS) directs 10% on a CMOS camera and 90% through a spatial filter onto a photomultiplier tube (PMT). The imaging system has been designed for 18-fold magnification. All beams required for Ca+loading and coherent manipulation are delivered via various polarization-maintaining and large mode area (LMA) glass fibers. GL: Glan Laser polarizer, GT: Glan Taylor polarizer,λ/n: waveplate, AP: aperture, PDi: power monitoring, lenses are
speci-fied by their focal length f. Inset: Vertical cross section with optics on top viewport. Three orthogonal pairs of magnetic field coils surrounding the chamber are not depicted for clarity.
homogeneity of the axial field.42 Moreover, it is possible to, e.g., trap multiple ion ensembles in different zones of the trap simultane-ously, allowing for dead time-free interleaved interrogation of two clocks60in a single trap or other multiensemble protocols61,62in the future.
Several small mirrors are mounted directly on the trap in prepa-ration for future interferometric stabilization of the path length from the clock laser to the trap. Radial ion confinement is provided by a radio-frequency (rf) potential, driven by a frequency generator (Marconi 2024; all brand names are given for illustrative purpose and not a sign of endorsement) operating at 24.65 MHz. This is the “magic” drive frequency for Ca+, at which the second-order Doppler and ac Stark shift of the trap drive cancel.57,63The rf voltage is ampli-fied and the drive circuit impedance matched to the trap by a helical resonator64,65 with a loaded quality factor of Q≈ 300. Low-noise and finelytunable dc voltages66 are applied to the trap electrodes for axial confinement and radial micromotion compensation.43,63,67 All dc electrode voltages are filtered directly on the trap boards by first-order RC low-pass filters with a cutoff frequency of∼100 Hz. The vacuum chamber is surrounded by three pairs of magnetic field coils (not shown in the figure) to compensate for external magnetic fields and to define the quantization field Bz= 200 µT, along the trap axis.
The trap is mounted in an octagonal vacuum vessel (Kimball Physics MCF800-SphOct-G2C8) made of titanium alloy (Ti-6Al-4V) with antireflective (AR) coated UV fused silica vacuum windows mounted in titanium flanges. The vacuum is maintained by a com-pact nonevaporative getter and ion pump (SAES Getters NEXTORR D 200-5) and measured using a standard hot cathode gauge. Several broadband AR-coated CF40 and two CF160 viewports grant ade-quate optical access to the trap volume. Since the latter ones protrude beyond the knife-edge into the vacuum by about 25 mm, the bias-pheric lens (ASL) optimized for diffraction-limited imaging of the 397 nm fluorescence photons can be as little as 36.6 mm from the ion. With its effective diameter of 42.6 mm, it covers about 7% solid angle. The fluorescence light is spectrally filtered by a notch filter (NF, Thorlabs FBH400-40) and split 90:10 between a photomulti-plier tube (PMT, Hamamatsu H10682) and a sCMOS camera (PCO edge 4.2LT). While the image plane of the ASL coincides with the CMOS chip, an aperture for spatial filtering is placed in the focus in front of the PMT. In order to allow for a convenient change of the observed trap zone, the entire enclosed imaging system is mounted on a motorized 1d-translation stage to be aligned parallel to the trap axis.
The laser beams for photoionization, cooling, and coherent manipulation of40Ca+ are delivered through various single-mode polarization-maintaining optical fibers and then focused down to spot diameters between 60 and 180 µm at the trap center. In the case of the 397 nm and 729 nm beams, the polarization is cleaned by Glan Laser (GL) and Glan Taylor (GT) polarizers, respectively, and then set by half or quarter waveplates (λ/n). Various photodiodes (PDi) placed behind backside-polished mirrors allow for optical power monitoring and could be used for power stabilization.
A Q-switched and frequency doubled Nd:YAG laser (ABL) at 1064 nm (Continuum Minilite 1) is used for neutral atom beam gen-eration via pulsed ablation from solid targets.44,45,68–70The beam is focused down to a spot diameter of≈200 µm and can be tilted in two dimensions using a motorized mirror (MM) for target selection.
FIG. 3. Schematic horizontal cut through the trap center and the ablation target. The ablation laser beam can be tilted between the different targets to select either species to be loaded. An aperture restricts contamination with ablated material to the loading zone. The target-to-trap center distance is 17 mm. All photoionization lasers are aligned along the trap axis.
Figure 3shows a rendering of the ablation target (ABT) and the trap cut in the horizontal plane. A solid structure made of alu-minum acts as Al ablation target. Calcium grains were glued (Thor-labs 353NDPK Epoxy) in a cutout in the structure (red zone). An aperture between the ablation targets and the trap shapes the plume of neutral atoms (black) generated during ablation into a collimated beam. Additionally, a negative bias voltage can be applied on the tar-get to prevent unwanted ions generated by the ablation pulse from entering the trap. After loading the desired ion crystal in the load-ing zone, it can be shuttled to one of the three spectroscopy zones discussed above.
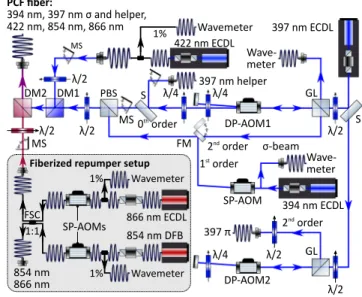
Figure 4shows a schematic overview of the most important parts of the laser system. Laser cooling is implemented with an exter-nal diode laser (ECDL71) at 397 nm that is split into two paths. Each path contains a double-pass (DP) acousto-optical modula-tor (AOM) for frequency tuning by ±50 MHz. The zeroth order of DP-AOM1 is split into two far detuned helper beams for rapid cooling of hot ions.34One of the helper beams is overlapped with the first order of the same AOM after double passing, the reso-nant Ca photoionization laser at 422 nm, and the two repumper beams, and then coupled into a large mode area (LMA) photonic crystal fiber (PCF) (NKT LMA-PM-5) to be delivered along the trap axis as shown in Fig. 2. The second helper is applied diagonally through the loading zone and provides 3d laser cooling. Both helper beams are shuttered individually by mechanical shutters (MS). This configuration allows for loading and cooling in the loading zone and shuttling the ions to the spectroscopy zone without any laser realignments. The repumper beams are generated in a fully fiber-ized part of the setup, starting with an 866 nm ECDL and 854 nm distributed feedback (DFB) (Eagleyard photonics EYP-DFB-0853-00050-1500-BFY02-0000) laser, which are sent through individual fiberized optical isolators. In two fiber splitters, 1% of the power is coupled to a wavelength meter (WLM). Two fiber-coupled single-pass (SP) AOMs are used as fast shutters and for fine-tuning of the laser frequency with a 3 dB bandwidth of±15 MHz. Behind those, both wavelengths enter a 50% fiber combiner, which splits equal contributions to both of its output ports. To reduce power fluctu-ations after the polarization-cleaning elements at the fiber exits, all the aforementioned fibers are polarization-maintaining.
FIG. 4. Schematic layout of the Ca+cooling laser system including the two reso-nant photoionization lasers for both species. The40Ca+cooling laser at 397 nm is split into two paths through a double-pass (DP) AOM each, generating indepen-dent beams forσ- and π-polarization (see alsoFig. 2). The two repumper lasers are part of a compact fully fiberized setup, including optical isolators, fiber-taps to the wavelength meter, fiberized single-pass (SP) AOMs, and fiber-combiners (FSC). Both beams are overlapped with the resonant photoionization laser beams at 422 nm for Ca and 394 nm for Al, before they are coupled into a large mode area photonic crystal fiber (PCF) to be delivered on the trap axis. DM: Dichroic mir-ror, FM: Flip-mirmir-ror, GL: Glan Laser, MS: motorized shutter, PBS: polarizing beam splitter, S: 50/50 splitter,λ/n: waveplate.
A fraction of the light of each laser is sent via two single-mode fiber switches to a wavelength meter (High Finesse U10), which is used for frequency locking of the lasers operating at 397, 422, 854, and 866 nm. The 729 nm Ca+logic laser (not depicted inFig. 4) is locked to an ultrastable reference laser at 1542 nm via a frequency comb72and sent through a double-pass (DP) AOM for frequency tuning by±50 MHz.
The entire optical setup has been built on rigid breadboards with honeycomb core, which are interconnected via optical fibers. These breadboards will be stacked and installed in a standardized cooled 20-ft shipping container together with the remaining setup to make the entire system transportable.
IV. CHARACTERIZATION RESULTS
The following experiments on a single 40Ca+ ion were con-ducted with≈2.2 W of rf drive power to the helical resonator, which yields radial trapping frequencies of ωrad,1 = 2π× 2.65 MHz and ωrad,2= 2π× 2.42 MHz. The axial confinement in the 1 mm long experiment zone results in a trapping frequency of ωax= 2π× 1.64 MHz.
A. Imaging system
The imaging system was designed for high-fidelity state dis-crimination with detection times well below a millisecond. This requires capturing a large solid angle fraction of emitted photons
from a trapped ion and near-diffraction limited performance. The second design goal was the detection of individual ions in a lin-ear string to allow the implemention of a multiion quantum logic clock,73which requires a sufficient optical magnification for typical ion-ion distances of a few micrometers and a field of view of around 100 µm.
We chose a single biaspheric lens due to its simplicity in assem-bly and alignment over more traditional multielement lenses.74 Viewports protruding into the vacuum enabled installation of the lens outside the vacuum chamber without compromising on the minimum distance dmin= 36.6 mm of the first lens surface from the trap center. While a large lens diameter is advantageous in terms of the achievable numerical aperture (NA) and solid angle coverage, it can restrict optical access for diagonal laser beams (seeFig. 2). As a compromise, an outer lens diameter of 50.8 mm was chosen, leading to a 42.6 mm effective optical diameter and a numerical aperture NA = 0.51. A single monochromatic biaspheric lens can be opti-mized to minimize spherical and chromatic aberrations below the diffraction limit for a single point in the object plane. However, a trade-off between diffraction-limited performance and field-of-view needs to be made. We have therefore chosen to optimize the imaging performance for a circular field of view with 100 µm radius.
The imaging system was numerically optimized using a com-mercial ray tracing software (Lambda Research OSLO), where the spheric coefficients, conic constants, and the curvature of the ASL surface facing the camera were free parameters. The damped least square optimization was carried out for an error function resem-bling the root mean squared image spotsize for three point sources separated by a maximum of 0.2 mm in the object plane. The result-ing parameters are listed inTable V. The simulation indicated that the correct adjustment of the lens-to-ion distance is critical for diffraction-limited performance.
Using a Doppler-cooled Ca+ ion loaded into the trap as the source, the ASL-to-ion distance and the CMOS to ASL distance were iteratively varied in order to minimize the ion’s point spread func-tion (PSF) on the camera.Figure 5shows an Airy function fitted to the count distribution on a straight line through the center of the PSF, depicted as red dashed line in the inset. The first mini-mum of the fitted Airy function is found at (0.793± 0.013) µm from the global maximum. The value is given in the object plane, taking the 18-fold magnification of the imaging setup into account, which has been calibrated through an ion-ion distance measurement for known axial trapping frequencies.
This result is less than twice as large as the minimum resolvable distance of two point sources according to the Rayleigh criterion d = 0.61λ/NA≈ 475 nm, where λ = 397 nm is the wavelength and NA = 0.51 the numerical aperture of the imaging system.
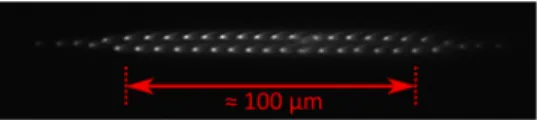
We calculate the FWHM depth of field75to be DOF = ±2⋅NAλ2 = ±0.765 µm. Experimentally, we determine DOF < (5 ± 5) µm, lim-ited by the resolution of the employed precision translation stage. The biaspheric lens has been design for diffraction limited imaging in a field of view of 100 µm.Figure 6shows an image of a40Ca+ion crystal. A comparison of the PSFs of the central with the outer ions demonstrates that the imaging performance is practically constant over that length. The decrease in brightness toward the ends of the crystal is due to the limited diameter of the cooling laser beam.
We estimate the Strehl ratio76 (SR) for the biaspheric lens alone as
FIG. 5. Point spread function of a single Ca+ on the sCMOS chip (lower x-axis). Inset: photo of a single40Ca+ion. Red: measured intensity profile along the dashed line in the inset with electronic background subtracted, blue: fit. The upper scale gives the corresponding dimensions in the object plane taking into account the magnification of the imaging system. Fitting the functionf (x) =I ⋅ (2⋅J1(a(x−x0))
a∗(x−x0)
) 2
to the data resulted in a = (1.62 ± 0.03) pixel−1pixel, which is equivalent to (0.793 ± 0.013)µm in the object plane.
SR= exp(−(2πσ
λ )
2
) = 0.87, (1)
where we have taken σ to be the total root-mean-squared form devi-ations of the aspheric surfaces measured by the manufacturer and λ the wavelength. Wavefront aberrations of other optical elements in the imaging system, such as the vacuum windows and filters, will further reduce the Strehl ratio of the entire imaging system.
For a typical 300 ms exposure time of the sCMOS camera, we obtain≈11 500 counts in a 10 × 10 pixel2region of interest including the image of a40Ca+ion in the center with negligible contributions of scattered light from the cooling laser. The camera has a constant electronic offset of 99.3 counts with a rms noise of 1.9 counts in the absence of an ion, both numbers are given per pixel. Neglecting the constant offset, this results in an effective signal of≈1570 counts and a signal to noise ratio of≈80.
With the PMT, we measure a dark count rate of below 0.1 kHz and a count rate of(5.1 ± 2.3) kHz due to scattered light at 397 nm. For a single40Ca+, we obtain a bright count rate of(351 ± 19) kHz, which is 55% of the expected value of≈638 kHz at saturation, derived from 22.4 MHz linewidth divided by a factor of four arising from the equal distribution of the population over the2S1/2,2P1/2, and 2D
3/2levels in saturation,407% solid angle covered by the biaspheric lens, and a total transmission of 86% through the optical system including the notch filter, the 90% beam sampler reflectivity, and a
FIG. 6. Image of a 2d40Ca+ion crystal. The imaging performance is practically constant over a length scale of 100µm.
photon counting efficiency of 0.3 specified by the manufacturer of the PMT. The reduction in count rate is compatible with aberration losses from specified wavefront errors in the optical imaging system, such as the Strehl ratio given in Eq.(1).
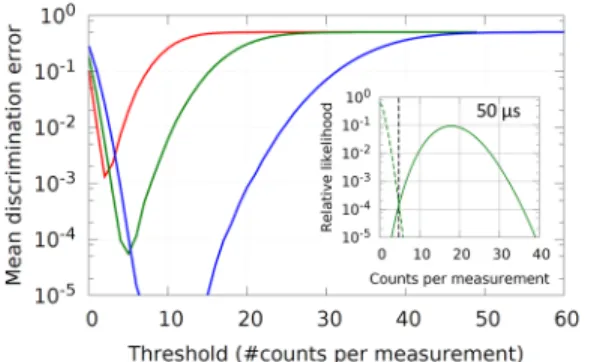
For state detection via electron shelving, it is required to distin-guish between the ion being in the S1/2ground state (ion bright) and in the excited D5/2 state (ion dark). We chose the threshold technique77in which a threshold count is set above which the ion is declared bright. InFig. 7, the mean state discrimination error is shown as a function of this threshold. The inset shows the measured photon count distributions for a bright (dark) ion in red (blue), which was prepared by applying (blocking) the 866 nm repumper laser during Doppler cooling. For the chosen detection time of 50 µs, the two distributions partially overlap. Therefore, any choice of the discrimination threshold (black dashed line) leads to a mean discrimination error of78
𝜖=pb(n ≤ nth) + pd(n > nth)
2 , (2)
where n is the measured number of photons, nththe threshold set, and pb(pd) the probability to measure a bright (dark) ion. Thus, the numerator expresses the probability of a wrong state assignment to the measurement result. In the main figure, this error is plotted as a function of the discrimination threshold for 25 µs (50 µs/100 µs) detection time in red (green/blue). The red curve shows that a mean state discrimination error of below 0.2% for 25 µs detection time can be achieved, which improves to below 10−5for 100 µs detection time.
B. Wavelengthmeter frequency drift
The frequencies of the 397, 422, 854, and 866 nm are locked to a wavelength meter (WLM), which must therefore be continu-ously available. The drift of the WLM limits how long it can run between recalibrations, which interrupt clock operation. While the general approach used here is similar to previous work,79–81 we employ single-mode fiber-switches connected via photonic crystal
FIG. 7. State discrimination error for various detection times. The red (green/blue) curve shows the mean state discrimination error as a function of the discrimination threshold for 25µs (50 µs/100 µs) detection time. The inset shows the photon count distribution measured for 50µs detection time for a bright (dark) ion in red (blue) and a discrimination threshold of 5 counts per measurement indicated by the dashed black vertical line.
single-mode fibers to the WLM and do not perform any calibration of the WLM during the measurements.
To characterize the readout frequency drift, the frequencies of the 729 and 397 nm laser were recorded while both lasers were transfer-locked to a highly stable reference laser at 1542 nm,72which typically drifts by less than 10 kHz per day. All devices were oper-ated in a laboratory environment with±0.2 K temperature stability during the measurement according to the temperature log of the air conditioning system. The WLM was placed on a vibration damped breadboard and covered by a noninsulating box to minimize air turbulence around the device. The temperature and air pressure measured by internal sensors of the WLM were recorded.
The results are shown inFig. 8. The measured frequency of the 397 nm (729 nm) laser drifts by−0.190 MHz/h (−0.171 MHz/h). Both measurements fluctuate by approximately 1.0 MHz peak-to-peak on a time scale of 1 h. The linear drifts are less than half of the values reported by Saleh et al.80 for a thermally isolated WLM from the same manufacturer but from another product series (WS-7). Moreover, the drifts reported here are more than two orders of magnitude smaller than the value obtained by Kobtsev et al.81for another series (WS-8). Since the drifts are small compared to the nat-ural linewidth of the Doppler cooling and repumping transition, the WLM is well suited to lock the lasers listed above. The resonant Al ionization laser could also be locked in this fashion, though we have not yet done so. This simplifies the setup compared to other solu-tions such as individual reference cavities for all lasers and is more cost efficient than a frequency comb.72
Figure 9shows the Allan deviations derived from the frequency recordings after subtraction of the individual linear drifts. In both cases, the Allan deviation stays below 3 × 10⁻¹⁰ over the entire range of averaging times. This is comparable to the results measured by Saleh et al.80 and about a factor of three lower than the values reported by Couturier et al.79
C. Ground state cooling
The second-order Doppler shift on the27Al+ clock transition is a significant contribution to the error budget, as will be discussed
FIG. 8. Frequency drift of the 397 and 729 nm laser measured by the wave-length meter (WLM). Both lasers were transfer-locked to an ultrastable reference. Top: blue (red): measured 397 nm (729 nm) frequency, black solid (dashed): lin-ear fits. Middle: atmospheric pressure drift. Bottom: temperature measured by the WLM (red) and on top of the box covering the WLM (blue). All offsets have been removed. The linear fit results in a drift of (−0.190 ± 0.001) MHz/h [(−0.171 ±0.001) MHz/h] for 397 nm (729 nm). The residuals are normally distributed with a FWHM of approximately 0.4 MHz.
FIG. 9. The curves show the fractional frequency Allan deviation of the wavelength meter measurements at 397 nm (blue) and 729 nm (red). Both lasers were fre-quency stabilized to an ultrastable reference. The linear drift has been subtracted. The measurements were taken simultaneously over 15 000 s.
in Sec.IV E. It can be reduced by cooling the clock ion. Moreover, quantum logic spectroscopy requires ground state cooling of the motional mode used to transfer the electronic state of the clock ion to that of the logic ion.33The implementation of ground state cooling requires that the ion has a Lamb-Dicke factor η< 1 and to be in the resolved-sideband regime. Requiring η< 1 corresponds to the recoil energy from a single absorbed or emitted photon being less than the energy spacing between harmonic oscillator levels in the trap. This ensures that the heating rate from dissipation via photon scatter-ing can be made small enough to reach the ground state.82In the regime η≪ 1, transitions that change the motional quantum num-ber by more than 1 are strongly suppressed. In the resolved-sideband regime, the linewidth of the cooling transition is much smaller than the frequency of the motional mode to be cooled. In this situation, carrier transitions between electronic states that do not change the motional quantum number and red (blue) sideband (RSB/BSB) tran-sitions that reduce (increase) the motional state by one quantum can be spectrally addressed by a sufficiently narrow laser. Phonons can be removed from the harmonic motion by driving a RSB followed by a dissipative electronic state reinitialization. We chose to imple-ment pulsed sideband cooling83on the S1/2− D5/2transition with repumping via the P3/2state. For typical radial (axial) trapping fre-quencies of ωrad,Ca+≈ 2π × 2.5 MHz (ωax,Ca+≈ 2π × 1.5 MHz) and an angle of 60○(45○) between the mode to be cooled and the 729 nm beam, we obtain ηrad≈ 0.04 and ηax≈ 0.06.
Figure 10 shows the experimental sequence starting with a 500 µs long Doppler cooling pulse 10 MHz red detuned from the carrier, followed by 3 µs optical pumping to the2S1/2, mJ =−1/2 ground state. Then, a series of interleaved 729 nm red sideband and 854 nm clearout pulses cools the ion near the motional ground state. The 729 nm pulses are approximate RSB π-pulses for n = 1 to n = 0 on the ∆m =−2 transition since repumping the D5/2, mJ=−5/2 state via the P3/2, mJ =−3/2 state only populates the initial state. The latter choice ensures a closed cooling cycle. A 3 µs optical pump-ing pulse after every fifth clearout pulse restores the preparation to the electronic ground state2S1/2, mS =−1/2. An optional waiting time for heating rate measurements, electron shelving on the 729 nm transition, and a final state detection phase conclude the sequence.
FIG. 10. Sideband cooling sequence. Colored lines represent active lasers. The optional waiting time is required for heating rate measurements.
The mean occupation number n is determined from the exci-tation IRSB (IBSB) of the first order red (blue) sideband,84,85 both probed with the π-time of the blue sideband to maximize SNR
n= I 1 BSB IRSB − 1
. (3)
We use≈70 sideband cooling pulses, the minimum number needed to reach the steady state occupation n≈ 0.05.
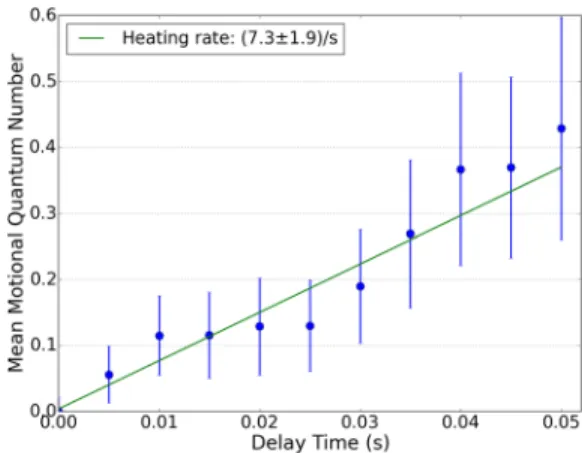
For the heating rate measurements, the waiting time t in the sideband cooling sequence was varied between 0 and 200 ms. A linear function fit to the obtained n(t) yields the heating rate, as shown inFig. 11for the axial mode.Table Isummarizes the heat-ing rates and temperatures for all three motional modes. The final ¯n is limited by unsuppressed high frequency noise on the 729 nm laser, which leads to off-resonant carrier excitation during the red sideband pulse.72
D. Micromotion compensation
Micromotion of ions induced by the confining rf-field causes second-order Doppler shifts whose uncertainties can significantly contribute to the error budget of an optical 27Al+ clock.8 While intrinsic micromotion is an unavoidable feature of rf traps, the
FIG. 11. Example of a heating rate measurement in the axial direction. Shown is the average motional quantum number as a function of the waiting time in the sideband cooling sequence (seeFig. 10) and a linear fit to the data (green). The error bars are derived from the statistical uncertainty of the sideband excitation measurements.
TABLE I. Single Ca+ground state motional quantum numbers, heating rates after
sideband cooling and micromotion compensation, and electric field noise power spectral density at the secular mode frequencies.
Direction ω(MHz)2π n ˙n(s−1) SE(ωj)( V 2 m2Hz) Axial 1.64 0.06± 0.02 7.3± 1.9 (8.2 ± 2.1) × 10−14 Radial I 2.42 0.04± 0.03 30± 4 (5.0± 0.7) × 10−13 Radial II 2.65 0.13± 0.08 30± 8 (5.5± 1.5) × 10−13
so-called excess micromotion (EMM) arising from phase differences in the applied rf field, stray electric fields that push the ion away from the nodal line of the radial electric quadrupole field, and imperfec-tions of the electrode geometry can be minimized.63,67 To obtain less than 1× 10⁻¹⁸ fractional second-order Doppler shift due to EMM for an27Al+ ion clock, the residual micromotion fields have to be kept below 66 V/m over an axial distance equal to the spatial extent of an27Al+/40Ca+crystal under typical operating conditions. Therefore, the trap wafers of the multilayer trap have to be aligned on the 10 µm and 0.1 mrad level.42The conductors for the trap-ping rf potentials have to be length- and capacity-matched to avoid a phase shift between the electrodes. Following Ref. 63, we esti-mate a required length-matching of 0.1 mm to keep the additional fractional second-order Doppler shift below 1× 10⁻¹⁸. Micromo-tion from stray dc fields can be strongly suppressed by applying dc voltages to trap electrodes that compensate the external field.
Intrinsic and residual EMM can be measured using several techniques.63,67Here, we employ the resolved-sideband method by comparing the excitation rate when driving an rf motional sideband of the ion’s transition spectrum (rmmsb) to the corresponding rate rcar when driving the carrier, as quantified by the sideband modulation index, which is quantified by the sideband modulation index63
βi≈ 2 √
rmmsb rcar
. (4)
It is minimized for three non-coplanar 729 nm probe directions i = xz, y, z (seeFig. 2) to ensure compensation in all directions. In a first step, the ion was moved axially by applying differential volt-ages to neighboring trap zones to minimize excitation on the axial micromotion sideband. Subsequently, the voltages on the compen-sation electrodes in the 1.0 nm long experiment zone were scanned to displace the ion radially while measuring the modulation index for the vertical (y) and diagonal (xz) 729 nm beam. For each of the three 729 nm beams, the rf field in the corresponding direction, as experienced by the ion, is related to β, the ion mass m, the laser wavenumber k, and the charge Q63
Erf,i= βi m⋅ Ω2rf
Q⋅ k . (5)
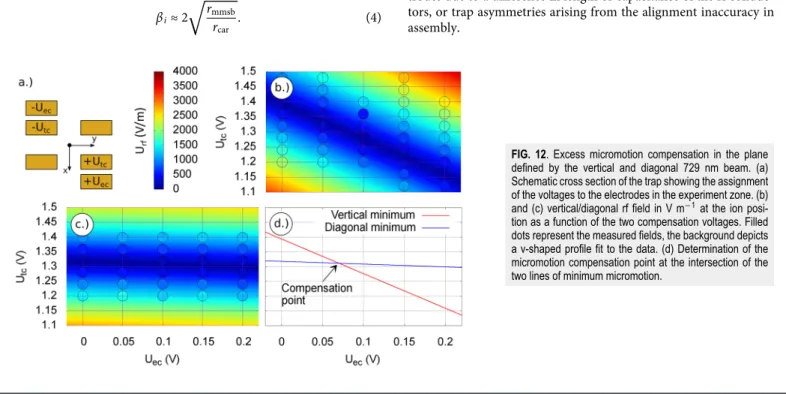
Figure 12(a), shows the assignment of the compensation voltages to the electrodes in the experiment zone. The measured fields are rep-resented by filled dots in panels (b) and (c). The background color depicts the result of fitting a v-shaped profile to the data. In panel (d), the set of compensation voltages for lowest micromotion in the plane spanned by the vertical and diagonal 729 nm laser is determined to be Uec= (0.070± 0.003) V, Utc= (1.311± 0.002) V by intersecting the two resulting lines of minimum micromotion for the two direc-tions. In the last step the axial compensation was repeated while the radial compensation voltages were kept constant, which yielded the field distribution shown inFig. 13.
The residual rf fields at the trap center after EMM compensa-tion are listed inTable II. The field in the x-direction was inferred from the results in the z and xz directions by averaging over all pos-sible phase shifts between those two components. The large uncer-tainty in the shift is a consequence of the unknown phase rela-tion between the fields, which could be overcome by using, e.g., the photon correlation technique.67 Possible reasons for the non-vanishing rf field are a phase difference between the two rf elec-trodes due to a difference in length or capacitance of the rf conduc-tors, or trap asymmetries arising from the alignment inaccuracy in assembly.
FIG. 12. Excess micromotion compensation in the plane defined by the vertical and diagonal 729 nm beam. (a) Schematic cross section of the trap showing the assignment of the voltages to the electrodes in the experiment zone. (b) and (c) vertical/diagonal rf field in V m−1at the ion posi-tion as a funcposi-tion of the two compensaposi-tion voltages. Filled dots represent the measured fields, the background depicts a v-shaped profile fit to the data. (d) Determination of the micromotion compensation point at the intersection of the two lines of minimum micromotion.
FIG. 13. Rf field along the axial direction. Shown is the axial component of the amplitude of the trap drive rf electric field as a function of the ion position along the trap axis. Two vertical lines indicate the possible positions of an27Al+ion in a two ion crystal placed symmetrically around the trap center for a relatively weak axial confinement ofωax,Ca+≈2π × 0.9 MHz.
The findings are comparable with the results obtained with a 172Yb+ in a trap of the same type,43 measured using the same technique.
For typical trap parameters, the two ions of an27Al+/40Ca+ crys-tal are spaced 4.3 µm apart from each other symmetrically around the minimum of the axial dc potential. When the dc potential min-imum and the rf potential minmin-imum do not coincide, the27Al+ion is exposed to a stronger rf field than in the rf minimum. However,
Fig. 13shows that the difference is smaller than 10 V m−1and there-fore does not substantially change the total rf field of 17.4+8.2−4.2V m−1 at the ion position, cf.Table II.
E. Systematic error estimation
The properties of the ion trap and surrounding vacuum sys-tem as measured by a single40Ca+ ion can be used to estimate an error budget for an27Al+/40Ca+clock in the setup presented here, as shown inTable IV. For this, mass dependent shifts are scaled with the mass ratio of27Al+and40Ca+.
We will first consider the contribution from the second-order Doppler or time-dilation shift from secular motion. It is directly related to the total kinetic energy Ekinin all secular motional modes according to
δνsec
ν = −
Ekin
mc2. (6)
TABLE II. Residual rf field at the trap center measured with a single Ca+ion after excess micromotion compensation.
Direction Erf(V m−1)
Trap axis (z) 7.1± 1.6
Vertical (y) 7.9± 1.7
Diagonal (xz) 9.8± 3.0
Optical axis (x, averaged over phase) 13.9+8.5−7.0 Quadrature sum of x (avg), y, and z 17.4+8.2−4.2
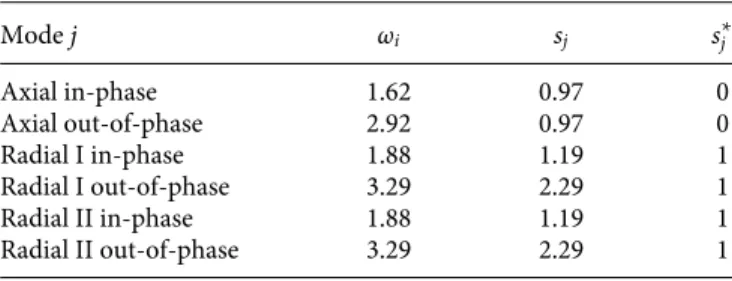
TABLE III. Mode frequencies and scaling factors for the27Al+/40Ca+crystal.
Mode j ωi sj s∗j Axial in-phase 1.62 0.97 0 Axial out-of-phase 2.92 0.97 0 Radial I in-phase 1.88 1.19 1 Radial I out-of-phase 3.29 2.29 1 Radial II in-phase 1.88 1.19 1 Radial II out-of-phase 3.29 2.29 1
During clock interrogation with a probe time Tp, the motional heating of the ion in the trap increases the kinetic energy. From the measured heating rate of a single40Ca+ ion, we can determine the power spectral density of electric field noise, SE(ωj) at the trapping frequency ωj85
SE(ωj) = 4m̵hωj
Q2 ˙n. (7)
Assuming a homogeneous fluctuating electric field as the source of heating, we can calculate its impact on the modes of a 2-ion crystal, which is characterized by the amplitudes of each ion. From the measured average motional quantum numbers and heating rates, we calculate86 δνsec ν = − ̵h 2mAlc2∑j ωj(nj+ 1 2+ Tp 2 ⋅ ˙nj)(s ∗ j + sj) (8) with the sum over the modes j. We set s∗
j = 1 for radial modes and s∗
j = 0 for axial modes to account for the effect of intrinsic micro-motion.63The sjare scaling factors of order unity which correct for the different motional amplitudes of the two ions in a mixed-species crystal.34Since the individual njand ˙njwere not measured for all six modes of the crystal yet, we assume ˙nj= 30 for all modes, which leads to an estimate of nj+12+T2˙nj≈ 3.5 ± 0.4 when averaged over a 200 ms interrogation time without cooling, based on the results for a single40Ca+ion shown inTable I. For the same trap strength that resulted in ωrad,Ca+≈ 2π × 2.5 MHz and ωax,Ca+≈ 2π × 1.5 MHz, the six motional mode frequencies and silisted inTable IIIare obtained. Using Eq.(8), this yields δνsec
ν = (−12.0 ± 1.2) × 10
−18, given in
Table IV. However, for a full clock evaluation, the temperature of
TABLE IV. Estimated partial error budget for PTB’s transportable27Al+/40Ca+clock.
Shift Value(10−18) Uncertainty(10−18)
Black body radiation −4.0 0.4
Excess micromotion −0.4 +0.4 −0.3 second-order Doppler Secular motion −12.0 1.2 second-order Doppler Background gas 0.0 1.5 Langevin collisions
each mode after interrogation needs to be carefully measured, taking into account possible nonthermal distributions.87
Noncompensable excess micromotion as discussed in Sec.IV Dresults in a fractional second-order Doppler shift δνEMM/ν. Following Ref.63, it is given by
δνEMM ν = − 1 2c2 ∑ i=x,y,z ⟨v2 i⟩, (9)
where c is the vacuum speed of light and viare the components of the velocity vector derived from the trap drive E-field measurements
⟨v2 i⟩ = ( Q⋅ Erf,i √ 2⋅ Ωrf⋅ mAl ) 2 . (10)
By inserting Eqs. (4), (5), and (10) in Eq. (9), we obtain δνEMM ν = (−0.4+0.4
−0.3) × 10−18.
Another contribution to the error budget is the ac Stark shift due to blackbody radiation given by28,30
δνBBR ν = − π(kBTenv)4∆α(0) 60𝜖0̵h4c3 (11) = −3.8 × 10⁻¹⁸⋅ ( Tenv 300 K) 4 , (12)
where ∆α(0) = (0.82± 0.08) × 10−41J m2V−2is the calculated static differential polarizability of the27Al+clock transition,29𝜖0the vac-uum permittivity, and Tenv the temperature of the ion’s thermal environment.
About 40% of the solid angle “seen” by the ion is covered by the vacuum chamber and the viewports, which are assumed to be at room temperature of approximately 300 K. The temperature can be measured with an uncertainty of well below±1 K using standard thermistors placed on the outside of the chamber. The other 60% are covered by the trap, which is heated due to dielectric rf loss. The chosen trap drive frequency of 24.65 MHz and amplitude of 885 V yield a maximum temperature of about 5 K above its environment.88 As a conservative estimate, an averaged environmental tempera-ture of Tenv= (302.5± 2.5) K was assumed for the entire environ-ment, i.e., the vacuum chamber and the ion trap. This results in δνBBR/ν = (−4.0 ± 0.4) × 10−18, where the uncertainty is dominated by ∆α.
The last contribution treated here is the shift caused by colli-sions with background gas particles during clock interrogation. Only Langevin collisions lead to a phase shift large enough to be con-sidered in current optical clocks. The frequency shift ∆νc can be calculated by multiplying the collision rate Γc with a scaling fac-tor89 of 0.16. Since this estimate assumes a worst case phase shift of π2 for every collision event,35 it provides an upper limit to the uncertainty of the shift rather than the shift itself. The collision rate was measured by observing 21 reorderings of a27Al+/40Ca+ crys-tal during a tocrys-tal observation time of 3892.5 s. Assuming that a reordering takes place for every second collision event, a collision rate of Γc ≈ 0.0108 s−1and a fractional frequency uncertainty of 1.5× 10⁻¹⁸are obtained. The uncertainty of the collision shift could be further reduced by detecting collision events through reduced flu-orescence of the hot Ca+ ion34and discarding the corresponding data points.
First order Doppler shifts due to motion of the trap relative to the clock laser,35 perhaps as a result of thermal expansion of the apparatus, could be mitigated in the future by setting up an inter-ferometer using the mirrors on the trap wafers to phase-stabilize the clock laser to the position of the trap.
F. Ablation loading of aluminum ions
While ablation loading of Ca+ is relatively straightforward, thanks to the comparatively low neutral atom velocities and the availability of direct laser cooling right after ionization, ablated Al atoms travel much faster and have to be cooled sympathetically. Average cooling times to crystallization of around 10 min have been reported.45One way to reduce the crystallization time of a newly loaded27Al+ion is to lower its initial kinetic energy, e.g., by velocity-selective ionization of slower neutral atoms.Figure 14shows the velocity distribution of the neutral Al atoms, obtained from time-of-flight measurements45 of the Al fluorescence with a resonant ionization laser on the2S1/2−2P3/2transition at 394 nm. The ini-tial peak at 8 µs resembles the velocity distribution measured by Guggemos et al.45with a peak at 4500 ms−1. The majority of the Al atoms observed in our setup, however, come in a broad distribu-tion with a maximum at 35 µs TOF, corresponding to a much lower velocity of 490 ms−1.
For Al+loading, the 394 nm beam is shuttered with a single pass AOM synchronized to the ablation laser (ABL) pulse to select a slow velocity class of neutral atoms via time-of-flight selection in order to reduce the crystallization time. The loading sequence is depicted in
Fig. 15, starting from a Doppler-cooled and crystallized Ca+ion in the loading zone of the trap. First, the ablation laser flash lamp is trig-gered and after a delay, which can be adjusted to set the maximum instantaneous power of the pulse, a second trigger activates the Q-switch and therefore fires the ablation laser pulse (green flash sym-bol). After an additional delay starting with that pulse, the 394 nm
FIG. 14. Aluminum time of flight spectrum measured at the center of the loading zone. The counts are binned in 2µs time frames and the error bars show the statistical error per bin. The red vertical line marks the start of the photoionization pulse at 35µs and the blue line links the data points as guide to the eye.
FIG. 15. Al+loading sequence. The Ca+ion is Doppler cooled during the entire sequence. First, the ablation laser flash lamp and its Q-switch are triggered by the experiment control system. The intermediate delay sets the pulse energy. At the rising edge of the Q-switch trigger pulse, the 5 ns long ablation laser pulse is fired (green flash symbol). After a second delay, the resonant Al ionization laser is unblocked to ionize relatively slow atoms, which have a longer travel time to the trap compared to fast atoms. To increase the probability of driving the nonresonant second ionization step, the Ca ionization lasers are switched on during the entire loading sequence. The sequence concludes with a wait time for the next available pulse of the ablation laser.
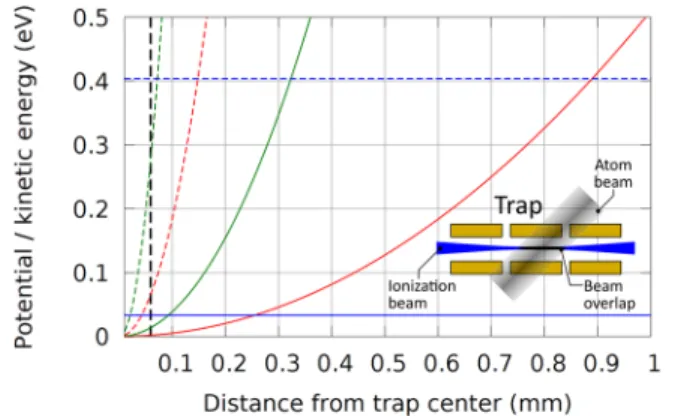
laser is switched on for velocity selective Al ionization. A 1 s long Doppler cooling pulse follows to prevent exceeding the maximum repetition rate of the ablation laser in case multiple ablation shots are going to be fired. In order to increase the probability of successfully driving the nonresonant second step of the Al photoionization, both Ca+ionization lasers are applied during the entire loading sequence. The total energy of an27Al+ ion depends on the position of ionization inside the trap as shown inFig. 16. The initial kinetic energy of a neutral atom arriving 35 µs (10 µs) after the ablation
FIG. 16. Energy of27Al+as a function of the ionization position in the trap (cal-culation). The horizontal solid (dashed) blue line indicates the kinetic energy of a neutral atom arriving 35µs (10 µs) after the ablation laser pulse. The solid (dashed) red curve shows the potential energy of27Al+as a function of displace-ment from the trap center for the standard trap potential (dashed) and for a relaxed potential used when loading (solid). The axial (green) trap frequencies areωz,Ca+ = 2π × 0.25 MHz (ωz,Ca+= 2π × 1.5 MHz) for the two potentials while the radial trap frequencies areωrad,Ca+≈2π × 0.52 MHz (ωrad,Ca+≈2π × 2 MHz). The verti-cal dashed black line indicates the waist of the ionization light beam from the LMA fiber, which restricts the volume where ionization takes place, cf. trap cross section in the inset.
laser pulse is shown by the solid (dashed) blue curve. Setting a pho-toionization delay of 35 µs reduces the maximum kinetic energy of the neutral atoms by more than an order of magnitude to 0.033 eV, while keeping more than 70% of the atoms available for ionization (cf.Fig. 14). The volume in the loading zone, where the photoioniza-tion of a neutral Al atom takes place, is defined by the spatial overlap of the axial Al ionization lasers, as depicted in the inset. Its extent defines the maximum potential energy the atom gains by ionization away from the trapping potential minimum. The main figure shows the position dependence of the potential energy for two trapping configurations. The dashed lines show the standard trap potential corresponding to ωz,Ca+= 2π× 1.5 MHz in the axial (red) direction and ωrad,Ca+≈ 2π × 2 MHz in the radial (green) direction. The solid lines show a relaxed potential for which ωz,Ca+ = 2π× 0.25 MHz and ωrad,Ca+≈ 2π × 2 MHz. The potential energy gained due to a displacement from the trap center of less than 50 µm in standard trapping configuration (dashed red and green curve) already exceeds the kinetic energy of the ablated neutral atom. But for the relaxed trap, the potential energy remains below the initial kinetic energy for the entire ionization laser beam cross section, as illustrated by the vertical dashed black line indicating the waist of this beam. There-fore, the total energy of27Al+right after ionization is dominated by the axial displacement from the trap center.
For the relaxed trap, we measure an average time of (230± 100)s between the ablation laser pulse on the Al target and the formation of an27Al+/40Ca+ crystal, where the uncertainty is given under the assumption of normally distributed loading times. This is roughly a factor of 2.5 shorter than the value reported for the same combi-nation of species by Guggemos et al.,45who worked at higher trap frequencies of ωrad,Ca+≈ 2π × 2 MHz and ωz,Ca+≈ 2π × 0.4 MHz. V. SUMMARY AND OUTLOOK
We presented PTB’s transportable 27Al+/40Ca+ optical clock setup. The system is robust, relatively compact, and simple, due to the full fiberization of the40Ca+ repumper laser system, locking all lasers required for loading and cooling of 40Ca+ to a wavelength meter, and employing a single biaspheric lens for imaging. With its NA of 0.51, submicrometer resolution is achieved by imaging a40Ca+ ion on a compact CMOS camera. Since the imaging sys-tem covers a large solid angle fraction of 7%, 10% of the collected fluorescent light suffice to reach a signal-to-noise ratio of 80 for 300 ms exposure time of the CMOS chip. The remaining photons are directed onto a PMT for state discrimination. We measure a mean state discrimination error of below 0.2% for 25 µs detection time, which drops to below 10−5for 100 µs. The ions are confined in a segmented multilayer trap, which is loaded via neutral atom abla-tion. Pulsed PI of Al using time-of-flight velocity selection enables crystallization of 27Al+ on average after 4 min. We compensated excess micromotion down to a residual rf electric field at the trap center of 17.4+8.2−4.2V m−1. Ground state cooling of a single Ca+ has been achieved by pulsed sideband cooling and heating rates of less than 10 quanta/s have been measured for all three motional modes of a single Ca+ ion. Those allow for interrogation times of a few hundred milliseconds without the necessity for simultaneous sym-pathetic cooling in a future27Al+/40Ca+quantum logic optical clock. We estimate a preliminary apparatus-related partial error budget for an27Al+/40Ca+clock operated in the setup. Taking into account the
secular motion and excess micromotion second-order Doppler shift, the blackbody radiation shift, and the shift due to Langevin collisions with background gas particles during clock interrogation, we esti-mate a systematic fractional frequency uncertainty of 1.9× 10⁻¹⁸. This is equivalent to a chronometric leveling height resolution of below 2 cm. These values are comparable to the recently published results for laboratory neutral atom Yb lattice clocks.11
Once a27Al+/40Ca+clock based on the system presented here is installed inside a climate-controlled 20-ft shipping container, it will allow for chronometric leveling at geodetically relevant sites20,90,91 such as offshore islands without direct line of sight to reference points on the mainland. Such remote frequency comparisons could in the future help to significantly refine existing geoid maps derived from satellite measurements. Moreover, a transportable clock could enable frequency comparisons among distant stationary optical clocks that are not connected via length-stabilized optical fibers, using sequential side-by-side frequency comparisons.
To reduce the total systematic fractional frequency uncertainty, data postprocessing to exclude measurements affected by detected background gas collisions could be readily employed in our system. Furthermore, by replacing the multilayer trap by one of the same design fabricated from a highly heat-conductive material such as AlN,59the uncertainty of the ions’ thermal environment, and there-fore the BBR shift, could be further suppressed. Moreover, AlN is much stiffer than the Rogers material employed here. Therefore, we expect it to bend less, resulting in a more accurate electrode geome-try and a further reduced sensitivity of the ions’ micromotion to axial positioning. The segmented trap structure offers several opportuni-ties to improve the stability of the27Al+/40Ca+clock. For instance, in a cascaded clock scheme the clock laser could be prestabilized to a large40Ca+Coulomb crystal92using dynamical decoupling to sup-press inhomogeneous systematic shifts across the crystal. This would enable longer27Al+clock ion interrogation times and thus improved statistical uncertainty.93,94Alternatively, a crystal consisting of mul-tiple, possibly entangled27Al+ and40Ca+ions, could be employed, ideally combined with a readout technique that only requires a loga-rithmic overhead in40Ca+ions73to minimize the axial extent of the crystal and therefore the EMM second-order Doppler shift as far as possible.
ACKNOWLEDGMENTS
We thank M. Dolezal and P. Balling from CMI for perform-ing the thermography measurements of rf heated trap chips and S. A. King for stimulating discussion. We acknowledge support from PTB and DFG through CRC 1227 (DQ-mat), project B03 and CRC 1128 (geo-Q), and project A03. This project has received fund-ing from the European Metrology Programme for Innovation and Research (EMPIR) co-financed by the participating states and from the European Union’s Horizon 2020 research and innovation pro-gramme, Project No. 15SIB03 OC18. We acknowledge financial sup-port by the Ministry of Science and Culture of Lower Saxony from “Niedersächsisches Vorab” through “Fundamentals of Physics and Metrology (FPM)” initiative.
APPENDIX: ADDITIONAL INFORMATION ON THE APPARATUS
Figure 17shows the setup of the vacuum vessel.
TABLE V. Biaspherical lens surface profile parameters according to ISO 10110. The front surface points toward the ion trap; seeFig. 2.
Parameter Front surface Rear surface
R (mm) 75.461 975 25.657 609
k −13.754 −0.885 86
A4(mm−3) −1.844 2× 10⁻⁶ 1.843 9× 10⁻⁶
A6(mm−5) 1.283 6× 10⁻⁹ 7.410 4× 10⁻¹⁰
A8(mm−7) 1.283 6× 10⁻⁹ 2.722 7× 10⁻¹³
FIG. 17. Image of the setup showing the vacuum vessel on the right and the imaging system on the left. The footprint of the system is 1.4 m × 0.5 m.
REFERENCES 1
J. Guena, S. Weyers, M. Abgrall, C. Grebing, V. Gerginov, P. Rosenbusch, S. Bize, B. Lipphardt, H. Denker, N. Quintin, S. M. F. Raupach, D. Nicolodi, F. Stefani, N. Chiodo, S. Koke, A. Kuhl, F. Wiotte, F. Meynadier, E. Camisard, C. Chardonnet, Y. L. Coq, M. Lours, G. Santarelli, A. Amy-Klein, R. L. Targat, O. Lopez, P. E. Pottie, and G. Grosche,Metrologia54, 348 (2017).
2
T. P. Heavner, E. A. Donley, F. Levi, G. Costanzo, T. E. Parker, J. H. Shirley, N. Ashby, S. Barlow, and S. R. Jefferts,Metrologia51, 174 (2014).
3M. Abgrall, B. Chupin, L. De Sarlo, J. Guéna, P. Laurent, Y. Le Coq, R. Le Targat, J. Lodewyck, M. Lours, P. Rosenbusch, G. D. Rovera, and S. Bize,C. R. Phys.16, 461 (2015).
4S. Weyers, V. Gerginov, M. Kazda, J. Rahm, B. Lipphardt, G. Dobrev, and K. Gibble,Metrologia55, 789 (2018).
5
A. D. Ludlow, M. M. Boyd, J. Ye, E. Peik, and P. Schmidt,Rev. Mod. Phys.87, 637 (2015).
6N. Poli, C. W. Oates, P. Gill, and G. M. Tino,Riv. Nuovo Cimento
36, 555 (2013). 7N. Huntemann, C. Sanner, B. Lipphardt, C. Tamm, and E. Peik,Phys. Rev. Lett.
116, 063001 (2016). 8
C. W. Chou, D. B. Hume, J. C. J. Koelemeij, D. J. Wineland, and T. Rosenband,
Phys. Rev. Lett.104, 070802 (2010).
9T. L. Nicholson, S. L. Campbell, R. B. Hutson, G. E. Marti, B. J. Bloom, R. L. McNally, W. Zhang, M. D. Barrett, M. S. Safronova, G. F. Strouse, W. L. Tew, and J. Ye,Nat. Commun.6, 6896 (2015).
10I. Ushijima, M. Takamoto, M. Das, T. Ohkubo, and H. Katori,Nat. Photonics9, 185 (2015).
11
W. F. McGrew, X. Zhang, R. J. Fasano, S. A. Schäffer, K. Beloy, D. Nicolodi, R. C. Brown, N. Hinkley, G. Milani, M. Schioppo, T. H. Yoon, and A. D. Ludlow,
Nature564, 87–90 (2018). 12
P. Gill,Philos. Trans. R. Soc., A369, 4109 (2011). 13
14
R. M. Godun, P. B. R. Nisbet-Jones, J. M. Jones, S. A. King, L. A. M. Johnson, H. S. Margolis, K. Szymaniec, S. N. Lea, K. Bongs, and P. Gill,Phys. Rev. Lett.113, 210801 (2014).
15
N. Huntemann, B. Lipphardt, C. Tamm, V. Gerginov, S. Weyers, and E. Peik,
Phys. Rev. Lett.113, 210802 (2014). 16
M. S. Safronova, D. Budker, D. DeMille, D. F. J. Kimball, A. Derevianko, and C. W. Clark,Rev. Mod. Phys.90, 025008 (2018).
17
A. Bjerhammar,Bull. Geod.59, 207 (1985). 18
M. Vermeer, Chronometric Levelling, Reports of the Finnish Geodetic Institute Vol. 83(2) (Geodeettinen Laitos, Geodetiska Institutet, 1983).
19
J. Müller, D. Dirkx, S. M. Kopeikin, G. Lion, I. Panet, G. Petit, and P. N. A. M. Visser,Space Sci. Rev.214, 5 (2018).
20T. E. Mehlstäubler, G. Grosche, C. Lisdat, P. O. Schmidt, and H. Denker,Rep.
Prog. Phys.81, 064401 (2018).
21C. Lisdat, G. Grosche, N. Quintin, C. Shi, S. M. F. Raupach, C. Grebing, D. Nicolodi, F. Stefani, A. Al-Masoudi, S. Dörscher, S. Häfner, J.-L. Robyr, N. Chiodo, S. Bilicki, E. Bookjans, A. Koczwara, S. Koke, A. Kuhl, F. Wiotte, F. Meynadier, E. Camisard, M. Abgrall, M. Lours, T. Legero, H. Schnatz, U. Sterr, H. Denker, C. Chardonnet, Y. Le Coq, G. Santarelli, A. Amy-Klein, R. Le Targat, J. Lodewyck, O. Lopez, and P.-E. Pottie,Nat. Commun.7, 12443 (2016). 22
S. M. F. Raupach, A. Koczwara, and G. Grosche,Phys. Rev. A92, 021801 (2015).
23
F. Riehle,Nat. Photonics11, 25 (2017). 24
W.-K. Lee, F. Stefani, A. Bercy, O. Lopez, A. Amy-Klein, and P.-E. Pottie,Appl. Phys. B123, 161 (2017).
25
J. Cao, P. Zhang, J. Shang, K. Cui, J. Yuan, S. Chao, S. Wang, H. Shu, and X. Huang,Appl. Phys. B123, 112 (2017).
26
S. B. Koller, J. Grotti, S. Vogt, A. Al-Masoudi, S. Dörscher, S. Häfner, U. Sterr, and C. Lisdat,Phys. Rev. Lett.118, 073601 (2017).
27
J. Grotti, S. Koller, S. Vogt, S. Häfner, U. Sterr, C. Lisdat, H. Denker, C. Voigt, L. Timmen, A. Rolland, F. Baynes, H. Margolis, M. Zampaolo, P. Thoumany, M. Pizzocaro, B. Rauf, F. Bregolin, A. Tampellini, P. Barbieri, M. Zucco, G. Costanzo, C. Clivati, F. Levi, and D. Calonico,Nat. Phys.14, 437 (2018). 28T. Rosenband, W. M. Itano, P. O. Schmidt, D. B. Hume, J. C. J. Koelemeij, J. C. Bergquist, and D. J. Wineland, in Proceedings of the 20th European Frequency and Time Forum (IEEE, Braunschweig, Germany, 2006), pp. 289–291.
29
M. S. Safronova, M. G. Kozlov, and C. W. Clark,Phys. Rev. Lett.107, 143006 (2011).
30M. Dolezal, P. Balling, P. B. R. Nisbet-Jones, S. A. King, J. M. Jones, H. A. Klein, P. Gill, T. Lindvall, A. E. Wallin, M. Merimaa, C. Tamm, C. Sanner, N. Huntemann, N. Scharnhorst, I. D. Leroux, P. O. Schmidt, T. Burgermeister, T. E. Mehlstäubler, and E. Peik,Metrologia52, 842 (2015).
31
T. Rosenband, P. O. Schmidt, D. B. Hume, W. M. Itano, T. M. Fortier, J. E. Stalnaker, K. Kim, S. A. Diddams, J. C. J. Koelemeij, J. C. Bergquist, and D. J. Wineland,Phys. Rev. Lett.98, 220801 (2007).
32
K. Beloy, D. R. Leibrandt, and W. M. Itano, Phys. Rev. A 95, 043405 (2017).
33P. O. Schmidt, T. Rosenband, C. Langer, W. M. Itano, J. C. Bergquist, and D. J. Wineland,Science309, 749 (2005).
34
J. B. Wübbena, S. Amairi, O. Mandel, and P. O. Schmidt,Phys. Rev. A85, 043412 (2012).
35
T. Rosenband, D. B. Hume, P. O. Schmidt, C. W. Chou, A. Brusch, L. Lorini, W. H. Oskay, R. E. Drullinger, T. M. Fortier, J. E. Stalnaker, S. A. Diddams, W. C. Swann, N. R. Newbury, W. M. Itano, D. J. Wineland, and J. C. Bergquist,
Science319, 1808 (2008).
36C. W. Chou, D. B. Hume, T. Rosenband, and D. J. Wineland,Science
329, 1630 (2010).
37
M. Guggemos, “Precision spectroscopy with trapped40Ca+and27Al+ions,” Ph.D. thesis, University of Innsbruck, Innsbruck, Austria, 2016.
38J. Zhang, K. Deng, J. Luo, and Z.-H. Lu,Chin. Phys. Lett.
34, 050601 (2017). 39K. Cui, J.-j. Shang, S.-j. Chao, S.-m. Wang, J.-b. Yuan, P. Zhang, J. Cao, H.-l. Shu, and X.-r. Huang,J. Phys. B: At., Mol. Opt. Phys.51, 045502 (2018).
40
J. B. Wübbena, “Controlling motion in quantum logic clocks,” Ph.D. thesis, Leibniz Universität Hannover, 2014.
41
N. Scharnhorst, J. Cerrillo, J. Kramer, I. D. Leroux, J. B. Wübbena, A. Retzker, and P. O. Schmidt,Phys. Rev. A98, 023424 (2018).
42
N. Herschbach, K. Pyka, J. Keller, and T. E. Mehlstäubler,Appl. Phys. B107, 891 (2012).
43
K. Pyka, N. Herschbach, J. Keller, and T. E. Mehlstäubler,Appl. Phys. B114, 231 (2014).
44
R. Hendricks, D. Grant, P. Herskind, A. Dantan, and M. Drewsen,Appl. Phys. B
88, 507 (2007). 45
M. Guggemos, D. Heinrich, O. A. Herrera-Sancho, R. Blatt, and C. F. Roos,New J. Phys.17, 103001 (2015).
46
T. Rosenband, P. O. Schmidt, Y. Kobayashi, C. Langer, W. M. Itano, S. A. Diddams, J. C. Bergquist, and D. J. Wineland,http://meetings.aps.org/link/BAPS. 2005.DAMOP.L4.7, 2005.
47
D. J. Larson, J. C. Bergquist, J. J. Bollinger, W. M. Itano, and D. J. Wineland,
Phys. Rev. Lett.57, 70 (1986). 48
M. Barrett, B. DeMarco, T. Schaetz, V. Meyer, D. Leibfried, J. Britton, J. Chiaverini, W. Itano, B. Jelenkovi´c, J. Jost, C. Langer, T. Rosenband, and D. Wineland,Phys. Rev. A68, 042302 (2003).
49
H. G. Dehmelt, Bull. Am. Phys. Soc. 18, 1521 (1973). 50
H. Häffner, C. Roos, and R. Blatt,Phys. Rep.469, 155 (2008). 51
Y. Wan, F. Gebert, J. B. Wübbena, N. Scharnhorst, S. Amairi, I. D. Leroux, B. Hemmerling, N. Lörch, K. Hammerer, and P. O. Schmidt,Nat. Commun.5, 3096 (2014).
52
J. Jin and D. A. Church,Phys. Rev. Lett.70, 3213 (1993). 53
M. Ramm, T. Pruttivarasin, M. Kokish, I. Talukdar, and H. Häffner,Phys. Rev. Lett.111, 023004 (2013).
54H. Shao, Y. Huang, H. Guan, and K. Gao,J. Phys. B: At., Mol. Opt. Phys.
51, 045002 (2018).
55
F. Gebert, Y. Wan, F. Wolf, C. N. Angstmann, J. C. Berengut, and P. O. Schmidt,
Phys. Rev. Lett.115, 053003 (2015).
56M. Chwalla, J. Benhelm, K. Kim, G. Kirchmair, T. Monz, M. Riebe, P. Schindler, A. Villar, W. Hänsel, C. Roos, R. Blatt, M. Abgrall, G. Santarelli, G. Rovera, and P. Laurent,Phys. Rev. Lett.102, 023002 (2009).
57Y. Huang, H. Guan, P. Liu, W. Bian, L. Ma, K. Liang, T. Li, and K. Gao,Phys.
Rev. Lett.116, 013001 (2016). 58
A. Kramida, Y. Ralchenko, J. Reader, and NIST ASD Team, NIST Atomic Spec-tra Database (version 5.5.6), National Institute of Standards and Technology, Gaithersburg, MD, 2018, available athttps://physics.nist.gov/asd[Wed 11 Apr 2018].
59J. Keller, “Spectroscopic characterization of ion motion for an optical clock based on Coulomb crystals,” Ph.D. thesis, Leibniz Universität Hannover, Han-nover, 2015.
60M. Schioppo, R. C. Brown, W. F. McGrew, N. Hinkley, R. J. Fasano, K. Beloy, T. H. Yoon, G. Milani, D. Nicolodi, J. A. Sherman, N. B. Phillips, C. W. Oates, and A. D. Ludlow,Nat. Photonics11, 48 (2017).
61T. Rosenband and D. R. Leibrandt, e-printarXiv:1303.6357(2013). 62J. Borregaard and A. S. Sørensen,Phys. Rev. Lett.
111, 090802 (2013). 63D. J. Berkeland, J. D. Miller, J. C. Bergquist, W. M. Itano, and D. J. Wineland,
J. Appl. Phys.83, 5025 (1998). 64
W. W. Macalpine and R. O. Schildknecht,Proc. IRE47, 2099 (1959). 65
J. D. Siverns, L. R. Simkins, S. Weidt, and W. K. Hensinger,Appl. Phys. B107, 921 (2012).
66N. Beev, J.-A. Fenske, S. Hannig, and P. O. Schmidt,Rev. Sci. Instrum.
88, 054704 (2017).
67
J. Keller, H. L. Partner, T. Burgermeister, and T. E. Mehlstäubler,J. Appl. Phys.
118, 104501 (2015).
68R. W. Dreyfus, R. Kelly, and R. E. Walkup, Appl. Phys. Lett.
49, 1478 (1986).
69
M. Towrie, S. Drysdale, R. Jennings, A. Land, K. Ledingham, P. McCombes, R. Singhal, M. Smyth, and C. McLean,Int. J. Mass Spectrom. Ion Processes96, 309 (1990).
70
K. Zimmermann, M. Okhapkin, O. Herrera-Sancho, and E. Peik,Appl. Phys. B: Lasers Opt.107, 883 (2012).