HAL Id: hal-02667095
https://hal.inrae.fr/hal-02667095
Submitted on 15 Sep 2020
HAL is a multi-disciplinary open access
archive for the deposit and dissemination of
sci-entific research documents, whether they are
pub-lished or not. The documents may come from
teaching and research institutions in France or
abroad, or from public or private research centers.
L’archive ouverte pluridisciplinaire HAL, est
destinée au dépôt et à la diffusion de documents
scientifiques de niveau recherche, publiés ou non,
émanant des établissements d’enseignement et de
recherche français ou étrangers, des laboratoires
publics ou privés.
Distributed under a Creative Commons Attribution - NonCommercial| 4.0 International
License
Reconstructing the routes of invasion: what for, how
and so what
Arnaud Estoup, Thomas Guillemaud
To cite this version:
Arnaud Estoup, Thomas Guillemaud. Reconstructing the routes of invasion: what for, how and so
what. Molecular Ecology, Wiley, 2010, 19 (19), pp.4113-4130. �10.1111/j.1365-294X.2010.04773.x�.
�hal-02667095�
Reconstructing
routes of invasion using genetic data:
why,
how and so what?
A R N A U D ESTOUP* and THOMAS GUILLEMAUD†
*INRA UMR Centre de Biologie et de Gestion des Populations (INRA ⁄ IRD ⁄ Cirad ⁄ Montpellier SupAgro), Campus international de Baillarguet, Montferrier-sur-Lez 34988, France, †Equipe ‘Biologie des Populations en Interaction’, UMR 1301 IBSV INRA-CNRS-Universite´ de Nice-Sophia Antipolis 400 route des Chappes, 06903 Sophia-Antipolis Cedex, France
Abstract
Detailed knowledge about the geographical pathways followed by propagules from their source to the invading populations—referred to here as routes of invasion—provides information about the history of the invasion process and the origin and genetic composition of the invading populations. The reconstruction of invasion routes is required for defining and testing different hypotheses concerning the environmental and evolutionary factors responsible for biological invasions. In practical terms, it facilitates the design of strategies for controlling or preventing invasions. Most of our knowledge about the introduction routes of invasive species is derived from historical and observational data, which are often sparse, incomplete and, sometimes, misleading. In
this context, population genetics has proved a useful approach for reconstructing routes
of introduction, highlighting the complexity and the often counterintuitive nature of the
true story. This approach has proved particularly useful since the recent development of
new model-based methods, such as approximate Bayesian computation, making it possible to make quantitative inferences in the complex evolutionary scenarios typically encountered in invasive species. In this review, we summarize some of the fundamental aspects of routes of invasion, explain why the reconstruction of these routes is useful for addressing both practical and theoretical questions, and comment on the various reconstruction methods available. Finally, we consider the main insights obtained to date from studies of invasion routes.
Keywords: introduction, invasive species, molecular markers, outbreak, rapid evolution, statisti-cal inferences
Introduction
Biological invasions are a major component of global change, with potentially huge detrimental effects on public health, agriculture and biodiversity (Sax et al. 2005). This has stimulated considerable interest among biologists in determining why some species become successful invaders (Cadotte et al. 2006; Sax et al. 2005). Paradoxically, there is still some debate about the defi-nition of an ‘invasive’ species (Colautti & MacIsaac 2004; Valery et al. 2008), and current conceptual frame-works for biological invasions differ in the relative
importance given to three major components: ‘range extension’ (Facon et al. 2006), ‘high local abundance’ (Suarez et al. 1999) and ‘disruption of ecosystem func-tion’ (Mooney & Hobbs 2000). Here, we consider an invasive population to be a set of individuals that has been introduced into a new area, in which these indi-viduals have established themselves, increased in num-ber and spread geographically. The use of other definitions of biological invasion has no significant effect on most of the ideas developed in this study.
The reasons why some introductions lead to inva-sions whereas others do not result in the establishment or expansion of the invading population are currently being addressed by many researchers. A number of studies focus on determining the likelihood of a species
Correspondence: Arnaud Estoup, Fax: +33 0 4 99 62 33 45; E mail: [email protected]
and genetic composition of source populations, the number of introductions from each source, the number of individuals introduced during each introduction epi-sode, the number of intermediate populations between the initial introduction and the spread of the invasive population and the dynamics of the geographical and demographic expansion following each introduction. Information about the history of the invasion process, including, in particular, a description of the geographi-cal pathways of the propagules between the source and invading populations referred to here as routes of invasion thus provides useful information about the origin and genetic composition of the invading popula-tions (Dlugosch & Parker 2008). As we will see below, it is important to retrace the routes of invasion, to gen-erate and test hypotheses concerning the environmental and evolutionary factors responsible for biological inva-sions.
In this review, we will (i) summarize fundamental aspects of the routes of invasion, (ii) explain why recon-structing routes of invasion is a useful approach for addressing both practical and theoretical questions, (iii) comment on the various methods available for recon-structing invasion routes, and (iv) consider the main insights obtained to date through studies of invasion routes.
The fundamental aspects of invasion routes Biological invasions vs. natural range expansions
The scientific literature is full of examples of natural range expansion over large distances with the coloniza-tion of remote geographical areas and new habitats (Wilson et al. 2009). Such natural range expansions are sometimes associated with extinction, speciation and the building of new ecosystems. For instance, oak has colonized Europe since the end of the last ice age, with a new species arising from hybridization between the pedunculate oak (Quercus robur L.) and sessile oak [Q. petraea (Matt.) Liebl.] (Petit et al. 2004). It has been argued that biological invasions simply represent an increase in natural dispersal events of a species outside its natural range (Vermeij 2005). However, invasions often involve complex routes, including multiple source populations and multiple introduction sites. Moreover, biological invasion occurs much more rapidly than the major colonizations and recolonizations of areas during evolution (e.g. after glaciations Valery et al. 2008; Wil-son et al. 2009). One major consequence of these two features is that invasions are often associated with the introduction of considerable genetic variability over a short period of time (Dlugosch & Parker 2008; Roman & Darling 2007; Wares et al. 2005). This high level of being invasive based on the presence or absence of
par-ticular phenotypic characters, such as wide dispersal, high growth rate, generalist vs. specialist trophic rela-tionships, asexual reproduction, tolerance to environ-mental heterogeneity, high levels of competitiveness (e.g. Kimberling 2004; Kolar & Lodge 2002; Sakai et al. 2001; Vall-Ilosera & Sol 2009). The species identity of a population may therefore be seen as an important factor determining the success or failure of invasions. How-ever, invasiveness may vary among species with similar ‘invasive characteristics’ as well as within species (Kolar & Lodge 2001). A few intraspecific studies have shown that invasiveness outcome may differ considerably between introduced populations from the same species (e.g. Ciosi et al. 2008; Kang et al. 2007; Kelly et al. 2006). Clearly, comparing species does not allow the evaluation of the effects of intraspecific polymorphism on the outcome of an introduction. Moreover, it is diffi-cult to study the sensitivity of invasion success to sto-chastic events or environmental variation in interspecific comparisons.
The new ecological conditions encountered by intro-duced individuals may differ considerably from the ori-ginal conditions; therefore natural selection and adaptation may be key determinants of the success of invasion at the population level before or during the settlement phase (reviewed in Reznick & Ghalambor 2001; Voisin et al. 2005; Facon et al. 2006; Schierenbeck & A¨ınouche 2006). Several factors determine the capac-ity of invasive populations to respond to selection, and genetic variability plays an important role (Drake & Lodge 2006; Facon et al. 2006; Lockwood et al. 2005; Memmott et al. 2005). Substantial genetic variability (or at least a high level of additive genetic variation) is expected to favour adaptation in remote territories and, thus, the settlement and spread of the introduced prop-agules (Facon et al. 2006, 2008; Kolbe et al. 2004; Laver-gne & Molofsky 2007; Lee 2002; Roman & Darling 2007). However, there are many examples of successful invaders with very low levels of genetic variability, at least at selectively neutral loci (reviewed in Novak & Mack 2005; Wares et al. 2005). Good alleles of specific genes or good combinations of genotypes for those genes may nonetheless facilitate successful introduction (Facon et al. 2006).
One critical piece of the puzzle in the understanding of biological invasions is an understanding of the his-tory of the invasion process, including the geographical pathways followed by the founders of the invading populations. Indeed, the genetic variability of invading populations, in terms of both molecular and quantita-tive traits, depends on the history of their populations of origin and the historical and demographical features of their introduction. Such features include the number
initial genetic variation may increase the likelihood of encountering adaptive genetic variants and the response to natural selection of the offspring of the founders (Fa-con et al. 2006, 2008; Lavergne & Molofsky 2007; Roman & Darling 2007). This characteristic may be decisive if the conditions in the new environment are significantly different from those of the native area. We already have a full section devoted to this question in our ms.
With regard to the methods that can be used to make inferences about the routes of invasions vs. the routes of natural range expansions, we do not see any obvious reasons to consider that different methods should be used in either case. Therefore, many of the advantages and disadvantages of the methods detailed below for the routes of invasions (see Methods for reconstructing routes of invasion) should also hold for the routes of natural range expansions. However, the fact that the major colonizations of areas during evolution are older than biological invasion tends to suggest that DNA sequence data might be more informative to make infer-ences about the routes of natural range expansions than of invasions. On the other hand, nongenealogical-based methods such as STRUCTURE (Pritchard et al. 2000), BAPS (Corander et al. 2003) or GENELAND (Guillot et al. 2005) should be of lower interest to make infer-ences about the routes of natural range expansions than of invasions.
Role of humans in shaping invasion routes
It is now widely recognized that biological invasions are often because of fortuitous or intentional dispersal events linked to human activities (Lockwood et al. 2005). Human activities provide vectors for dispersion (air traffic, train networks, marine ballasts, canals, etc.), thereby promoting introductions into new remote areas and accelerating the spatial expansion of species after their introduction into new areas (i.e. stratified dis-persal; Shigesada et al. 1995). However, it would be extremely restrictive to limit the influence of humans exclusively to ‘extra-range species dispersal’. A second crucial, but indirect, role of human activities relates to the worldwide homogenization of the environment, through urbanization and agriculture in particular (Sax & Brown 2000; Tilman et al. 2001). For example, maize crops provide a relatively uniform habitat throughout the world, from Africa to Asia, and North and South America to Europe (Anonymous, 1993). This homogeni-zation of the environment considerably decreases the magnitude of the evolutionary response required to adapt to the conditions found in new, geographically distant territories. This situation increases the likelihood of successful invasion by species living in maize crops, even if there is a very large distance between the native
area and the area of introduction. In conclusion, humans not only provide efficient means of transport over increasingly large geographical distances, but also favour biological invasions by decreasing ecological dif-ferences between geographically remote areas.
The reconstruction of invasion routes is a useful approach for addressing both practical and theoretical questions
From a practical point of view, the reconstruction of invasion routes facilitates the design of strategies for preventing invasion. In cases of recurrent introductions, strategies based on the prevention of introduction may be more cost-effective than eradication or containment (Mack et al. 2000). If the geographical origin and the vector responsible for the recurrent introduction of an invader can be identified, then specific monitoring and quarantine measures targeting the source area and the means of dispersal can be designed. However, if an introduction has already occurred, eradication or con-tainment may be the best solution if the introduction is a single event and the area invaded is not too large (Hulme 2006). In this context, the inference of invasion routes may also facilitate the design of measures for controlling invasive populations, because the efficacy of such measures depends on the genetic diversity and geographical origin of the genotypes introduced. For example, in the case of classical biological control against an invasive pest, in which a predator or a para-site is deliberately introduced into a new area with a view to its becoming stably established, it may be better to choose strains of the auxiliary agent with the same geographical origin as the invasive population. This is because local adaptation may lead to auxiliary agents being more efficient against target species from popula-tions with which they coevolved within their native range (see Kang et al. 2007 for a complication of this simple case; Roderick & Navajas 2003). Methods devel-oped to describe the introduction routes of invasive populations, and hence their origin within their native range, should therefore facilitate the design of effective control or prevention strategies.
From an academic point of view, the reconstruction of invasion routes is crucial for defining and testing dif-ferent hypotheses concerning the environmental and evolutionary factors underlying biological invasions (e.g. Hufbauer & Sforza 2008). It is difficult to demon-strate that a specific adaptation is responsible for an invasion (see for example Keller & Taylor 2008). Many examples of evolution in the context of invasions have been described (Bossdorf et al. 2005). However, as noted by Keller & Taylor (2008), changes in the dis-tribution of phenotypic and life history traits during
occurred in less than 20 years. Similarly, Lee et al. (2003, 2007) have documented rapid changes in the reaction norm to salinity in the invasive copepod Eur-ytemora affinis, introduced into low-salinity environ-ments from high-salinity environenviron-ments. Other examples can be found in Keller & Taylor (2008).
Tests of the hypothesis of non-neutral and nonrandom evolution because of an adaptive change in an invasive population i.e. separating the role of stochastic and demographic events from that of selection in shaping the
evolution of the phenotype require comparisons
between the introduced and source populations. The use of comparative approaches of this type requires selection of the most appropriate entities to be compared (the comparable entities). In this context, the description of invasion routes, providing information about the history of the invasion process and, specifically, about the sources of the introduced propagules, is crucial.
Methods for reconstructing routes of invasion
Two types of methods have traditionally been used to make inferences concerning routes of introduction: direct methods based on current and historical observa-tions of invasive species and indirect methods based on patterns in population genetics data. Recently, a new
model-based Bayesian method called approximate
Bayesian computation (ABC, Beaumont et al. 2002) has been proposed and used to draw inferences about the complex evolutionary scenarios typically encountered in the introduction histories of invasive species. This method is based, at least partly, on population genetics data and may therefore be considered an indirect method. This approach constitutes a particularly impor-tant development in the field and will therefore be dealt with in a separate section.
Direct methods
Direct methods are based on records of the presence and absence of invasive taxa (e.g. the study of Argentine ant by Suarez et al. 2001). Routine controls carried out in air-ports and harbours by quarantine services and monitor-ing by environmental or agricultural agencies are particularly informative in this respect (Work et al. 2005). These records can be useful for retracing invasion routes, particularly when combined with ecological and bioclimatic data. For instance, Tatem et al. (2006) used a database of international ship and aircraft traffic move-ments, together with climatic information, to retrace the expansion of the range of the Aedes albopictus mosquito. However, it is rarely possible to infer the routes of inva-sion with a high degree of preciinva-sion by these direct methods. Harbour and airport records provide informa-dispersal, establishment and range expansion may
reflect neutral phenotypic changes rather than adaptive evolution. Random sampling of the genetic diversity of the source population, the sudden and dramatic decrease in population size during the introduction phase, and the low density of the introduced popula-tion during the establishment phase may result in changes in the phenotype of the introduced population, resulting in differences between the introduced and source populations that are not because of selection.
Keller & Taylor (2008) noted that in cases in which the putative source populations differ in their pheno-type distributions, the incorrect assignment of the intro-duced population to one of the putative sources may be erroneously interpreted as phenotypic evolution. They proposed to estimate phenotypic divergence between ancestral lineages in the native range and their descen-dants in the introduced range directly. This approach is based on a rationale of measuring phenotypic differ-ences between comparable entities, i.e. between demes or populations derived from each other through intro-duction events. This approach thus requires a precise knowledge of the historical source introduction rela-tionships of the populations studied and reconstructing introduction routes may be helpful in this respect. If the same type of phenotypic evolution is demonstrated in several independent introductions, then it is a strong indication that phenotypic evolution may be adaptive.
Another solution involves carrying out QST FST
analy-sis (McKay & Latta 2002). FST is a measurement of
inter-population genetic variation based on the molecu-lar variation observed at neutral or nearly neutral loci. It is supposed to estimate inter-population divergence because of stochastic and demographic events only. QST
is a measurement of inter-population genetic variation due not only to stochastic and demographic events, but also to selection. It is measured for quantitative traits, such as body size and fecundity. A significant differ-ence between the estimates of QST and FST for a given
set of populations provides evidence for a response of the quantitative trait concerned to selection (significant differences are, however, often difficult to observed because of the usually large variance of FST and QST;
Keller & Taylor 2008). As discussed earlier, this quanti-tative genetics-based approach requires thorough knowledge of the source populations of the invasive populations studied. Using such approaches, it is possi-ble to reject the hypothesis of neutrality in some cases, and to demonstrate rapid adaptation to new environ-mental conditions after introduction. For instance, pop-ulations of Drosophila subobscura introduced into America from Europe display the hallmarks of morpho-logical (Huey et al. 2000) and chromosomal (Prevosti et al. 1988) adaptations to climatic conditions that have
tion about the immediate geographical origin of the introduced individuals detected, but can provide no information about subsequent steps in the invasion process. Indeed, given the low rates of establishment and expansion recorded for introduced individuals (Williamson 2006), there is no guarantee that the indi-viduals intercepted would have spearheaded a successful invasion.
Indirect methods
Indirect methods are based on the genetic patterns observed within and between populations at molecular markers (e.g. Ciosi et al. 2008; Darling et al. 2008; Davies et al. 1999; Facon et al. 2003; Fonseca et al. 2000; Kolbe et al. 2004; Lindholm et al. 2005; Thibault et al. 2009; Hoos et al. 2010). One indirect method that is still widely used is based on the construction of dendro-grams (e.g. neighbour-joining trees) from matrices of genetic distances between populations (e.g. Lozier et al. 2009; Thibault et al. 2009). The main features of this approach are described in Box 1. Other methods are based on calculations of assignment likelihood (Ciosi et al. 2008; Genton et al. 2005; Paetkau et al. 2004; Pasc-ual et al. 2007; Rannala & Mountain 1997; Tepolt et al. 2009; Thibault et al. 2009) or parsimony networks (e.g. Voisin et al. 2005; Hoos et al. 2010). More recently, a number of studies trying to retrace the introduction sce-narios of invasive populations (mostly to determine their source) have used clustering methods like those implemented in STRUCTURE (Pritchard et al. 2000), BAPS (Corander et al. 2003) or GENELAND (Guillot et al. 2005). If the invasive population clusters clearly with one of the potential source populations, this is con-sidered to provide fairly conclusive information about the origin of the invasive population (e.g. Darling et al. 2008; Eldridge et al. 2001; Marrs et al. 2008; Rosenthal et al. 2008; Rollins et al. 2009). A shared ancestry of the individuals of invading populations with various popu-lations from the native area is sometimes interpreted as evidence for an admixture origin of the invasive popu-lation considered (Darling et al. 2008; Rosenthal et al. 2008). However, if the invasive population does not cluster clearly with any of the potential source popula-tions and ⁄ or if the calculated coancestry coefficients indicate shared ancestry with several populations, then it is difficult to infer the invasion route from the pattern obtained. This may be because of the existence of multi-ple sources or unsammulti-pled sources, drift during and after introduction, or insufficient numbers of markers (e.g. Darling et al. 2008). Claims of admixture between source populations on the basis of coancestry coeffi-cients may therefore be overstated in at least some cases.
Box 1: Inferring routes of invasion by
traditional indirect methods based on genetic distances and trees
Invasion routes are frequently inferred from tree topologies reconstructed from a matrix of genetic distances between pairs of populations (e.g. Gold-stein et al. 1999). Here, we summarize the main fea-tures of these inference methods based on tree topologies, highlighting their principal drawbacks. The main advantage of these methods is that they are straightforward and rapid to carry out with a number of user-friendly programs. Various types of genetic markers, genetic distances and tree recon-struction algorithms can be used. Below, we will focus on the most commonly used types of genetic markers, distances and tree algorithms in the context of invasion biology: microsatellite loci, the genetic distances proposed by Cavalli-Sforza & Edwards (1967) and Nei et al. (1983) and the neighbour-join-ing algorithm for tree construction (NJ, Saitou & Nei 1987) (see Takezaki & Nei 1996) for a comparative study of genetic distances on tree topologies). Most of the features and drawbacks described below are general and also apply to other genetic markers, dis-tances and tree algorithms.
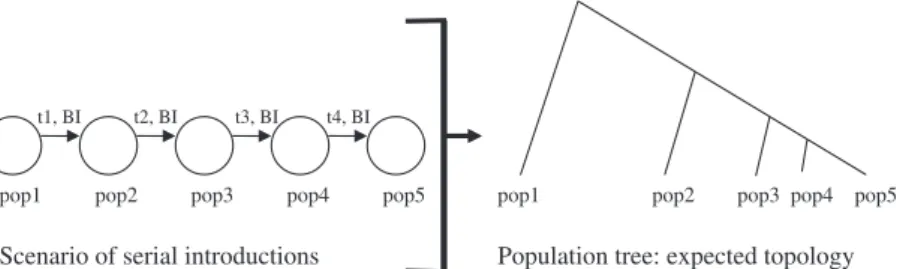
Small divergence times and bottleneck events. In invasion biology, evolutionary scenarios are often characterized by small divergence times between populations and by bottleneck events of various intensities after introduction. The effect of small divergence times on the likelihood of identifying the true topology is illustrated with microsatellite data simulated under a serial introduction scenario (Fig. 1 and Table 1). Short divergence times result in low levels of differentiation by drift and mutation, and these low levels of differentiation make it diffi-cult to reconstruct the ‘true’ tree topology. In our simulation study, we found that about 40% of the topologies with short divergence times were recon-structed incorrectly, leading to the inference of false introduction routes (Table 1). The proportion of cor-rectly inferred true topologies increases considerably, however, if bottleneck events occur after introduc-tions (Table 2). This is because bottleneck events generate drift pulses in each of the introduced popu-lations, which become genetically differentiated from each other whilst retaining their source introduction relationships. This makes it easier to reconstruct the true tree topology, provided that enough genetic polymorphism remains after the bottleneck events.
Independent introductions from the same source population. In the invasion scenario shown in Fig. 1,
t1, BI t2, BI t3, BI t4, BI
pop1 pop2 pop3 pop4 pop5 pop1 pop2 pop3 pop4 pop5
Population tree: expected topology Scenario of serial introductions
Fig. 1Computer simulation of microsatellite data under a scenario of serial introductions and expected tree topology. t1, t2, t3 and t4: introduction times in number of generations since present. All five populations have the same effective population size (Ns = 500 diploid individuals). Each introduction involves the same number of effective founding individuals (Nf = 5, 50 or 500 diploid indi viduals) for five generations after introduction. Each introduction is characterized by the same bottleneck intensity index, BI = log10(Ns ⁄ Nf). Three categories of divergence times are considered: short (t1 = 40, t2 = 20, t3 = 10, t4 = 5), medium (t1 = 200,
t2 = 100, t3 = 50, t4 = 25) and long (t1 = 1000, t2 = 500, t3 = 250, t4 = 125). For each category of divergence time, three bottleneck intensities are considered: null (BI = 0), medium (BI = 1) and strong (BI = 2). Each simulated microsatellite data set includes 30 indi viduals genotyped at 10 independent loci evolving with a mutation rate of 5 · 10)4under a generalized stepwise mutation model with the parameter of the geometric distribution of the length in number of repeats of mutation events equal to 0.20 (Estoup et al. 2002). Simulations were based on coalescence theory (Kingman 1982), and we simulated 10 000 data sets for each set of conditions. For each simulated data set, we constructed a population tree with pop 1 as root, using a matrix of genetic distances of Nei et al. (1983) or Cavalli Sforza & Edwards (1967), and the neighbour joining algorithm (NJ, Saitou & Nei 1987). The topology of each tree was compared with the expected topology (i.e. the true topology) and the number of topologies without error was recorded. All sim ulations and tree reconstructions were processed with custom written programs (available on request).
Table 1Effect of divergence time on the proportion of cor rectly inferred topologies. The introduction scenario, true topology and simulated data sets are described in Fig. 1. All introductions are characterized by an absence of bottleneck (bottleneck intensity, BI = 0)
Genetic distance
Divergence time
Long Medium Short
Nei et al. (1983) 90.55 83.11 54.99
Cavalli Sforza & Edwards (1967) 93.76 91.43 59.32
Table 2Effect of bottleneck intensity during introductions on the proportion of correctly inferred topologies. The introduc tion scenario, true topology and simulated data sets are described in Fig. 1. Only the scenarios with short divergence times (t1 = 40, t2 = 20, t3 = 10, t4 = 5) were considered
Genetic distance
Bottleneck intensity Null Medium Strong
Nei et al. (1983) 54.99 99.09 99.80
Cavalli Sforza & Edwards (1967) 59.32 98.70 99.83
each introduced population originates from a differ-ent source population. In many cases, several popu-lations have the same source population. For recent introductions, the genetic distances between source and introduced populations are due purely to genetic bottlenecks occurring during and soon after introductions. Therefore, two populations indepen-dently introduced from the same source would not be expected to be genetically more closely related to each other than to the source and they should not necessarily cluster together in a NJ tree. As the source population is assumed to be the root of the tree, the grouping of the introduced populations together is a constraint. As a consequence, low boot-strap values are expected for the nodes connecting the introduced populations. But how low? There is no rigorous statistical framework allowing the defini-tion of threshold bootstrap values below which it is safe to conclude that the populations originate from
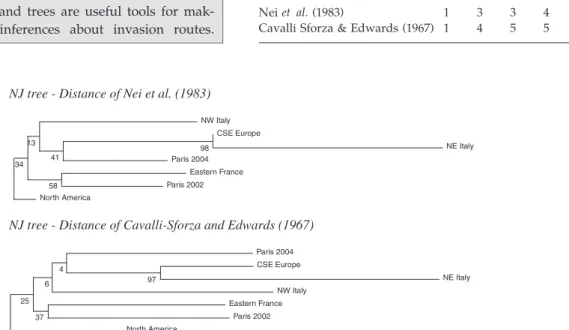
the same source. The expected bootstrap values depend on the number of populations analysed and sample sizes (numbers of genotyped loci and indi-viduals) and, probably, on the intensity of the bottle-neck events. This is illustrated by the NJ trees obtained for European outbreaks of the invasive bee-tle Diabotica virgifera virgifera (Fig. 2), for which an analysis of the same samples by approximate
Bayes-ian computation (ABC, Beaumont et al. 2002)
suggests four independent introductions into Europe from North America (Miller et al. 2005; Box 2). Table 3 shows that the number of independent
European introductions from North America
deduced from tree topologies and bootstrap values largely depends on the threshold bootstrap values below which a trifurcation is inferred.
Direction of introductions. When considering two terminal branches connecting two populations (e.g. CSE Europe NE Italy or Eastern France Paris
NJ tree - Distance of Nei et al. (1983) 34 13 NW Italy 41 98 CSE Europe NE Italy Paris 2004 58 Eastern France Paris 2002 North America
NJ tree - Distance of Cavalli-Sforza and Edwards (1967)
25 6 4 Paris 2004 97 CSE Europe NE Italy NW Italy 37 Eastern France Paris 2002 North America
Fig. 2The introduction of Diabrotica virgifera into Europe. The native population is called ‘North America’. The other six populations are populations invading Europe. NW Italy = Northwest Italy; NE Italy = northeast Italy; CSE Europe = Central Southern East Europe (invaded area centred on Serbia). Microsatellite data (eight loci) are those published by Miller et al. (2005). Bootstrap values (with the locus as a unit) were calculated over 5000 iterations. (a) NJ tree Distance of Nei et al. (1983); (b) NJ tree Distance of Cavalli Sforza & Edwards (1967).
Table 3Effect of the choice of threshold bootstrap value on the number of deduced independent introductions of Diabrotica virgifera into Europe from North America, as inferred from the tree in Fig. 2. Microsatellite data (eight loci) are those pub lished by Miller et al. The number of independent introduc tions inferred from ABC analysis is four (Miller et al. 2005)
Genetic distance
Threshold bootstrap values 20% 30% 40% 50% 60%
Nei et al. (1983) 1 3 3 4 5
Cavalli Sforza & Edwards (1967) 1 4 5 5 5
2004; Fig. 2), it is not possible to know which popu-lation is the source of the other. Only the consider-ation of historical data, such as dates of first observation, can resolve this problem. However, these dates are often uncertain and may therefore lead to incorrect conclusions, particularly when they are very close together, as in the case of D. virgifera virgifera (e.g. 2002 for Paris-2002 and 2003 for eastern France). As bottleneck events increase genetic dis-tances, they would be expected to increase the length of the branch corresponding to the introduced popu-lation. However, branch lengths have a large vari-ance and depend on many factors, including bottleneck intensity and genetic distance. In Fig. 2, the branch lengths of the Paris 2002 Eastern France population pair suggest that Paris 2002 is the source population if the distance of Nei et al. (1983) is used and that eastern France is the source population if the distance of Cavalli-Sforza & Edwards (1967) is used.
Ghost populations. When genetic relationships between populations are summarized by a tree, no inference can be made about the putative existence of a nonsampled introduced population (a so-called ghost population) acting as the source of one or sev-eral introduced populations (see Guillemaud et al. 2010 for details). This issue is particularly problem-atic when the nonsampled population plays the role of an invasion bridgehead (see main text and Box 2). Conclusion. Traditional indirect methods based on genetic distances and trees are useful tools for mak-ing preliminary inferences about invasion routes.
Their main advantage is that they are simple and rapid to carry out with a number of user-friendly programs. In addition to the limitations of such methods described earlier, the two most important issues associated with these techniques are that they reduce genetic data to a single summary statistic of genetic variation between populations and they do not adequately take into account the stochasticity of the demographic and genetic history considered. This drawback results from the lack of reliance of these methods on explicit demographic and molecu-lar stochastic models. Approximate Bayesian compu-tation (ABC, Beaumont et al. 2002) uses several to many summary statistics to describe most of the molecular information and is based on explicit demographic and molecular stochastic models. ABC thus represents a promising alternative methodology for the inference of invasion scenarios (see Box 2).
Box 2: Inferring routes of invasion by approximate Bayesian computation
In this box, we will not detail the general statistical features of approximate Bayesian computation (ABC; Beaumont et al. 2002). General statistical features of ABC have been reviewed in two recent studies (Ber-torelle et al. 2010; Csille´ry et al. 2010). We will rather focus on some practical aspects of ABC that are important when using this method to make infer-ences about invasion routes. Briefly, ABC is a Bayes-ian approach in which the posterior probabilities of different models and ⁄ or the posterior distributions of the demographic parameters under a given model are determined by measuring the similarity between the observed data set (i.e. the target) and a large number of simulated data sets; all data sets are sum-marized by statistics such as the mean number of alleles or heterozygosity per population and FST or
genetic distances between pairs of populations. The ABC method was recently successfully used to make inferences from large data sets for complex models in population and evolutionary biology (e.g. Estoup et al. 2004; Fagundes et al. 2007; Jakobsson et al. 2006; Neuenschwander et al. 2008; Patin et al. 2009; Rosenblum et al. 2007; Toni et al. 2009; Verdu et al. 2009), infectious disease epidemiology (e.g. Luciania et al. 2009) and systems biology (e.g. Ratmann et al. 2009). It has already been successfully used to infer the invasion routes of a number of species (Lombaert et al. 2010; Miller et al. 2005; Pascual et al. 2007).The method is indeed well adapted to the complex his-torical and demographical models associated to bio-logical invasions, in which bottlenecks, serial or independent introductions and ⁄ or genetic admixture events are often suspected. Under an ABC frame-work, such events can be modelled explicitly hence defining different models (often called scenarios) that can be formally tested against each another (see Fig. 3 for an illustration of competing scenarios tra-ditionally considered in the study of invasion routes).
In practice, ABC users can base their analysis on simulation programs, such as SIMCOAL (Laval & Excoffier 2004), ms (Hudson 2002), Serial SimCoal (Anderson et al. 2005) or MaCS (Chen et al. 2009) and then use statistical software to postprocess their simulation outputs. Several ABC programs have recently been developed to provide nonspecialist users with solutions varying in the extent to which they are user-friendly (Cornuet et al. 2008; Foll et al. 2008; Hickerson & Meyer 2008; Jobin & Mountain 2008; Tallmon et al. 2008; Lopes et al. 2009;
Weg-mann et al. 2009). These programs can be used for data simulation and some postprocessing steps. To our knowledge, three of these ABC programs, po-pABC (Lopes et al. 2009), DIYABC (Cornuet et al. 2008) and ABCtoolbox (Wegmann et al. 2010), pro-vide particularly useful operational solutions for treating the complex introduction scenarios typical of biological invasions. PopABC (Lopes et al. 2009) combines an isolation with migration model with mi-crosatellite (under an SMM mutation model) or sequence data (under ISM) and recombination. It can be used to analyse several populations that have diverged with or without migration, making it possi-ble to infer invasion routes. PopABC involves an ele-ment of pipelining at the end of data processing, making this software most suitable for users with some experience in computing (Lopes et al. 2009). Cornuet et al. (2008) developed DIYABC to provide a user-friendly interface, making it possible for biolo-gists with little background in programming to per-form inferences by ABC. DIYABC can consider complex population histories, including any number of divergence (without migration), admixture and population size variation events, for population sam-ples that may have been collected at different times. The package initially assumes a GSM or SMM muta-tion model for microsatellites (Estoup et al. 2002). Recent developments of DIYABC include (i) infer-ence from DNA sequinfer-ence data in addition to or sep-arately from microsatellite data, (ii) the possibility of analysing five categories of loci, taking into account balanced or unbalanced sex ratios: autosomal dip-loid, autosomal hapdip-loid, X-linked, Y-linked and mitochondrial, and (iii) the possibility to proceed model checking computation to assess the ‘goodness-of-fit’ of a model, a much-neglected facet of ABC analysis (Cornuet et al. 2010; DIYABC V1.0 available
at http://www1.montpellier.inra.fr/CBGP/diyabc).
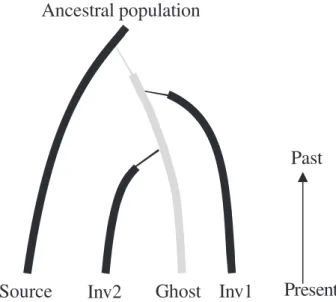
An example of a set of introduction scenarios that can be analysed with DIYABC is given in Fig. 3. DI-YABC is able to handle two types of scenario that may be frequent in invasion biology. First, it allows scenarios including intra-specific hybridization (or admixture) events to be considered, and such events are frequently reported in successful invasions (Fa-con et al. 2005; Gaskin & Schaal 2002; Gaskin et al. 2009; Rhymer & Simberloff 1996). Second, it also allows the modelling of ghost populations (Guille-maud et al. 2010; Miller et al. 2005), i.e. populations contributing to the invasion scenario but that are not sampled and thus not analysed (Fig. 4). The very recent computer package ABCtoolbox (Wegmann et al. 2009) includes a series of open source
pro-N1 N2 N3 NF2 NF1 1-ra ra 1-ra ra Pop 2 (Sa 2) Pop 3 (Sa 3) Pop 1 (Sa 1) Pop 1 (Sa 1) Pop 1 (Sa 1) Pop 1 (Sa 1) Pop 1 (Sa 1) Pop 2 (Sa 2) Pop 2 (Sa 2) Pop 2 (Sa 2) Pop 2 (Sa 2) Pop 3 (Sa 3) Pop 3 (Sa 3) Pop 3 (Sa 3) Pop 3 (Sa 3) Scenario 1 Scenario 2 Scenario 3 Scenario 4 Scenario 5 t1 t1-DB1 t2 30 0 t2-DB2 t1 t1-DB1 t2 30 0 t2-DB2 t1 t1-DB1 t2 30 0 t2-DB2 t1 t1-DB1 t2 30 0 t2-DB2 t1 t1-DB1 t2 30 0 t2-DB2
Fig. 3Graphical representation of five invasion scenarios that can be considered with approximate Bayesian computation using the software DIYABC, for two invasive populations (Pop 1 and 2) and one native population (Pop 3). Scenario 1 corresponds to indepen dent introductions of Pop 1 and 2 from the native population. In this example, Pop 1 is older than Pop 2, but Pop 2 can be older than Pop 1 if t2 > t1, depending on the values of t1 and t2 drawn from their prior distributions. Scenarios 2 and 3 correspond to serial introductions of Pop 1 and 2. In scenarios 4 and 5, the most recent invasive population is the result of an admixture between individ uals from the native population at a rate ra and from the oldest invasive population at a rate 1 ra. N1, N2 and N3 are stable effec tive population sizes in Pop 1, 2 and 3, respectively. The introduction of population i occurred ti generations ago and includes a period of DBi generations of potentially small population size (NF2 and NF3 for Pop 2 and 3, respectively). Time 0 is the sampling time of populations 1 and 3; Pop 2 was sampled 30 generations ago.
grams that can be pipelined and launched indepen-dently to perform ABC for various models (includ-ing migration) and different types of molecular markers (DNA sequences, single-nucleotide poly-morphism (SNP) and microsatellites). The global flexibility of this package (ABCtoolbox can interact with virtually any command-line simulation pro-grams), modulo its potentially lower computation speed, makes it a complementary if not an alterna-tive tool to the more canned ABC software popABC and DIYABC for addressing questions dealing with invasion routes.
Theoretically, any number of populations and loci can be analysed with DIYABC, ABCtoolbox or
po-pABC and there is no theoretical limit to the com-plexity of the scenarios considered. However, two problems emerge when the number of populations becomes too large. First, the number of summary sta-tistics to be manipulated increases considerably with the number of populations (especially if different types of markers are considered in the same analy-sis). This may be of concern because ABC algorithms attempt to sample from a small multidimensional sphere around the observed statistics, and the proba-bility of accepting a simulation decreases exponen-tially as dimensionality increases. This phenomenon is referred to as the ‘curse of dimensionality’ and increasing the number of simulations may not be
All the indirect methods described earlier are subject to a major limitation: they take poorly into account the stochasticity of the demographic and genetic history considered. For a given set of demographic parameters, chance strongly affects the genetic composition of the samples studied, because (i) genetic drift affects the genetic composition of the source population; (ii) only part of the genetic variability of the source population is sampled during introduction; (iii) genetic bottlenecks often occur during the first few generations after intro-duction because of the limited number of founders and the small size of the newly founded population; (iv) mutational events occur at all stages in the introduction history of a species, and (v) field samples of popula-tions for genetic analysis usually consist of a limited number of individuals for which only a small number of genetic loci are characterized (Muirhead et al. 2008). As a result, the level of stochasticity is usually high and is likely to have profound consequences: a single ‘true’ introduction history with a unique combination of genetic and demographic parameters may give rise to large numbers of potentially very different genetic com-positions of the samples of the introduced populations collected (collection of a large number of different data
Past
Present
Inv2
Ghost
Source
Ancestral population
Inv1
Fig. 4Graphical representation of an invasion scenario in which an introduced ghost population, i.e. an unsampled population, derived from the source population, is the source of two invasive populations. The thin lines indicate the bottlenecks occurring in the first few generations following introductions. Genes were sampled in the source and invasive populations Inv1 and Inv2, but not in the ghost population. Considering scenarios with ghost populations, i.e. populations that participate in the invasion scenario but are not analysed, provides an opportunity to contrast scenarios with multiple introductions from the source in the native area with scenarios in which an unknown population already introduced into the invaded area is the source of various other invasive popula tions (bridgehead scenarios).
sufficient to deal with it (Beaumont et al. 2002). Recent improvements of ABC get round this prob-lem by using dimension reduction techniques, including a nonlinear feed-forward neural network (Blum & Franc¸ois 2010) and partial least squares regression (Wegmann et al. 2009). At least some algorithms of this type have been implemented in ABCtoolbox, but not in DIYABC or popABC. The added value of such algorithms in the context of complex models and large data sets remains, how-ever, to be thoroughly tested. Second, if the number of invasive populations to be considered becomes too large, then the number of possible scenarios becomes too large to be treated in a single ABC treatment (e.g. a set of one native and six invasive populations corresponds to 6! = 720 different scenar-ios, in which each invasive population is succes-sively derived from another invasive population without polychotomy or admixture). Historical infor-mation, like dates of first observation of the invasive populations, must be used in such cases, to reduce the number of possible scenarios. Historical informa-tion can also be used to define various nested sub-sets of competing invasion scenarios that are analysed sequentially. The first scenario considers the oldest invasive populations and determines their invasion routes. Step by step, subsequent analyses use the results obtained from the previous analyses,
until the most recent populations are considered (see Lombaert et al. 2010 for an example).
sets possible) and, reciprocally, different true introduc-tion histories may produce similar data sets. This sto-chasticity hence limits the validity of the results obtained by the indirect genetic methods described ear-lier, for which there is no simple method for estimating the probability of error (e.g. Knowles & Maddison 2002).
A second general drawback of both direct and indi-rect methods is that they do not generally allow
prob-abilistic estimations of competing introduction
scenarios (but see e.g. Gaggiotti et al. 2004). In prac-tice, a particular introduction scenario is chosen because the data (obtained directly or indirectly) are more consistent with that scenario than with other sce-narios. The choice of introduction scenario is a binary decisional process (accept or reject) in which the
likeli-hoods or weights of alternative scenarios are
unknown. For instance, a tree based on genetic dis-tances represents genetic relationships between popula-tions (or haplotypes) that can be interpreted in terms of introduction sequences. It may be possible to calcu-late the likelihood of the tree topology and to carry out statistical tests against alternative tree topologies (Huelsenbeck & Crandall 1997), but it is not possible to determine the likelihood of the history suggested by the topology or the weighting of this history relative to other possible histories.
Despite the abovementioned limitations and those highlighted in Box 1, indirect methods have proved useful in many cases. If the putative source populations display substantial genetic differentiation, then recon-struction of the invasion scenario may be reasonably straightforward (Geller et al. 2010). The invasion of Florida by the Cuban lizard provides an example of the successful inference of invasion routes (Kolbe et al. 2004) made possible by the high degree of inter-popula-tion genetic differentiainter-popula-tion and low levels of intra-popu-lation genetic variation in the source area. The extensive polymorphism found in Florida was interpreted as evi-dence for multiple introductions from Cuba. The inva-sion of America by the parthenogenetic snail Melanoides tuberculata is another case in which it was possible to retrace the invasion route by classical indirect methods (based on 12S and 16S mitochondrial DNA sequences; Facon et al. 2003). The native area of this freshwater snail contains several divergent, geographically struc-tured clades with low levels of intra-population genetic variability, probably because of the clonal mode of reproduction in this snail. A large proportion of the genetic variability of the native area was found in the recently invaded New World, providing evidence for multiple introductions. Other convincing examples of the inference of invasion routes by indirect methods have been reported in other studies in which high lev-els of inter-population genetic variation are observed in
the native area (e.g. Novak & Mack 2005; Roman 2006; Voisin et al. 2005).
Indirect model-based method based on approximate Bayesian computation
Approximate Bayesian computation (ABC; Beaumont et al. 2002) constitutes a new approach to carrying out model-based inference in a Bayesian setting in which model likelihoods are difficult to calculate (because of the complexity of the models considered) and must be estimated by massive simulations (see Bertorelle et al. 2010 and Csille´ry et al. 2010 for recent reviews on theo-retical and practical aspects of ABC, and Box 2 for fur-ther details on ABC in the context of inferences about invasion routes). The Bayesian nature of the method makes it possible to make use of prior historical, biolog-ical and genetic information about the system studied. Many ABC approaches treating genetic data are based on coalescent theory (Norborg 2001). Therefore, they take into account the stochasticity of the demographic and genetic processes involved. The ABC method can be used to calculate the relative probabilities of compet-ing scenarios from a finite set of complex scenarios and hence choose one most likely scenario (see Fig. 3 in Box 2 for an illustration of competing scenarios traditionally considered in the context of biological
invasions). Posterior distribution of demographic
parameters of interest can be also estimated in a given scenario.
The ABC method has four main advantages over the more traditional indirect methods described earlier: (i) it uses all the data simultaneously in inference, unlike the methods based on trees, raw Fstor assignment
like-lihood values, (ii) it can be used to estimate probabili-ties, with confidence intervals for each of the scenarios compared (e.g. Cornuet et al. 2008), (iii) it can be used to evaluate the power for deciding between a set of invasion scenarios on the basis of controlled simulated data sets (Cornuet et al. 2008; Guillemaud et al. 2010), and (iv) it avoids the introduction of misleading biases, such as those because of nonsampled ghost populations (Guillemaud et al. 2010; Box 2) or genetic admixture between multiple sources (Lombaert et al. 2010), if included in the set of compared scenarios. The ABC method thus constitutes a real advance in the inference of invasion routes.
However, in addition to the limitations mentioned in Box 2, a number of difficulties in the application of this method remain in the context of inferences about inva-sion routes. For instance, it remains difficult to distin-guish between a single introduction of a large number of individuals and repeated introductions of a small num-ber of individuals originating from the same source
pop-the shrub Scotch broom (Kang et al. 2007), pop-the mos-quito Culex quiquefasciatus (Fonseca et al. 2000), the amphipod Gammarus tigrinus (Kelly et al. 2006) and other cases reported elsewhere (Bossdorf et al. 2005; Roman & Darling 2007; Geller et al. 2010), together with the worldwide spread of D. virgifera virgifera, suggest that multiple introductions of invasive species might be a common phenomenon. This idea is not new in itself, but convincing demonstrations of this evolutionary scenario remained rare until recently. Until the 1980s, the western corn rootworm D. virgifera virgifera had a geographical range extending from Mex-ico to the east coast of North America. It was recently introduced into Europe, where it was first observed in 1992, near Belgrade, Serbia, and from where it rapidly spread. Several disconnected outbreaks of D. virgifera virgifera infestation have since been observed in Wes-tern Europe. The first of these outbreaks was detected in Venice in 1998, and further outbreaks have since been detected in northwest Italy and Switzerland in 2000, at two different sites in northeast Italy in 2002 and 2003, in northern Italy, eastern France, Switzer-land, Belgium, the United Kingdom and the Nether-lands in 2003, near Paris, France in 2002, 2004 and 2005 and, more recently, in Germany in 2007 (Ciosi et al. 2008). The explanation most frequently put for-ward for the distribution of the western corn root-worm in Europe was that the isolated outbreak populations were ‘leap-frogging’ out of the growing Eastern European population. Using the ABC frame-work presented in Box 2, Miller et al. (2005) showed that this hypothesis was very probably false and that at least three, and probably four disconnected Western European outbreaks had actually resulted from inde-pendent introductions from North America. It was not possible to reconstruct the routes of invasion for D. virgifera virgifera by classical indirect methods (Box 1), because the source population of all European outbreaks the northeastern American population is a single, genetically homogeneous population. In D. vir-gifera virvir-gifera, one consequence of the multiple-intro-duction scenario is the transfer of genetic variation from the intra- to the inter-population level. This pat-tern is the inverse of that commonly observed for mul-tiple introductions, which generally lead to there being more genetic variation, rather than less, within the areas of introduction (reviewed in Kolbe et al. 2004; Lavergne & Molofsky 2007; Lee 2002; Roman & Dar-ling 2007). In the later cases, multiple introductions lead to a large genetic variation within the introduced area(s) which may favour adaptation to remote territo-ries conditions and thus the settlement and spread of introduced propagules (Facon et al. 2006; Wares et al. 2005).
ulation. It is also difficult to estimate some of the histori-cal parameters of the invasion scenarios, such as recent dates of introduction. Finally, it should be stressed that use of the ABC method does not overcome the need to sample a large enough number of sites in both the native range and the range of introduction and to analyse these samples at a sufficiently large number of loci to be confi-dent of obtaining a global picture of the population struc-ture of the invasive species in both its native and invasive ranges. This general principle has been often neglected (Muirhead et al. 2008 but see Durka et al. 2005). Standard methods of population structure analy-sis, such as Fst-based analysis and ⁄ or STRUCTURE
(Prit-chard et al. 2000), BAPS (Corander et al. 2003) or GENELAND (Guillot et al. 2005) analyses, may be used for this purpose. In practice, population samples from the same population unit are pooled for subsequent inferences about invasion routes based on the ABC method (e.g. Lombaert et al. 2010; Pascual et al. 2007).
What molecular data have taught us about invasion routes?
Analyses of molecular markers to infer invasion routes have, in certain cases, confirmed previous suspicions based on historical observations. For instance, Pascual et al. (2007) retraced the history of the recent colonization of the New World by D. subobscura following its intro-duction from Europe. The most likely invasion route involves successive introductions, with a first founder event in South America, and then a second involving the introduction of the species into North America from South America. Moreover, Pascual et al. (2007) showed that the New World flies probably originated from the Mediterranean region (probably from the area around Barcelona). In other cases, indirect methods have gener-ated unexpected results. Conclusions using mtDNA data about the sources of the invasion of California by the Atlantic amethyst gem clam Gemma gemma differ sub-stantially from the historical records (Hoos et al. 2010). Two other examples of unexpected results regarding invasion routes, obtained with ABC methods, are detailed below (i.e. the invasion routes of the western corn rootworm Diabrotica virgifera virgifera and the Harle-quin ladybeetle, Harmonia axyridis). In any case, indirect methods applied to genetic data helped to define general rules regarding invasions and to generate useful hypoth-eses regarding the environmental and evolutionary fac-tors underlying biological invasions.
Multiple introductions
The examples of the Cuban lizard (Kolbe et al. 2004), the freshwater snail M. tuberculata (Facon et al. 2003),
Invasive bridgehead effect
Recent studies of invasion routes have also suggested that a number of successful invasions have involved a specific evolutionary scenario that we call here the ‘invasive bridgehead effect’. The concept of an ‘invasion bridgehead’ refers to widespread secondary invasions stemming from a particularly successful invasive popu-lation, which serves as a source of colonists for poten-tially remote new territories (Downie 2002; Floerl et al. 2009; Hanfling et al. 2002; Kolbe et al. 2004; Miller et al. 2005). The invasive bridgehead scenario is evolution-arily parsimonious: a single evolutionary shift in a sin-gle introduced population (the bridgehead) is required, whereas multiple changes are required in the case of multiple introduced populations, which must indepen-dently evolve traits conferring invasiveness. It is worth noting that the bridgehead population did not necessar-ily endured an important evolutionary shift as it could be (also) geographically favoured with respect to human vectors. Convincing demonstrations of such an invasive bridgehead effect remain scarce because (i) this scenario was only recently formalized (Lombaert et al. 2010), (ii) appropriate methods for reconstructing routes of invasion were previously lacking and (iii) too few invasive populations have been studied to capture the global picture of the worldwide invasion process for most species. The Harlequin ladybeetle, H. axyridis, whose native area is in Asia, is a worldwide invader that provides a striking illustration of the invasive bridgehead effect. This species has been used as a bio-logical control agent against aphids since 1916 in North America, but only recently have remote established populations been observed. Invasive populations were first recorded in eastern North America in 1988 and in western North America in 1991. This beetle was then recorded in Europe and South America in 2001 and in South Africa in 2004 (reviewed in Lombaert et al. 2010). Using ABC methods applied to microsatellite and his-torical data, Lombaert et al. (2010) compared large sets of H. axyridis (HA) invasion scenarios covering all invaded areas, taking into account historical data (dates of first observation of the outbreaks and dates of initial collection of biocontrol strains) and all potential sources (native, older outbreaks and biocontrol), including genetic admixtures. The data and alternative models, analysed with DIYABC software (Cornuet et al. 2008), show that the recent sudden burst of worldwide inva-sions of HA outside its native Asian area have followed a bridgehead scenario, with the invasive population in eastern North America acting as the source of the colo-nists invading the European, South American and Afri-can continents. These analyses also showed that the HA population invading Europe was derived from an
admixture between the bridgehead population and indi-viduals used as biological control agents. The potential role of admixture with individuals used for biocontrol in Europe is unknown.
From an evolutionary biology perspective, the inva-sive bridgehead scenario is fundamentally different from scenarios in which the invasive populations originate directly from the source population in the native area (Guillemaud et al. 2010; Miller et al. 2005). It is therefore of crucial importance to distinguish between all these possible scenarios. One solution proposed by DIYABC (Cornuet et al. 2008) is the inclusion among the tested invasion routes of a sce-nario in which an unsampled bridgehead population acts as the source of the various invasive populations analysed (Box 2).
Conclusions and perspectives
For most invasive species, our knowledge about intro-duction pathways is based largely on historical and observational data, which are often sparse, incomplete and, sometimes, misleading. In this context, population genetics has proved to be a useful approach to the reconstruction of routes of introduction, highlighting the complexity of the real story and, in some cases, the extent to which it may be counterintuitive. The recent development of new model-based methods, such as ABC, has proved particularly useful and our ability to draw inferences about invasion routes is likely to increase further in the near future. The cost of producing large data sets of genetic markers (e.g. SNPs) using high-throughput methods is rapidly decreasing (Gupta 2008; Hert et al. 2008) and statistical methods for the efficient treatment of such data sets are being developed (Beaumont & Rannala 2004; Berto-relle et al. 2010; Csille´ry et al. 2010). The conjunction of these two trends will soon make it possible to dis-tinguish very precisely between invasion scenarios that are currently almost indistinguishable. For example, if several invasive populations originate from source populations with very low levels of differentiation, the use of tens of variable microsatellite markers is unli-kely to be sufficient for the precise inference of intro-duction routes (e.g. the case of D. virgifera virgifera in the US Corn Belt (Ciosi et al. 2008)). The genotyping of individuals at hundred or thousand of markers should make it possible to identify the source of an invasion even if the levels of genetic differentiation are very low.
Elucidation of the routes of introduction of undesir-able organisms is essential for the development of effec-tive management strategies and sustainable science-based policies. It facilitates the design of strategies for
viding useful comments and references. This work was supported by grants from the Agence Nationale de la Recherche (ANR 06 BDIV 008 01 and ANR 09 BLAN 0145 01) and from the Agropolis Fondation (RTRA Montpellier, BIOFIS project).
References
Anderson CNK, Ramaksishnan U, Chan YL, Hadly EA (2005) Serial SimCoal: a population genetics model for data from multiple populations and points in time. Bioinformatics, 21, 1733 1734.
Anonymous (1993) Maize in Human Nutrition. Food and Agriculture Organisation of the United Nations, Rome. Beaumont MA, Rannala B (2004) The Bayesian revolution in
genetics. Nature Reviews Genetics, 5, 251 261.
Beaumont MA, Zhang WY, Balding DJ (2002) Approximate Bayesian computation in population genetics. Genetics, 162, 2025 2035.
Bertorelle G, Bonazzo A, Mona S (2010) ABC as a flexible framework to estimate demography over space and time: some cons, many pros. Molecular Ecology, 19, 2609 2625. Blum MGB, Franc¸ois O (2010) Non linear regression models
for Approximate Bayesian Computation. Statistics and Computing, 20, 63 73.
Bossdorf O, Auge H, Lafuma L, Rogers WE, Siemann E, Prati D (2005) Phenotypic and genetic differentiation between native and introduced plant populations. Oecologia, 144, 1 11. Cadotte MW, McMahon SM, Fukami T (2006) Conceptual
Ecology and Invasion Biology: Reciprocal Approaches to Nature. Springer, Dordrecht, The Netherlands.
Cavalli Sforza LL, Edwards AWF (1967) Phylogenetic analysis: models and estimation procedures. American Journal of Human Genetics, 19, 233 257.
Chen GK, Marjoram P, Wall JD (2009) Fast and flexible simulation of DNA sequence data. Genome Research, 19, 136 142.
Ciosi M, Miller NJ, Kim KS, Giordano R, Estoup A, Guillemaud T (2008) Invasion of Europe by the western corn rootworm, Diabrotica virgifera virgifera: multiple transatlantic introductions with various reductions of genetic diversity. Molecular Ecology, 17, 3614 3627.
Colautti RI, MacIsaac HJ (2004) A neutral terminology to define ‘invasive’ species. Diversity and Distributions, 10, 135 141. Corander J, Waldmann P, Sillanpaa MJ (2003) Bayesian
analysis of genetic differentiation between populations. Genetics, 163, 367 374.
Cornuet JM, Santos F, Beaumont MA et al. (2008) Inferring population history with DIY ABC: a user friendly approach to approximate Bayesian computation. Bioinformatics, 24, 2713 2719.
Cornuet JM, Ravigne´ V, Estoup A (2010) Inference on population history and model checking using DNA sequence and microsatellite data with the software DIYABC (v1.0). BMC Bioinformatics, 11, 401.
Csille´ry K, Blum MGB, Gaggiotti O, Franc¸ois O (2010) Approximate Bayesian Computation (ABC) in practice. Trends in Ecology and Evolution, 25, 410 418.
Darling JA, Bagley MJ, Roman J, Tepolt CK, Geller JB (2008) Genetic patterns across multiple introductions of the globally invasive crab genus Carcinus. Molecular Ecology, 17, 4992 5007.
preventing new accidental disseminations of alien organisms by promoting heightened vigilance (through specific monitoring and quarantine measures) against the identified key source populations, including inva-sive bridgehead populations (e.g. Sved et al. 2003; Miller et al. 2005; Rollins et al. 2009; Thibault et al. 2009; Lombaert et al. 2010). Knowledge of sources helps to define the ecological characteristics of introduced populations and hence predict the extent of ultimate distribution in the region of introduction (Kolar & Lodge 2001). Finally, a precise identification of the source population(s) within the native also aids in the choice of strains of auxiliary agents that can be used for biological control with the same geographical origin as the invasive population (Roderick & Navajas 2003). It is worth stressing, however, that the actual management outcomes of studies regarding invasion routes will lar-gely depend on the suitability of the recommendations relative to other agenda (political, financial, operational ease, etc.).
Elucidation of the routes of introduction is also required for defining and testing useful hypotheses concerning the environmental and evolutionary factors underlying biological invasions. Once invasion routes have been inferred and hypotheses deduced, further laboratory-based studies can begin. Intensive quantita-tive genetics studies are required to test and to mea-sure the key factors that may have evolved in response to natural selection during invasions (Facon et al. 2006; Keller & Taylor 2008). Some studies have convincingly demonstrated the occurrence of adaptive evolution after introduction for some traits, but there have been few demonstrations of the instrumental role of adaptation for such traits in the success of invasions (i.e. these studies have not demonstrated that the adaptation allowed the invasions). It generally remains unclear whether adaptation for the traits studied allowed the invasion, coincided with the invasion or was a consequence of the invasion (but see Lee et al. 2003). An approach allowing the comparison of the traits of introduced populations of a given species that invade and introduced populations of the same species that do not invade would facilitate identification of the environmental and ⁄ or evolutionary factors underlying successful invasion. In this context, species for which multiple introductions have occurred but for which only a subset of the introduced populations became invasive could prove to be the goose that laid the golden egg.
Acknowledgements
We thank Marc Ciosi and Julie Turgeon for fruitful discus sions, Ruth Hufbauer and four anonymous reviewers for pro