HAL Id: inserm-00663680
https://www.hal.inserm.fr/inserm-00663680
Submitted on 27 Jan 2012
HAL is a multi-disciplinary open access
archive for the deposit and dissemination of
sci-entific research documents, whether they are
pub-lished or not. The documents may come from
teaching and research institutions in France or
abroad, or from public or private research centers.
L’archive ouverte pluridisciplinaire HAL, est
destinée au dépôt et à la diffusion de documents
scientifiques de niveau recherche, publiés ou non,
émanant des établissements d’enseignement et de
recherche français ou étrangers, des laboratoires
publics ou privés.
Evaluation of aortic valve stenosis from Phase-Contrast
Magnetic Resonance data using a new automated
segmentation and analysis method: Comparison against
Doppler Echocardiography
Carine Defrance, Emilie Bollache, Nadjia Kachenoura, Eric Bruguière, Alban
Redheuil, Benoit Diebold, Ludivine Perdrix, Elie Mousseaux
To cite this version:
Carine Defrance, Emilie Bollache, Nadjia Kachenoura, Eric Bruguière, Alban Redheuil, et al..
Eval-uation of aortic valve stenosis from Phase-Contrast Magnetic Resonance data using a new
auto-mated segmentation and analysis method: Comparison against Doppler Echocardiography. 2011
SCMR/Euro CMR Joint Scientific Sessions, Feb 2011, Nice, France. pp.O30,
�10.1186/1532-429X-13-S1-O30�. �inserm-00663680�
O R A L P R E S E N T A T I O N
Open Access
Evaluation of aortic valve stenosis from
Phase-Contrast Magnetic Resonance data using a new
automated segmentation and analysis method:
Comparison against Doppler Echocardiography
Carine Defrance
1*, Emilie Bollache
2, Nadjia Kachenoura
2, Eric Bruguière
1, Alban Redheuil
1, Benoit Diebold
1,
Ludivine Perdrix
1, Elie Mousseaux
1From 2011 SCMR/Euro CMR Joint Scientific Sessions
Nice, France. 3-6 February 2011
Background
Aortic valve stenosis (AVS) is the most common valvu-lar disease. Its evaluation is of growing interest because of its increasing incidence with the aging population. Previous studies demonstrated the usefulness of Phase-Contrast Magnetic Resonance (PCMR) images in the evaluation of AVS. However, because of the lack of automated methods for PCMR data analysis, this techni-que remains time-consuming and operator-dependent.
Objectives
Therefore, the aims of this study were 1) to develop a semi-automated method for aortic flow analysis from PCMR images, and 2) to evaluate several approaches of aortic valve area (AVA) estimation.
Methods
We studied 37 consecutive patients with AVS (mean AVA:0,89 +/-0,42 cm2) and 12 healthy subjects (mean AVA: 3,19 +/- 0,65 cm2) who had the same day a trans-thoracic echocardiography (TTE) and PCMR acquisitions at the levels of the aortic valve and the left ventricle outflow tract (LVOT). PCMR data analysis included a semi-automated segmentation, based on pix-els connectivity in terms of velocity sign, to delineate the aortic flow on all systolic frames, as well as a func-tional parameters extraction from aortic velocity and flow rate curves such as aortic maximal velocity (VmaxAo) and AVA. AVA was calculated using: 1)
Hakki’s formula which is a simplification of Gorlin’s for-mula, resulting in AVA1= cardiac output divided by √systolic pressure gradient, 2) the continuity equation with the most pertinent method found in previous stu-dies in PCMR resulting in AVA2 = LVOT stroke volume (LVOT SV) divided by aortic valve velocity time integral (VTIAo), and 3) the continuity equation with
another approach previously described in echocardiogra-phy but never used in PCMR. It resulted in AVA3= LVOT peak Flow rate (QLVOT) divided by VmaxAo
(figure 1).
Results
The LVOT and aortic flows were successfully delineated on all phases for all subjects. Comparison of PCMR and echocardiographic VmaxAo resulted in a good
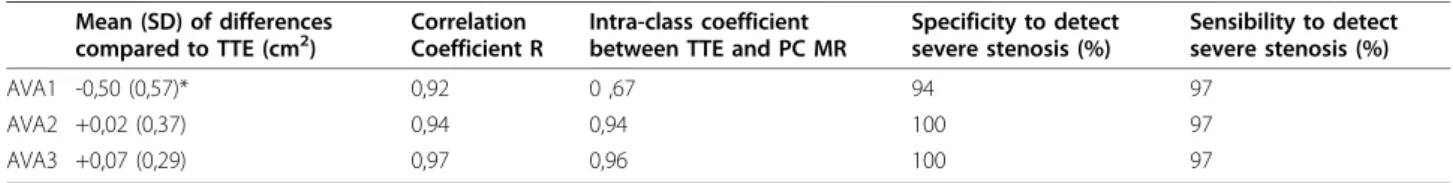
correla-tion(r = 0.92). Hakki’s formula underestimated the AVA with regard to TTE in the absence of severe stenosis. AVA3 provided the best results (Table 1) in terms of detection of severe stenosis (r = 0.97; Specificity = 100% and Sensibility = 97%). Moreover, excellent intra-observer reproducibility was found (AVA3: ICC > 0.99 and mean differences: 0.00 ± 0.02 cm2; VmaxAo:ICC >
0.99 and mean differences: 0.02 ± 0.10 m/s).
Conclusion
Our semi-automated approach for AVS evaluation from PCMR provided reproducible velocity measurements and AVA estimates in good agreement with echocardio-graphic values, and were able to characterize the severity of AVS.
1Hopital Européen Georges Pompidou, Paris, France
Full list of author information is available at the end of the article
Defrance et al. Journal of Cardiovascular Magnetic Resonance 2011, 13(Suppl 1):O30 http://jcmr-online.com/content/13/S1/O30
© 2011 Defrance et al; licensee BioMed Central Ltd. This is an open access article distributed under the terms of the Creative Commons Attribution License (http://creativecommons.org/licenses/by/2.0), which permits unrestricted use, distribution, and reproduction in any medium, provided the original work is properly cited.
Author details
1Hopital Européen Georges Pompidou, Paris, France.2INSERM U678, Paris,
France.
Published: 2 February 2011
doi:10.1186/1532-429X-13-S1-O30
Cite this article as: Defrance et al.: Evaluation of aortic valve stenosis from Phase-Contrast Magnetic Resonance data using a new automated segmentation and analysis method: Comparison against Doppler Echocardiography. Journal of Cardiovascular Magnetic Resonance 2011 13 (Suppl 1):O30.
Figure 1 A) Example of left ventricular outflow tract (LVOT) segmentation on a velocity PC MR image, flow rate curve, whose integral corresponds to LVOT stroke volume (LVOT SV) and whose peak corresponds to Q LVOT Q; B) Example of aortic flow segmentation on a velocity PC MR image, transaortic maximal velocity curve, whose integral corresponds to VTIAOand whose peak corresponds to VmaxAO. AVA2 is the
ratio between the two integrals. AVA3 is the ratio between the two peaks.
Table 1 Comparison between TTE and PC MRI using the three methods for AVA estimation (*p<0.05) Mean (SD) of differences
compared to TTE (cm2) CorrelationCoefficient R Intra-class coefficientbetween TTE and PC MR Specificity to detectsevere stenosis (%) Sensibility to detectsevere stenosis (%)
AVA1 -0,50 (0,57)* 0,92 0 ,67 94 97
AVA2 +0,02 (0,37) 0,94 0,94 100 97
AVA3 +0,07 (0,29) 0,97 0,96 100 97
Defrance et al. Journal of Cardiovascular Magnetic Resonance 2011, 13(Suppl 1):O30 http://jcmr-online.com/content/13/S1/O30