Complex System Analysis through Discrete Event Simulation Anthony G Faranca
Bachelor of Science in Mechanical Engineering, Lehigh University (1995) Submitted to the Department of Mechanical Engineering
and the Sloan School of Management in partial fulfillment of the requirement for the degrees of
Master of Science in Mechanical Engineering and
Master of Business Administration
In conjunction with the Leaders for Manufacturing Program at the Massachusetts Institute of Technology
June 2004
C2004 Massachusetts Institute of Technology. All rights reserved.
Signature of Author
C
3 'eprtment of Mechanical E g Sloan School of Management May 9, 2004 Certified by
Certified by
Accepted by
Jeremie Gallien, Thesis Supervisor J. Spencer Standish Career Development Professor
David Hardt, Thesis Supervisor Professor of Mechanical Engineering
I- - -
-Margaret Andrews, Executive Director of Masters Program Sloan School of Management
Accepted by
Ain Sonin, Chairman, Graduate Committee Department of Mechanical Engineering
BARKER
MASSACHUSETTS INSTMJTE OF TECHNOLOGY
T
L O
1
200]
Complex System Analysis through Discrete Event Simulation Anthony G Faranca
Bachelor of Science in Mechanical Engineering, Lehigh University (1995) Submitted to the Department of Mechanical Engineering
and the Sloan School of Management in partial fulfillment of the requirement for the degrees of
Master of Science in Mechanical Engineering &
Master of Business Administration Abstract
E-commerce is generally thought of as a world without walls. Although a computer monitor may replace a storefront window, the products that are purchased online have to be distributed from a brick and mortar warehouse.
Amazon.com now makes it possible to instantly order and quickly receive everything from CDs and books to large toys and home furnishings. Amazon's success not only depends on their e-business capabilities, but also on their distribution and warehouse management systems that support them.
Fulfillment center management therefore has become an important component of Amazon's unique set of system activities that serve as a corporate strategy. In an attempt to improve current and future warehouse management practices, the engineering group at Amazon has recently invested in Discrete Event Simulation technology.
This thesis focuses on the creation of a discrete event simulation of the Fernley, NV semi-automated distribution center's outbound flow process. More specifically, the business subjects investigated include: picker variability, tote diversion, item-per-tote reduction, and conveyor merge logic. The model presented is Amazon's first attempt at simulating this environment and serves as an initial step towards a more detailed simulation of this facility. Preliminary findings from the simulation are presented and the report is concluded with a cultural evaluation of the present engineering directive.
It should be noted that this published version of the thesis has been approved by Amazon.com and does not contain any proprietary data. A fully detailed version of this thesis was only submitted to Amazon.com and to the advisors listed below.
Thesis Supervisor: Jeremie Gallien
Title: Assistant Professor of Operations Management Thesis Supervisor: David Hardt
Acknowledgements
I would like to take this opportunity to thank and acknowledge the people and institutions that have provided support during my journey in the MIT Leaders for Manufacturing Program.
The LFM program has been an invaluable experience and I would especially like to thank the director of the program, Don Rosenfield for developing a superb learning environment. My overall outlook on life has changed as a result of this process and I am extremely thankful to have had this opportunity.
I would like to thank my thesis advisors, Jeremie Gallien and David Hardt. Both of these gentlemen provided excellent support and made frequent visits to my location in Fernley, NV. Their insightful input during their visits helped to develop and focus the scope of my work.
The internship sponsoring company, Amazon.com should be distinguished for providing a robust internship experience. Amazon is attempting to create a strong network of LFM alumni and their partnership with MIT continues to grow.
I would specifically like to thank several Amazon employees that provided unwavering support throughout my project. Brent Beabout, Tina Kroepel, Cabby Walsh, Brady Robinette, and Sean O'Neal are just a few of the many Amazon staff members that made my experience at the Fernley distribution center an excellent working environment.
Lastly, Amazon's engineering director Lou Usarzewicz should be recognized for providing one of the most challenging situations that I have faced in my short career. Thanks to Lou, I have not only learned a tremendous amount about discrete event simulation, but also have learned a tremendous amount about people skills and management styles that will undoubtedly help shape my approach to leadership.
Table of Contents
Abstract...2
Acknowledgements ...3
Table of Contents 4 List of Figures...6
Chapter 1: Executive Summary ...7
1.1 Introduction 7 1.2 Problem Statement 7 1.3 Model Validation 8 1.4 Major Findings ... 10
1.4.1 Quantifying Picker Variability ... 11
1.4.2 "Singles" Tote Diversion 11 1.4.3 Items per Tote Reduction ... 12
1.4.4 "7 to 1" Merge Observations ... 13
1.5 Next Steps for the Simulation Model ... 14
1.6 The Amazon Engineering Culture ... N/A 1.6.1 Lack of Structure & Alternative Implementation Plans .N/A 1.6.2 Amazon's Cultural Impact on the Internship ... N/A 1.6.3 Amazon's Corporate Strategy ... N/A 1.6.4 Recommendations for LFM Internships ... N/A Chapter 2: Introduction to System Simulation ... 17
2.1 Discrete Event System Simulation 17 2.2 Simulation & Corporate Industry ... 18
2.3 Basic Steps of a Simulation Study ... 20
Chapter 3: Introduction to Amazon.com ... 23
3.1 Problem Statement 23 3.2 High Level Introduction ... 24
3.3 Project Scope ... 25
3.3.1 Order Generation & Product Line Assignment ... 26
3.3.2 Pick Mod Assignment & Inventory Profile ... 26
3.3.3 Picking Delay Times ... .... ... 27
3.3.4 Multi-Shipment Limiter ... 27
3.3.5 Picking Capacity... 27
3.3.6 Tote Make-Up .. ... 28
3.3.7 Merge Logic for the 7 to 1 & 2 to 1 ... 28
3.3.8 **** 28 3.3.9 Induction Logic ... 28
3.3.10 Routing Sorter ... 29
3.3.11 Inductor Performance 29 3.3.12 Automatic Sortation Trays ... 29
3.3.13 Order Completion ... 29
3.4 Model Validation & Primary Metrics ... 30
Chapter 4: Amazon's Outbound Process & Simul8 Simulation Discussion .. 32
4.1 Customer Order Generation_... 32
4.1.2 Product Group Assignment ... 33
4.2 Stocked Inventory & December 10th, 2003 Inventory Profile ... 34
4.3 Manual Picking of Customer Ordered Items ... 35
4.3.1 Picking Delay Factors 36 4.3.2 Multi-Shipment Limiter ... 37
4.4 Batching Items into "totes" 38 4.5 Tote Drop-off & 7 to 1 Merge Point, ... 40
4.6 General Conveyor Travel & Efficiency ... 41
4.7 Routing Sorter & the 2 to 1 Merge ... 41
4.8 Ten Induction Lanes & Stations 43 4.9 Automatic Sortation Trays & Order Fulfillment Chutes 44 Chapter 5: Results Section 1: Model Set-up & Validation ... 46
5.1 Model Set-up ... 46
5.2 Running Simul8 ... 47
5.3 Model Validation Set-Up ... 49
5.3.1 Picker Variability Hypothesis ... 51
5.3.2 Relative Prediction Validity ... 52
Chapter 6: Results Section 2: "What-if Scenarios" ...55
6.1 Capturing Picker Variability ... 55
6.2 "Singles" Tote Removal ... 58
6.3 Items per Tote Reduction ... 60
Chapter 7: Leadership and Organizational Change ... N/A 7.1 Internship Project Background & Goals - ... ... N/A 7.2 Engineering Culture and its Impact on the Internship ... N/A 7.3 Employee Training... N/A 7.3.1 The Cost of not providing proper Training ... N/A 7.3.2 The Positive Impact of Employee Training ... N/A 7.4 Chosen Implementation & Suggested Alternatives N/A 7.4.1 Alternative Designs #1 & #2 ...N/A 7.4.2 Alternative Design #3 -Simul8 Consulting Services ... N/A 7.5 Does Discrete Modeling Provide a Sustainable Advantage? N/A 7.6 Evaluation and Recommendations N/A 7.6.1 Local Mentor. N/A 7.6.2 The Reno Distribution Center N/A Bibliography ... 63
Appendix A . ... 64
List of Figures Figure A Figure B Figure C Figure #1 Figure #2 Figure #3 Figure #4 Figure #5 Figure #6 Figure #7 Figure #8 Figure #9 Figure #10 Figure #11 Figure #12 Figure #13 Figure #14 Figure #15 Figure #16 Figure #17 Figure #18 Figure #19 Figure #20 Figure #21 Figure #22
Comparison Table & Simul8 Confidence Interval for ****.8
Reduced Items per Tote Comparison Table ... 11
Simul8 Output Table ... 14
Basic Steps of a Simulation Study ... 21
General Amazon Outbound Flow Process Diagram ... 25
Model Validation (Input, Mid-Point, & Output) ... 29
Number of Units per Customer Order ... 32
Product Line Assignment per Unit " ... ... 33
Multi Unit Order Tote (# of Units per tote) ... 38
Single Unit Order Tote (# of Units per tote) ... 38
Inductor Performance for December 2003' 43 Actual System Data... 45
Five Independent Simul8 Runs ... ... 48
**** Comparison Table ... 48
Histogram ... 48
December 13th Simul8 Runs 52 **** Ratio Comparison... ... ... 52
Capturing Picker Variability ... 54
"Singles" Tote Diversion **** Comparison, ... 57
"Singles" Tote Diversion Comparison Table ... 58
Tote Breakdown .__._... .... 58
Item per tote reduction / plot ... 59
Reduced Items Per Tote Comparison Table ... 60 Inadequate Training for New Initiatives ... N/A Employee Training Benefits.. ... ... N/A
Chapter 1: Executive Summary 1.1 Introduction
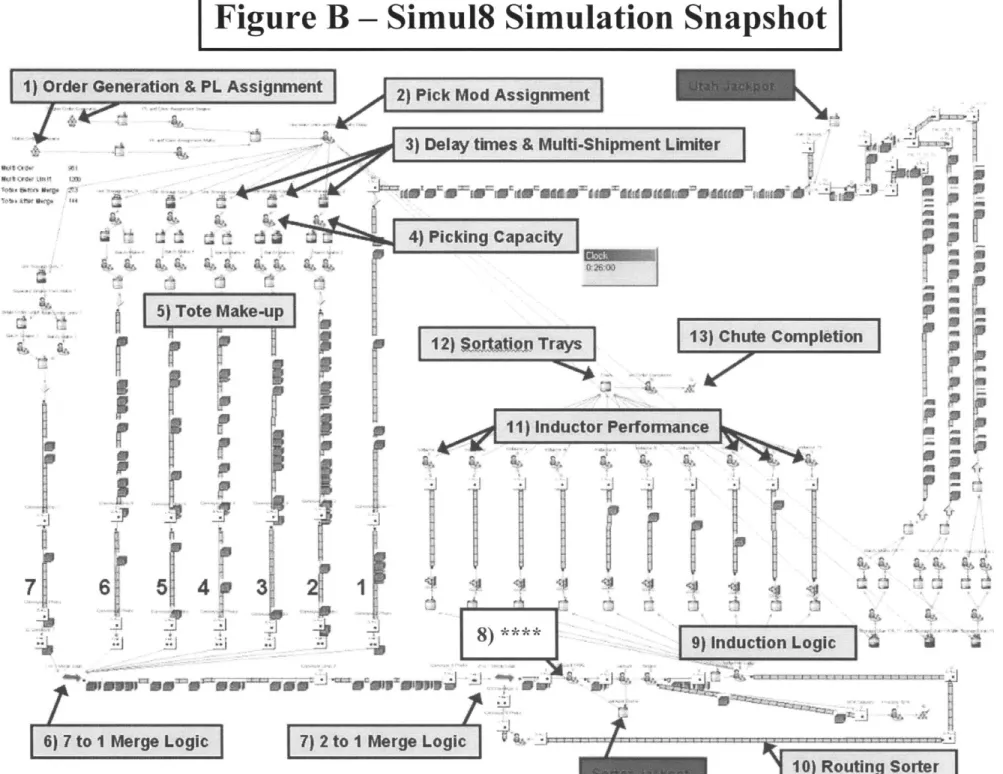
Can a discrete event simulation provide insight into the operational practices of a modem distribution center? That is the central issue addressed in this report. What follows is a summary discussion that describes a discrete event simulation model of an Amazon semi-automated distribution center and the foresight gained by that analysis. Because of the breadth of Reno's operations, the scope of the project was limited to outbound product flow and does not include picker variability or tote prioritization. Please see Figure B in Appendix A for a summary of the major components included in the simulation.
The preliminary findings presented in this report are based upon a simulation model that relies on actual historical data for input, not simply rough estimates of the major variables incorporated. The final chapter of this report focuses on the structure of Amazon's current implementation plan and presents suggested alternatives. In addition, there is a brief discussion involving the leadership and culture within Amazon and how it impacted project performance. This executive summary has five remaining sections: Problem Statement, Model Validation, Major Findings, Recommendations for Next Steps, and The Amazon Engineering Culture.
1.2 Problem Statement
The Amazon Reno distribution center is a semi-automated facility. The requirements placed on this distribution center have been consistently growing as a result of a changing product mix and increased volume. Therefore, in order to provide a new level of insight into present and future outbound operations, a model of outbound flow was created in the
discrete event simulation package Simul8. The primary focus of the model is to approximate the aggregate impact of picker variability, quantify the influence of single-tote diversion, estimate the effects of item per single-tote reduction, and analyze the 7 to 1 merge logic. The secondary goal of this model is to launch the beginning of a larger scale vision that Amazon has for completing a full simulation of Reno's outbound flow that includes greater detail.
It should be noted that it was never the intention of this model to exactly mimic reality. From the outset, one of the largest sources of variability was deemed outside the project scope. For example, applying variation to picking capacity was purposely not included in the model so that the aggregate impact of this variability could be estimated through comparisons with real data. In the real system, it is hypothesized that picker variability is
the most significant contributor to the primary metric ****. **** is recorded at a mid-point in outbound flow and is defined as - (Definition of **** removed for proprietary
reasons!). Thus, due to the lack of picker variation, it was predicted that the model would significantly underestimate average **** and standard deviation.
1.3 Model Validation
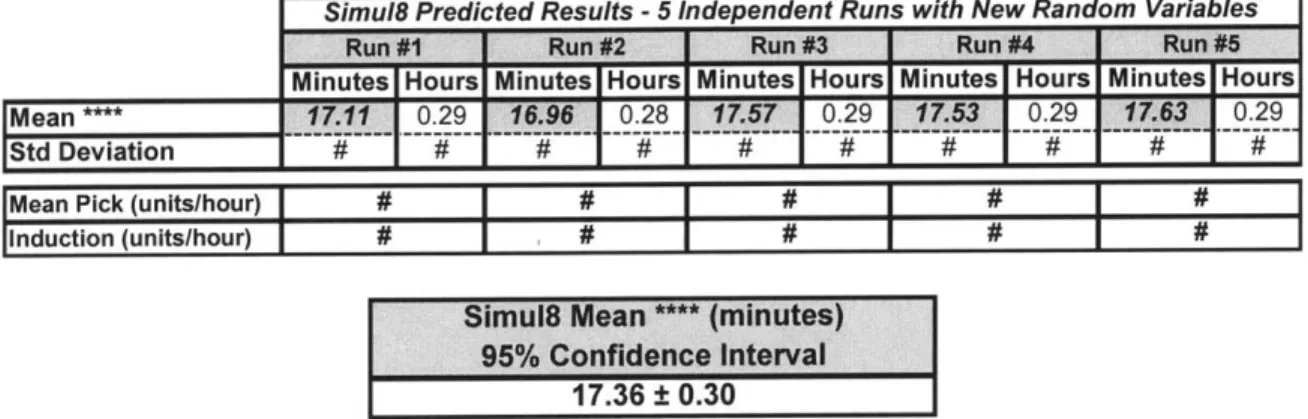
In order to prove that the Simul8 model is reflective of the actual system, an iterative validation process was performed. One primary metric was utilized in conjunction with a known input and a known output. **** served as the primary metric. Actual performance regarding peak picking capacity served as a known input. Lastly, data reflecting actual inductor volume served as a known output. Please refer to chapter five for a detailed discussion on model validation.
On December the 10th of 2003, the Reno distribution center shipped more volume than ever recorded in its history. Therefore, because Amazon is interested in peak capacity, it is this day's characteristics (picking capacity, ****, and inductor volume) that are compared with the simulation's output. The final version of the simulation model was run five times with a unique string of random numbers for each trial. Please visit section
5.3 for detailed information on these model runs. The Simul8 model showed little sensitivity to this changing input and the average of these results is displayed below.
Comparison Table
Actual Dec. IMt 91m=18 Average
Average Pick (units/hour) # #
nduction (Units / hour) # #
Figure A - Comparison Table & Simul8 Confidence Interval for ****
By observing the comparison table above, it is clear that there is a significant difference between the actual and predicted average **** & standard deviation. In contrast, it is also clear that the simulation model's average number of picks entering the system and the total units inducted exiting the system are both extremely close to reality (~ 3%). As previously mentioned, this result is not a surprise, rather expected. Without the inclusion of picker variability on the input side, it was predicted that the model's input and output volumes would be very close to actual; however, the model's **** result would be far
less in magnitude than what was recorded on that day. I
Minutes Hours Minutes Hours
Average ***# # 17.36 02
Std# #eia#o #
--Although the model admittedly does not include other sources of variability such as release rate fluctuation and unrecorded downtime, it is hypothesized that the majority of the **** discrepancy shown above is due to the model's lack of picking variability (See section 5.3.2 for Picker Variability Hypothesis). This is primarily based on the fact that the downtime recorded on December 10th was minimal and is mimicked by the model. Thus, given that the discrepancy between the actual and simulated results was thought to be understood, the model was deemed acceptable and used as a basis for relative comparisons.
One of the most significant lessons learned through the validation process was that more accurate downtime data is needed. A relative validation process was attempted and is presented in section 5.3.1, unfortunately this analysis was inconclusive because of the lack of accurate downtime information. Several shutdowns were witnessed on the shop floor, but Amazon never formally recorded these events. Missing data can destroy the potential of any validation exercise.
1.4 Major Findings
It should be noted that the findings presented in this report are preliminary and require further analysis in order to verify statistical significance. This is not to say that the general behavior of the system that was recognized is not valid, rather it simply requires further validation. Again, the intention of this report is to provide preliminary findings so that Amazon can make a more informed decision about next steps for this process.
1.4.1 Quantifying Picker Variability
In an attempt to capture the net impact of picker variability on ****, a simulation model was created that did not apply any variation to picker capacity. Instead, the model simply used a throttle to allow a fixed number of picks per hour (####) to enter the system. The results of this simulation run implied that roughly 40% of the average **** recorded on Dec. 10th 2003 (Avg. **** = #### min) was directly related to picker variability. Given that there are several other sources of variability in the real system such as release rate fluctuation and unrecorded downtime that are not captured by the simulation model, it is assumed that the actual percentage attributable to picker variability is less. It is hypothesized that slightly less is defined as 5-10%, however this requires further investigation and is beyond the scope of this paper. In either case, it is clear that picker variability plays a significant role in affecting **** performance.
1.4.2 "Singles" Tote Diversion
By observing the single pack area diversion point in Figure A -Appendix B, it is inherent in the physical system that all totes must pass through the 7 to 1 merge. Thus, the "What-If' question posed here is: "What would happen to the efficiency of the system if all "singles" totes were diverted before reaching the 7 to I merge?"
A simulation model scenario was run that eliminated all "singles" totes from the conveyors before the 7 to 1 merge. The model predicted that there was not a significant impact on the system. The slight change in performance that was recorded is primarily attributable to a change in the random number generation of Simul8.
This result makes intuitive sense simply due to the fact that "singles" totes in comparison to "multis" represent a much smaller percentage of the total number of totes in the system
(Singles ~##%, Multis -##%). This would imply that at the present volume of single order items in the Reno distribution center, the 7 to 1 merge is efficient and removing ''singles" is not going to provide a considerable increase in production.
1.4.3 Items per Tote Reduction
As Amazon's product mix continues to grow, the general trend is that product size is actually increasing in volume. For example, a toy or lamp is generally larger than a CD or book. This increase in product size has a direct impact on how many items can be placed into a tote. Therefore, the "what-if' question posed here is: "What happens to system performance if the number of items per tote for "singles" and "multis" continues to decline?" Two Simul8 scenarios were completed in order to test this theory. The first scenario had a 10% reduction in the mean items per tote and the second had a 20% reduction. The results are displayed below in Figure B.
Reduced Items per Tote Comparison Table
Dec. 10th Items per Tote Reduced Mean 10% Reduced Mean 20% Minutes Hours Minutes Hours Minutes Hours
Average 17.36 0.29 _ 16-62 0.28 14.66 0.24
Std Deviation # _# # # # I#
lAverage Pick (units/hour) # # #
induction
(Units/hour) # # #Figure B - Reduced Items per Tote Comparison Table
Observing the figure above, it is clear that as the number of items per tote declines, average **** also declines. With a 20% reduction in the mean number of items per tote in "singles" and "multis", average **** was reduced by approximately 15%. This
by the presence of additional totes. Of course, there is a point of diminishing returns where the congestion in the 7 to 1 merge could become the overriding factor. As a matter of fact, during the 20% reduction test, it was visually clear in the simulation that the merge did become congested and the induction lanes began starving for totes.
1.4.4 "7 to 1" Merge Observations
Throughout all of the simulation scenarios that were run for this project, only one proved to show that the 7 to 1 merge can become a bottleneck. As mentioned above, with a 20% reduction in the mean items per tote in both "singles" and "multis", the 7 to 1 merge did become relatively full and the induction lanes had a shortage of totes. This implies that in the real system, the 7 to 1 merge logic is relatively efficient and there are outside forces that are causing the merge to frequently become an issue.
There are several notions to be considered here. The first and most important is that there is downtime and manual manipulation of the merge in the real system that is not captured by the simulation model. For example, there is frequently downtime in Crisplant that is not formally recorded. If a sorting tray gets jammed and it takes the area manager four to five minutes to fix the problem, more often than not, this will not be documented. In addition, the operator at the routing sorter has the ability to manually prioritize lanes. Again, this is not recorded. These outside effects add up to a 7 to 1 merge that is plagued by secondary actions that can cause the accumulation of totes.
The key finding here is that the 7 to 1 merge logic is arguably efficient in the current system. This is not to say that improvements couldn't be made if a 50% photo eye was
added to the merges' scoring system. However, this type of augmentation would only be a true benefit after the outside effects on the merge have been corrected.
1.5 Next Steps for the Simulation Model
Lack of downtime information was the largest shortcoming of this analysis. It severely impacted the ability to perform relative validation testing. Therefore, the next step for this model is to collect accurate downtime data for multiple days in the facility. Once this data is collected, in can be input into Simul8 and a relative validation test can be
accurately performed.
One of the major findings in this report is that picker variability appears to be a significant contributor to average **** and standard deviation. Thus, the second step for this model should be to include dynamic picking logic on the front end. This will help to close the gap between predicted and actual results and allow for the true behavior of the system to be captured.
After dynamic picking is added, the model's average **** and standard deviation should increase to levels reflective of actual performance. This can help to improve the most difficult task for this project, which was model validation. The validation process requires an intimate knowledge of the system and unfortunately required many assumptions due to the lack of data available. More specifically, the **** data that Amazon provided was an average value for an eight-hour period and was not easily compared to the detailed histograms provided by Simul8 (See Figure C below). Thus, after dynamic picking is added to the model, Amazon should make an attempt to capture individual order data for an entire eight-hour period, create a **** histogram, and plot the
data to make comparisons with Simul8's output. This will provide a valuable tool that will improve the validation process and help to uncover the true behavior of the real
system.
Histogram -SimulS *** Time (3.5 Hour run) Downtime -Similar to Dec. 10th 2003 (Picking a #k/hr)
Average * 17.11 min Std Dev # # min 500 450 400 350 C. 200 150 100 50
C4
(minutes)
Figure C - Simul8 Output Table
Another area of improvement involves unrecorded downtime in the real system. A downtime study specifically for the 7 to 1 merge would be particularly useful. Again, the validation process is extremely difficult and adding more real data will help to simplify this task.
Lastly, before any results in this report are considered for implementation, statistical validation must be performed. All the results presented here are preliminary findings that require further statistical analysis in order to prove significance. Once the results are proved to be significant, implementation can be performed with confidence.
1.6 The Amazon Engineering Culture
The content in this report regarding culture is based on a seven-month interacting with the Seattle, WA based Amazon engineering department. presented here are my personal opinion and are focused primarily on engineering approach to implementing discrete event simulation.
THIS SECTION HAS BEEN REMOVED FOR PROPRIATRY REASONS! experience
The ideas Amazon's
Chapter 2: Introduction to System Simulation
A simulation is the imitation of the operation of a real-world system or process over time. An artificial history is generated and the observation of that history can be used to draw inferences concerning the operating characteristics of the real system.
A simulation model generally takes the form of a set of assumptions describing the operations of a real environment. These assumptions are expressed in mathematical, logical, and symbolic relationships between the entities in the system. Once a model has been developed and validated, it can be used to investigate a wide variety of "what if' questions about real world functionality. Simulation models can also be used to study a process in the design stage before it is actually built. Thus, simulation modeling can be used both as an analysis tool for existing operations, and as a design tool to predict the performance of new configurations under a variety of circumstances. As will be discussed later, Amazon's primary goal in creating the subject simulation was to evaluate the current system and provide guidance for their next generation facility.
2.1 Discrete-Event System Simulation
Discrete-event systems simulation is the modeling of systems in which the state variable changes only at a discrete set of points in time. The model is analyzed by numerical methods rather than analytical methods. Thus, discrete-event systems are run rather than solved. There are a number of computer software packages available on the market today that can be used to build complex systems: AutoMod, ProModel, Witness, Arena, etc. The software used to build the subject simulation for Amazon was created in Simul8.
Simul8 is a stand-alone windows based discrete event simulation package that sells for under $1500 from the Simul8 Corporation.
2.2 Simulation & Corporate Industry
Discrete Event Simulation was first introduced in the 1950s to study a range of business problems. The objectives were to improve efficiency and reduce costs. These business problems usually consisted of small number of variables followed by a limited number of paths from start to finish. With the advent of more affordable computer technology, the 1960s and 1970s were characterized by computer programs with output that generally consisted of a long list of numbers. By the 1980s, 2-D graphics were introduced that allowed for a visual representation of the actual system. Animation proved to be extremely useful in assessing and confirming the validity of the model. In the 1990s, simulation software gained 3-D capability and exceptional computational processing
power. 1
To enter the realm of discrete event simulation, a company needs to be prepared to make a significant financial investment. The firm is not only required to purchase software and hardware, but also to maintain an operator skilled in its use. The price of a "seat" has fallen in recent years, however is extremely sensitive to the capabilities desired. Software "seats" can range anywhere from free student versions to $30K+ packages. Today, discrete event simulation is used across many industries. It has historically been heavily implemented in manufacturing organizations, particularly automotive. Companies such as General Motors, Mack Trucks, and Ford Motor Company have all
used this technology to analyze and improve on their production environments. An abbreviated listing of some of these studies is outlined below 2:
A) General Motors - Simulated over twenty in-design and existing sub-assembly welding lines. Analyzed gross and net throughput.
B) Mack Trucks, Inc. - Simulated existing paint shop for various truck bodies. Developed a new software algorithm for re-sequencing.
C) Ford Motor Company - Simulated a manufacturing facility to solve fork-lift traffic congestion issues.
Discrete event simulation has also been used to help improve distribution center type operations. For example, a pharmaceutical distributor had outgrown their old facility and was in the process of designing their next generation fulfillment center 3. Similar to Amazon, there was an elaborate picking system and conveyors. The simulation was used to identify existing bottlenecks and help plan for the future. Without the simulation, the company could have potentially installed millions of dollars of sophisticated equipment, only to realize that the system could not perform at the desired level. Amazon is currently faced with a similar issue as they contemplate the design of their new state-of-the-art distribution center.
As mentioned above, the first step for all of these companies was to purchase a software tool. Once the tool is selected and a suitable goal has been chosen, an implementation plan needs to be constructed. The next section will detail a general implementation plan that can serve as a reasonable starting point for any simulation study.
2.3 Basic Steps in a Simulation Study
Figure 1 below shows the steps to guide a simulation model builder thorough a robust simulation study. Similar figures and discussion of steps can be found in other sources such as Nelson's guide to "Discrete-Event System Simulation" 4. The steps in Figure 1 are defined as follows:
1) Problem Formulation: Every study should begin with a statement of the problem. This problem can range from simply testing a set of assumptions about the
system to testing a totally new system configuration
2) Setting Objectives: The objectives should indicate what questions are going to be answered by the simulation. Deciding on this desired outcome will aid in designing the structure of the model. This is a critical step in the process because it will inevitably dictate the model's need for detail and complexity. This complexity should not exceed the requirements as posed by the objective.
3) Setting Scope and Overall Project Plan: Given that a list of objectives has been set, the scope of the project can be defined. The scope should only include details that are required to achieve the project's objectives. Given that this can be a difficult task because the primary variables that are driving the system are not always apparent, it is best to start with a simple model and build towards greater complexity. In addition, all assumptions going into the model should be clearly documented. This will serve as a formal record and better support the implementation phase at project completion.
4) Sketch the Layout on Paper: This is a good way to visualize all of the necessary inputs that are required to achieve the goals that have been set. It will serve as a guide throughout the project and aid to understand how the elements to be modeled interact with one another.
5) Data Collection: Once all of the necessary inputs have been identified, collection of the required data can begin. There will probably be a constant interplay between the construction of the model and the collection of necessary data. As the complexity of the model increases, the required data elements may also change.
6) Transfer Paper Layout to Software: Re-create the paper layout with a software package. Carefully label all entities to avoid confusion later on.
7) Validation: Validation is used to determine that the model is an accurate representation of the real system. Validation is usually achieved through calibrating the model, an iterative process of comparing the model to the actual system and using the discrepancies between the two to improve the model. Depending on the results, validation may prompt a step backwards to include a component in the model that may have previously been considered unnecessary.
Two of the key factors in having success with validation are choosing the appropriate metrics and knowing when you are results are within an acceptable range. Choosing the appropriate metric may be simple if there is an abundant amount of data available from the real system, however if this is not the case, it may be considerably more difficult to determine what are the appropriate measures for comparison. Once the metrics have been chosen, it must be decided how accurate the simulation output needs to be in order to declare success. Should the simulation output be within 10% or 30% of the real system? The answer is that it depends on the given system and whether or not the discrepancy between the simulation and the real system is acceptable and can be explained. Even if the model does not exactly match reality, it may excellent for relative comparisons.
8) Experimental Design: Now that the model has been validated, the objectives that were set in step #2 can be tested. An initialization period must also be
determined; this will allow the system to stabilize before any results are taken.
9) Documentation: There are basically two types of documentation: background data and program data. Background data includes any historical data that may have been used to drive the simulation. Program data includes a listing of the coding required to create the simulation program. This type of documentation will ensure
that the project can be passed on to another programmer with confidence.
10) Implementation: The success of implementation depends on how well the previous 9 steps have been performed. If the model and underlying assumptions cannot be properly communicated, implementation will probably suffer. A modeler must be prepared to properly defend the assumptions and data behind the model,
other wise it will be extremely difficult to justify any capital expenditures for implementation.
These points are to serve as a guide only, and will be manipulated by the modeler's own working methods. Problem Formulation Setting Objectives Exeraental
Sketch L out Data CoSictSon
Transfer Layout to Computer SofEXar1 No No Yes Experimental Design Documentation
Chapter 3: Introduction to Amazon.com
Founded in 1995 by Jeff Bezos, Amazon.com is one of the only Internet based firms that have survived the rise and fall of the Internet bubble. The goal at the company outset was to simply take advantage of the tremendous growth of the Internet and provide an alternative book buying method for consumers. After some initial success, the firm quickly added music and video to their product offering. Today, there are well over fifteen product groups including two new strategic partnerships with Toys 'R Us and Target. The product mix is not only growing in volume, but also changing in make-up.
This transformation has placed a consistently growing demand on all of Amazon's distribution centers.
Internet retailing provides customers with a new level of convenience that is not available elsewhere. Consumers can now shop from the comforts of their own home without having to travel to multiple store locations to find their desired item, often at a reduced price. However, if Amazon cannot provide those items in a timely fashion, consumers may opt to go to the local store to forego the aggravation of waiting for a late delivery. Therefore, it is critical that Amazon's operational effectiveness becomes part of the company's overall strategy to enhance the customer experience. There are presently five U.S. based distribution centers and four international. All of the distribution centers are unique and their capabilities range from fully manual to semi-automated.
3.1 Problem Statement
As stated previously, Amazon's product offering is growing in volume and changing in make-up. This change in make-up includes more toys, kitchen items, etc., and physically
larger items than what had been historically sold in the past. Because of this tremendous surge in growth, the demand placed on all of Amazon's DCs has increased significantly. More specifically, the semi-automated Fernley DC outside of Reno, NV is continually asked to increase productivity.
Everyone in the Reno operations group has their own opinion as to what should be changed in order to increase outbound throughput. Unfortunately, most of the recommendations are not easily tested without significant time and/or capital investment. In addition, improvements are primarily needed during peak operations in December. This would generally call for tests to be run during that same period. Unfortunately, because there is such a huge push to satisfy customer demand at this time, it is not
favorable to run tests that could possibly have a negative impact on production.
In order to test recommended scenarios to improve outbound flow without impacting production, it was decided that Amazon should build a discrete event simulation model. Once completed, the tool could be used to not only test different scenarios for Reno's outbound operations, but also for capacity planning for the next generation distribution center. Thus, the main goal of this project is to build a discrete event simulation of the Reno distribution center's outbound flow process. The solution should be modular and be able to test different "what-if' scenarios that are presented by the operations group.
The primary focus of the simulation should be to mimic peak demand conditions.
3.2 High Level Introduction
Amazon's Reno distribution center consists of approximately 1 million square feet. A large percentage of that space is dedicated to storing inventory. Among this inventory is
an elaborate conveyor system consisting of seven primary lanes. These lanes serve as the primary delivery mechanism to the automated sortation system called Crisplant that coordinates final order completion.
Figure A in Appendix A presents a physical layout of the Reno distribution center. This layout of the conveyor system should be used in conjunction with Figure B, which displays a snapshot of the final simulation model and its primary components. By observing these two figures, it should become clear that the simulation model was physically built to reflect the actual layout of the plant.
In Figure B, the primary steps of the discrete simulation are identified. Before diving into the simulation model and the Amazon specific logic, the remainder of this chapter will cover the project scope and briefly describe all of the steps in Figure B. This should provide a high level picture of the project, which will serve as a solid foundation for the
simulation specifics covered in Chapter 4.
3.3 Project Scope
Because of the relatively short time-line of the LFM internship, it was decided to limit the scope of the simulation study to outbound flow only (See Figure #2 Below) not including tasks downstream of Automatic Order Completion. More specifically, it should include the primary components of outbound flow from picking through order chute completion in Crisplant. Crisplant is the trade name for the automatic sortation system that re-assembles orders into specific chutes so that a packer can box an order and send it to shipping.
Stocked Manual Picking of Itemns Tote Drop-off Inventory tol& Batching into Totes &Conveyor Travel Thme
Manual 1temn Automnati Automatic Ord er Manual Order
Induction Sortation Comnpletion Packing
Box/Order Drop-off Shippng LabelApplication Conveyor
Conveyor Travel Timte & Box Taping Travel Time-* p
Figure #2 - General Amazon Outbound Flow Diagram
Again, the following 13 steps should be reviewed while simultaneously reflecting on Figure B - Appendix A. This will provide a high level overview of the primary components that were considered vital for the simulation to reflect reality. Each of these topics has been programmed into the simulation's logic and will be discussed in further detail in chapter #4.
3.3.1 Order Generation (Item #1 - Order Generation & PL Assignment)
Although not technically considered part of the outbound flow process, the simulation was required to generate customer orders at the start of the simulation. This included the number of items per order as well as the product make-up of that order. Product make-up meaning is the item a book or DVD, etc.
3.3.2 Pick Mod Assignment and Inventory Profile (Item #2 - Pick Mod Assignment) In order to accurately predict the volume of "totes" (open crates containing customer ordered items) traveling down each inlet conveyor, the simulation was required to have an actual inventory profile of the building. The inventory profile is used to determine
3.3.3 Picking Delay Times (Item #3 - Delay Times & Multi-Shipment Limiter)
When customer orders are released to the picking agents, there is a delay factor that is incorporated with each unit. The delay factor is provided to compensate for the difference in conveyor travel time and picker travel time associated with different areas of the building. The overall goal of the delay time is to theoretically have all of the units corresponding to a particular customer order arrive at the 7 to 1 merge in the system at exactly the same time. The simulation model includes a delay factor for all units and it corresponds to only conveyor travel time, not picker travel time or variability.
3.3.4 Multi-Shipment Limiter (Item #3 - Delay Times & Multi-Shipment Limiter) The multi-shipment limiter is an Amazon specific logic that limits the total number of open picks available to the picking agents at any given point in time. For example, on a typical high volume day, the shipment limiter is set to ####. This implies that #### customer multi-unit orders at any given point in time are being collected by picking
agents. A new customer order will not be released to the picking system until 1 of the #### orders is logged in as complete by one of the picking agent's electronic guns. Complete simply implies that the last required item of a particular order has been logged and placed into a tote. This logic has no impact on single order items.
3.3.5 Picking Capacity (Item #4 - Picking Capacity)
Picking is the beginning of the outbound process and involves a tremendous amount of variability. Due to the complex nature and incomplete data surrounding picking variability, no attempt was made to model this characteristic. Rather, a fixed labor throttle was used to simply limit the total numbers of picks available to the system.
3.3.6 Tote Make Up (Item #5 - Tote Make-Up)
In order to accurately account for the number of totes entering the system, the simulation uses historical data distributions to accurately predict the number of items in a tote. There are two specific distributions; one that covers multi-unit order totes and another that describes single-unit order totes.
3.3.7 Merge Logic for the 7 to 1 & 2 to 1 (Items #6 & #7 - Merge Logic)
There are two primary merges in the system that each has a specific scoring logic. Appendix B outlines this logic in detail. Because the both merges represents what is thought to be potential bottlenecks in the system, the simulation was programmed with the actual code.
3.3.8 **** - (Item #8
-The primary metric chosen for model validation is referred to as ****. **** is
considered a leading indicator for sorter operations and is recorded at a mid-point in the
system directly before tote prioritization is activated. The definition of **** has been
removed from this paper for proprietary reasons.
3.3.9 Induction Logic -Tote Controller & Induction (Item #9 - Induction Logic)
Amazon implements proprietary tote induction logic referred to as the Tote Controller. Due to the complexity of this dynamic tote scoring system (discussed in further detail in chapter 4), a "shortest queue" algorithm was adopted in the simulation model for all ten induction lanes.
3.3.10 Routing Sorter (Item #10 - Routing Sorter)
The routing sorter serves as a buffer in the system. It receives totes that fail to enter one of the 10 available induction lanes of Crisplant. Totes may pass all 10 lanes for several reasons, which are discussed further in Section 4.7.
3.3.11 Inductor Performance (Item #11 - Inductor Performance)
There are 10 induction stations that are manually operated. An inductor removes items one at a time from a tote, scans the item, and then places the item on an automatic belt that delivers it to one of the circulating sortation trays.
3.3.12 Automatic Sortation Trays (Item #12 - Sortation Trays)
There are ### available automatic sortation trays that are continually circulating through the Crisplant system. As mentioned previously, these trays receive individual items from the inductor and then deliver the items to the appropriate customer order chute. This will be discussed in further detail in Section 4.9.
3.3.13 Order Completion (Item #13)
There are currently #### chutes available to Crisplant in order to fill customer orders. Thus, a maximum of #### customer orders can be processed at any given point in time.
3.4 Model Validation & Primary Metric
Generation
Picking Capacity
Inventory / Pick Mods
VALIDATION
Sneo Dynmic
47317
Figure #3 - Model Validation (Input, Mid-Point, & Output)
Now that a high level overview of the model has been introduced, the primary metric used for model validation can be intelligently discussed. In addition to the primary metric ****, two other variables were considered for validation: the total number of picks entering the system (manual picking capacity) and the total number of items inducted out of the system (manual inductor output). See Figure #3 above.
It is the model's intention to capture all three of these variables. However, there is one shortcoming in the model that will negate the possibility of exactly replicating the real system: the lack of picker variability. Before this shortcoming is revisited, consider the fact that the model contains a picking throttle that will allow the appropriate number of units entering the system to closely reflect reality. In addition, a historical probability
inductor performance. Therefore, both the input (picking) and the output (induction) have the potential to closely mimic actual data. In contrast, because the model does not incorporate picking variability, it is anticipated that the magnitude and standard deviation of **** will be significantly underestimated. Picker variability includes things such as a picking agent stopping to get some water, taking a bathroom break, or anything that distracts him or her from the task at hand. The topic of picker variability will be discussed in further detail in sections 5.3 and 6.1.
Lastly, it should be noted that the simulation is attempting to mimic the conditions of peak demand. December the 10 th, 2003 represents the highest volume that the Reno DC has ever produced. Therefore, it was this day's attributes against which the simulation's results are compared (Approximately #### multi-units per hour, #### single-units per hour, Picking Capacity of #### per hour). Final validation results are reported in Section
Chapter 4: Amazon's Outbound Process & Simul8 Simulation Discussion
Most distribution center operations can be separated into inbound and outbound activities. Inbound generally involves the receiving of materials and the storing of those products. The storing of inventory is considered the final inbound operation. The process of retrieving items from inventory in order to fulfill customer orders is the beginning of the
outbound process. The last outbound operation is delivery to the customer.
Chapter four begins with a more detailed discussion of outbound flow and how the simulation was created to reflect these procedures. Although picking is technically the
first outbound operation, our discussion begins with Customer Order Generation.
4.1 Customer Order Generation
As mentioned in the high level overview, it was necessary to generate realistic customer orders for the simulation model. These customer orders need to incorporate two characteristics: total number of items & the product group assigned for each of those items.
4.1.1 Number of Items per Customer Order for "Multis"
The total number of items corresponding to a particular customer order is needed for three primary reasons. The first is that the total number of items in the system must be tracked and will drive the total number of totes required for delivery. The second reason
is because the primary metric **** requires this information. Again, **** is a metric
that records the window of time from when the first unit of a customer order arrives until the last unit arrives. Lastly, the number of items per customer order is needed because all
orders are re-assembled down-stream in the automatic sortation area. Thus, because chute completion time is dependent on all of the items corresponding to a particular order arriving, it is necessary to know how many items are in that order. In order to drive the simulation, historical data from December 2002 was used to create probability density function displayed below.
Estimated Probability Density Function -# of Units per Order
RNO Data - Peak 2002 (Multi-Unit Orders Only)
45.00% 40.00% 35.00%-30.00% 25.00% 20.00% 15.00% 10.00%-5.00% 0.00%
# of Units per Customer Order
Figure #4 - Number of Units per Customer Order
4.1.2 Product Group Assignment
The product group assigned to each unit of a customer order is required so that the simulation can make an educated decision (based on the actual inventory profile of the building) where a particular unit may originate. As discussed previously, an inventory
profile that includes a probability distribution associated with each product group will dictate the likelihood of a particular product group originating from a particular area of the building. The inventory profile will be described in detail in section 4.2.
Again, in order to drive the simulation, historical data from the week of December 2002 was used to create the probability density function below. Unfortunately, 2003 data was not yet available.
Estimated Sales % Breakdown by Product Line
RNO Data - Peak 2002 (Approximately 3 Million Unit Samples) 35.00% -30.00% -- -- - - - - 25.00%-20.00% 15.00% - - - -- - 5.00%
-Figure #5- Product Line Assignment
4.2 Stocked Inventory & December 10th, 2003 Inventory Profile
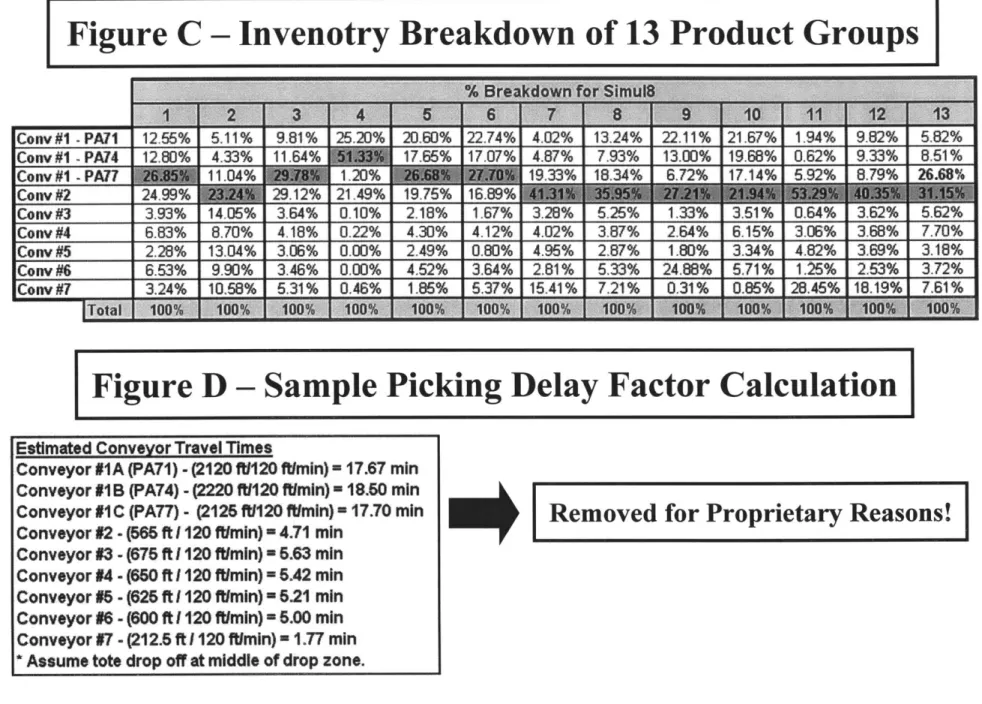
The Reno distribution center is broken down into several pick areas. Each of these pick areas has randomly stocked inventory that is unique in volume and make-up. To be more specific, it is possible that a particular pick area may be composed of 100% books, however these books are randomly assigned to bins and the same book may be found in several different locations. It is also possible that a given pick area can consist of any number of given product groups. There is a conveyor placed in each pick area so that items can be placed into totes and sent through the system. There are a total of 9 inlet conveyors which each correspond to a particular area of the building. (See Appendix A -Figure A)
For the purposes of the simulation model, thirteen major product groups were chosen. In reality, there is more than that; however the remaining group's frequency and volume are low enough that they were deemed unnecessary for simulation purposes. Just a few of the thirteen product groups considered were the following: Lawn, Video, Electronics, Music, Software, Books, Target, Video-DVD, and Video Games.
A live inventory profile or snapshot of the Reno facility was performed during the week of December the 10 th, 2003. It was decided that this week was an excellent representation of what the inventory profile reflects during peak demand. By observing Appendix A - Figure C, the results of this analysis are displayed. The percentage in the table is the fraction of that particular product group's total inventory represented by that particular pick area of the building. More specifically, a conveyor is associated with each pick area and we have determined the total percentage of each product group represented by each inlet conveyor. Because the volume of inventory is reflective of the demand for that product, the simulation makes the assumption that this percentage actually represents the probability that a unit comes from that particular pick area/conveyor. For example, if a Baby product is part of a customer order we assume that there is a 26.85% chance that it will originate from Conveyor #1 - PA77.
4.3 Manual Picking of Customer Ordered Items
At the beginning of every shift, a number of picking agents are assigned to each pick area of the building. As the shift progresses, the number of pick agents and their density is dependent upon demand for that point in time. These picking agents carry a hand held electronic device that dictates when and where to go next in collecting customer ordered
units. There is internal Amazon picking software that controls the pick path and priority, however this logic is beyond the scope of this report and was not included in the simulation. As mentioned earlier, the simulation model allows for a fixed number of picks per hour (##K based on Dec.10th 2003) to be processed in the system and does not react to changing demand. To summarize the actual Amazon logic, it attempts to minimize the pick path and maximize picker efficiency. This means more often than not, that the items in a particular tote will not correspond to the same customer order. A customer order may have units corresponding to different areas of the building and could be dispersed among several totes traveling down several different conveyors. These items will eventually be re-assembled relative to the customer order number downstream in Automatic Sortation, which will be discussed shortly in Section 4.9.
4.3.1 Picking Delay Factors
Another topic that needs to be introduced is the notion of picking delay factors. As previously mentioned a customer's order may be coming from different areas of the building and occupy several different totes. By observing the plant layout in Appendix A, it is clear that there are different conveyor lengths and thus different travel times associated with totes depending upon which conveyor they originate from. Because of this inherent physical difference, a delay factor is placed on units depending on the subsequent travel time required to reach the 7 to 1 merge. In other words, a picking agent's electronic gun in one area of the building may receive a request for an item to be picked first because he or she is in an area that is associated with a longer conveyor travel time. It is the intention of this delay factor to ensure that all units associated with a
particular customer's order will arrive at the 7 to 1 merge theoretically at the same time. In reality, this does not work very well because of the many sources of variability in the system. Amazon is still learning about these sources of picker variability and adjusts the delay factors almost monthly. The reason why there is so much attention placed on this logic is because it has a direct impact on how long a "chute" is open in the automatic sortation area is discussed in section 4.9.
In order to simplify the building of the simulation model, live picking, picking variability and the Amazon picking software was not modeled. Instead, a picking throttle was used to simply limit the total number of picks that were available per hour (####). In addition, a perfect delay factor was implemented. It is perfect because picker variability has not been included and conveyor lengths and speeds are fixed. Due to these facts, it was expected that there would be a significant difference between the results of the simulation and reality. However, this was actually planned so that the aggregate amount of picker variability in the system could be evaluated. Please visit Appendix A - Figure D for a sample delay factor calculation.
4.3.2 Multi-Shipment Limiter
The Multi-Shipment limiter has a direct impact on the manual picking process. The purpose of the shipment limiter is to limit the total number of open multi-unit orders currently being picked throughout the building. An open order refers to an order for which all of the required items have not yet been placed into a tote and logged into the system by the picking agents. For example, if the multi-shipment limiter is set to one, then only one multi-shipment order will be picked at a time. Thus, until that one order
has been fully picked by the picking agents and logged into the system, no additional orders will enter the system. This logic does not affect single unit customer orders, only multi-unit orders. The volume of the single unit orders does not currently require the use of a shipment limiter.
In reality, the operators of the automatic sortation system will vary the shipment limiter throughout the day. Sometimes it might change from as little as #### to as high as ####. However, the average value for the peak day (Dec. 1 0th, 2003) that the simulation is attempting to replicate was approximately #### orders. The simulation model does not attempt to model the variability and uses this average value for all runs.
4.4 Batching Items into Totes
The picking agents have one of two carrying devices for their collection of totes. They either have a small manual cart or ride in what is referred to as an automatic "walkie pallet truck". The picker will fill a tote with as many units as possible up to a limit of approximately 20 lbs. for safety reasons. Once a tote is full, the picker can make a choice to either immediately go to the nearest conveyor and drop it off, or to simply add it to their cart and keep accumulating totes until they come to the next conveyor. This notion of a picker's choice is a perfect example of picker variability that the simulation model does not attempt to capture. However, what the model does capture is the historical data for the number of items that are batched into totes. Data was collected from December of 2002 and the results of this analysis can be found below in Figure #6 & #7. These plots are probability density functions that reflect the number of items in a tote depending upon whether it is a multi-unit or single-unit tote.
Estimated Probability Density Function - # of Units per Tote RNO Multi Unit Orders -Peak 2002'
20.00% 18.00% 16.00% 14.00% 12.00% 10.00% 8.00% 6.00% 4.00% 2.00% 0.00%
Figure #6 - Multi Unit Order Tote (# of Units per tote)
Estimated Probability Density Function - # of Units per Tote
RNO Sinale Unit Orders - Peak 2002'
I
Items per tote (Singles)
I
Figure #7 - Single Unit Order Tote (# of Units per Tote)
It should also be noted that the Amazon picking software will separate single unit orders from multi-unit orders. In other words, single unit customer orders are not mixed with multi-unit customer orders in the same picking agent's tote. The primary reason for this
L
Items per tote (Multis)
25.00% 22.50% 20.00% 17.50% C 15.00% 12.50% 0 00% 7.50% 5.00% 5.00% I
is because single unit orders are processed in a designating area equipped to more efficiently package these items. Multi-unit orders are processed through the Crisplant automatic sortation area discussed shortly. The simulation mimics this behavior and does not mix "singles" and "multis" in the same tote.
4.5 Tote Drop-off & 7 to 1 Merge Point
As discussed above, once a picking agent has filled a tote with customer ordered items, the tote is eventually "dropped-off' onto the nearest conveyor. As mentioned above, in the Reno DC there are 9 possible inlet points to the system. Each conveyor eventually leads to a primary point in the system called the 7 to 1 Merge. Again, please reference figures A & B in appendix A for clarification. This 7 to 1 merge point is the primary location used to drive the picking delay factors that were discussed previously.
The 7 to 1 merge is frequently debated among the operations group. There are those that consider the 7 to 1 merge a primary bottleneck in the system and others that believe it may not be a major factor. Whatever the case may be, it is hoped that the simulation will shed some light on this issue. There is a specific logic to the merge that is basically a point system that scores each lane depending on how long it has been idle. The overall goal of the point system is to minimize the time between releases for all lanes. A detailed explanation of how the point system functions can be found in Appendix B. The simulation mimics this point system and provides an output table that can be used for verification purposes.