HAL Id: hal-02306475
https://hal.archives-ouvertes.fr/hal-02306475
Submitted on 5 Oct 2019HAL is a multi-disciplinary open access archive for the deposit and dissemination of sci-entific research documents, whether they are pub-lished or not. The documents may come from teaching and research institutions in France or abroad, or from public or private research centers.
L’archive ouverte pluridisciplinaire HAL, est destinée au dépôt et à la diffusion de documents scientifiques de niveau recherche, publiés ou non, émanant des établissements d’enseignement et de recherche français ou étrangers, des laboratoires publics ou privés.
Is sweep-flocculation relevant to saponite aggregation?
Bruno Lartiges, Valérie Chaignon, Laurent Michot, Jean-Louis Robert
To cite this version:
Bruno Lartiges, Valérie Chaignon, Laurent Michot, Jean-Louis Robert. Is sweep-flocculation rel-evant to saponite aggregation?. Water Science and Technology, IWA Publishing, 1998, 38 (6), �10.1016/S0273-1223(98)00592-7�. �hal-02306475�
IS
SWEEP-FLOCCULATION
RELEVANT
TO
SAPONITE
AGGREGATION ?
Bruno S. LARTIGES1* - Valérie CHAIGNON1 - Laurent J. MICHOT1 - Jean-Louis
ROBERT2
1 Laboratoire Environnement et Minéralurgie - ENSG-CNRS, Rue du Doyen M. Roubault - BP 40 F-54501 Vandœuvre Cedex, FRANCE.
2 CRSCM-CNRS, 1A Rue de la Ferollerie - F-45071 Orléans Cedex 02, FRANCE.
ABSTRACT
Synthetic saponites with various Cationic Exchange Capacities were aggregated at pH 8.0 in a stirred vessel by hydrolyzed aluminum species. Floc growth was followed by Fraunhoffer laser diffraction and the efficiency of clarification was assessed from conventional residual turbidity and sediment volume measurements. We show that the aggregation mechanisms are layer-charge dependent and can not be described by the widely accepted sweep flocculation model.
KEYWORDS
Aggregation; Sweep-flocculation; Saponite; Hydrolyzed aluminum; Fraunhoffer diffraction.
INTRODUCTION
Aggregation with a metal hydrolysing coagulant represents a crucial step in the purification of surface waters. During this stage, colloidal substances which impart colour and turbidity to the raw water, are removed through the formation of settleable aggregates. Two main mechanisms are usually invoked to explain aggregation by hydrolysing coagulants: at acidic pH, the negatively charged natural particles are neutralized with positively charged coagulant hydrolyzed species, whereas at basic pH and at much higher coagulant dosages, the colloidal material is enmeshed in a metal hydroxide precipitate (Dentel, 1988; Amirtharajah and Mills, 1982).
The charge neutralization mechanism is characterized by three main features : 1) destabilized particles attain a zero zeta potential at optimal dosage 2) restabilization may occur with excess coagulant and 3) optimal dosage is linearly dependent on colloid concentration (Stumm and O'Melia, 1968). On the other hand, the enmeshment or sweep-flocculation mechanism supposedly describes domains where abundant precipitation of hydrolysable coagulant occurs, and in that case, the optimal dosage is reported to be independent of the nature of suspended colloidal material (Packham, 1965). This mechanism seems to correctly reflect the
appearance of aggregates formed at basic pH for high coagulant dosage. However, recent Nuclear Magnetic Resonance and Small Angle X-ray Scattering investigations have shown that coagulant species formed during hydrolysis can be identified as individual fractal polymers (Bottero et al., 1990). The question of coagulant species-colloidal particles attachment, overlooked in the sweep-flocculation model, should then be
raised. Indeed, for silica particles aggregated with an aluminum-based coagulant, 27Al NMR revealed that
hydrolyzed aluminum species react with the silica surface to form tetrahedrally coordinated aluminosilicate sites at both acidic and basic pHs. These sites act as anchors for the coagulant species, strongly suggesting that an aggregation mechanism analogous to polymer bridging could be put forward to explain the formation of aggregates (Lartiges et al. 1997).
In the case of natural soils with varying cationic exchange capacities (CEC), Langelier and his group (Langelier et al., 1949; Kim et al., 1965) showed that at basic pH, the CEC was strongly related to the optimal coagulant dosage. This further indicates that the sweep flocculation mechanism can not be applied to all the situations where it is usually invoked. In order to get more definite data about enmeshment, we decided to study in detail the aggregation characteristics of a series of synthetic smectites with variable layer charge. The experimental conditions (pH and coagulant concentration) were selected for investigating domains in which aggregation is commonly thought to proceed through sweep-flocculation. Fraunhoffer laser diffraction was chosen as the main experimental technique as it also yields information about aggregation kinetics and floc structure (Lartiges et al, 1996).
EXPERIMENTAL SECTION
The synthetic saponites used in this study were obtained by hydrothermal synthesis: gels prepared by coprecipitation of appropriate quantities of Na, Mg, Al and Si hydroxides at pH 14 were dried at 200 °C and calcined at 600 °C for 24 h. The calcined products were then ground and placed in a vessel at 400 °C under a 1000 bar water pressure for 4 weeks (Bergaoui et al. 1995). The structural formula of the synthetic saponites
is Nax(Si4-xAlx)(Mg3)O10(OH)2 with 0.35 ≤ x ≤ 1.0. The cationic exchange capacity of saponites was
determined from cobaltihexamine ion exchange measurements (Remy and Orsini, 1976).
Clay suspensions were prepared by adding 80 mg of synthetic saponite to 1 liter of deionised water. NaHCO3
(300 mg) and NaCl (58 mg) were also included to provide a carbonate alkalinity comparable to that of natural waters. Results obtained with saponites having x values of 0.45, 0.55, 0.60, 0.70 and 0.75 are reported in this paper. The surface area and water adsorption characteristics of these three samples show similar trends (Michot et al, 1998) which suggests that the shape of elemental layers is not strongly dependent on the charge.
The coagulant solution was obtained by hydrolysing aluminium chloride with dropwise addition of 1 M sodium hydroxide to a molar ratio OH/Al equal to 2.46 (pH = 4.5) and a final aluminum concentration of 0.1 mol/l (Bottero et al. 1980). Previous studies have shown that an hydrolysis ratio of 2.46 yields a coagulant
solution with about as much isolated Al13 polycations as Al13 aggregates with a fractal dimension of 1.4
(Bottero et al. 1990). This aluminum stock solution is very stable (Furrer et al. 1992), and the same coagulant solution was used throughout this study.
Mixing of coagulant and clay suspension was conducted in a 1 liter baffled reactor of known power dissipation characteristics (Lartiges et al. 1997). The pH of the suspension was first adjusted to pH 8.0 with diluted HCl, and a certain amount of coagulant solution was then added under constant agitation with a syringe. A small decrease in pH was observed upon addition of the coagulant. However, the pH was not readjusted to its initial value, as this decrease was significant (~ 0.5 pH unit) only for aluminum
concentrations in the 10-3 mol/l range. The stirring rate was fixed at 100 rpm (mean velocity gradient = 140
s-1) for all the flocculation tests.
The size distribution of flocs was measured on-line in the range 1.2 - 600 µm with a Malvern Mastersizer using Fraunhoffer diffraction. A peristaltic pump placed after the optical cell was used to pass the flocculated suspension through the analyser beam (pumping rate = 30 ml/min). Size measurements were averaged over 1 s and taken every 1.53 s to allow for a complete renewal of the aggregates present in the optical cell. Results are volume based and are represented as the percentage of suspended floc volume versus the sphere diameter of equivalent volume.
Figure 1a presents the time evolution of aggregate size distribution during floc growth for saponite 0.6
flocculated with an aluminum concentration of 0.2 10-4 mol/l. The distributions are all similar in shape and
bear a slight skewness toward the smaller aggregate sizes. It can be shown that these size distribution curves
superimpose when the x-axis is normalized by the mean floc diameter D50. Therefore, the temporal evolution
of D50 can be used to characterize aggregation dynamics (figure 1b). Different parameters can be determined
from the D50 versus time curve. As the mean diameter increases linearly during floc growth, an aggregation
rate can be calculated from the slope of the curve. Dmax designates the maximum diameter reached. A
lag-time corresponding to the period during which flocculation can not be detected with the laser sizer, and a break-up rate associated with the decrease in floc size can also be calculated but will not be discussed in this paper. 1.0 10.0 100.0 1000.0 0 20 Aggregate Diameter (µm) 10 18 s 32 s 61 s 75 s86 s 107 s 175 s Floc volume (%) (1a) 0 20 40 60 80 100 0 200 400 600 800 1000
Mean Floc Diameter D50 (µm)
Aggregation time (s)
D50 max
Aggregation rate
lag-time
(1b)
Figure 1: Saponite 0.6 - [Al] = 0.2 10-4 mol/l a) Volume distributions of saponite aggregates during floc growth. b) Temporal evolution of the mean floc diameter D50.
At the end of the aggregation period (20 to 40 minutes), the flocculated suspension was transferred to an Imhoff cone. Residual turbidity (Hach Ratio/XR turbidimeter), pH and sediment volume were measured after settling times of 30 minutes and 24 hours. The sediment was then collected and freeze-dried for determining
the d001 spacing of flocculated saponites by X-ray diffraction (Jobin-Yvon 60 diffractometer using Co Kα
radiation).
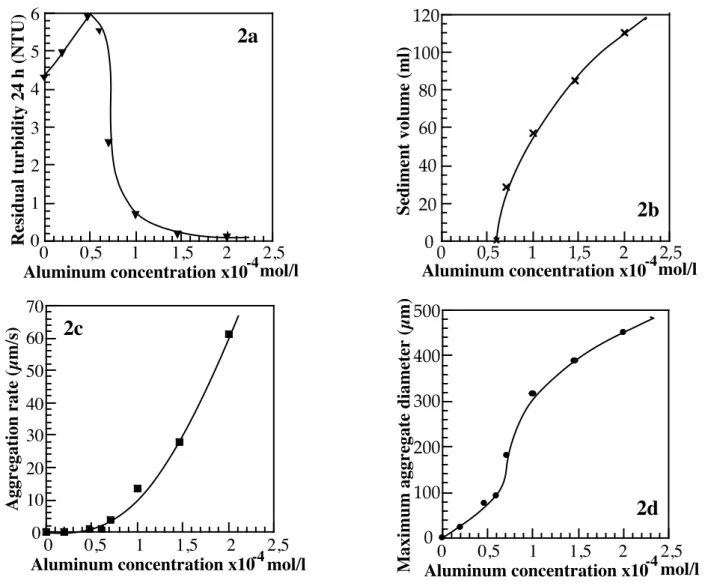
Figure 2 presents, in the case of saponite 0.45, the evolution with coagulant concentration of a) the residual turbidity after 24 hours settling; b) the sediment volume after 24 hours settling; c) the aggregation rate; d) the maximal mean diameter of the flocs. The turbidity curve (Figure 2a) displays a classical behaviour as it
increases for low aluminum concentrations, reaches a maximum for a concentration of 0.5 10-4 mol/l, and
then decreases to 0.1 NTU for Al concentrations ≥ 1.5 10-4 mol/l. As shown by the evolution of sediment
volume (Figure 2b), the turbidity decrease is directly related to the formation of increasing amounts of settleable aggregates. This change in the settling behaviour of aggregates also corresponds to a sharp increase in aggregation rate (Figure 2c) and floc size (Figure 2d).
0 1 2 3 4 5 6 0 0,5 1 1,5 2 2,5
Residual turbidity 24 h (NTU)
-4
Aluminum concentration x10 mol/l
2a
0 20 40 60 80 100 120 0 0,5 1 1,5 2 2,5 Sediment volume (ml) -4Aluminum concentration x10 mol/l
2b
0 10 20 30 40 50 60 70 0 0,5 1 1,5 2 2,5 Aggregation rate (µm/s) -4 Aluminum concentration x10 mol/l2c
0 100 200 300 400 500 0 0,5 1 1,5 2 2,5Maximum aggregate diameter (µm) Aluminum concentration x10 mol/l-4
2d
Figure 2 : Evolution of various aggregation characteristics with aluminum dosage for saponite 0.45 : a) Residual turbidity after 24 hours; b) Sediment volume after 24 hours; c) Aggregation rate; d) Maximum aggregate mean diameter.
Figure 3 presents the same curves obtained for saponite 0.6. The residual turbidity (Figure 3a) decreases as
soon as some coagulant is introduced in the system. For Al concentrations between 2 10-5 mol/l and 10-4
mol/l, the turbidity remains constant whereas it decreases again for higher coagulant concentrations and
reaches 0.1 NTU for Al concentration around 10-3 mol/l. This evolution, which is inverse to the variations in
sediment volume (Figure 3b), is very unusual. In parallel, the patterns observed for the evolution of aggregation rate and maximum aggregate diameter also exhibit accidents in the same concentration range.
For low Al concentrations (≤ 9 10-5 mol/l), the decrease of turbidity is correlated to an increase in both
the two clays is qualitative only, as the values of aggregation rates of saponite 0.6 are lower by an order of
magnitude than the values determined for saponite 0.45. Around 10-4 mol/l, both the aggregation rate and
maximum diameter display a sharp decrease, which corresponds to the end of the plateau of residual trubidity. Further increase in coagulant concentration is associated with a second increase in aggregation
characteristics. For the highest Al concentrations used (≈ 10-3 mol/l), the aggregation rate decreases again to
very low values (0.1µm/s) whereas the diameters remain nearly constant around 100µm.
0,1 1 10
0,1 1 10
Residual turbidity 24 h (NTU)
-4
Aluminum concentration x10 mol/l
3a
0 10 20 30 40 50 60 0,01 0,1 1 10 Sediment volume (ml) -4 Aluminum concentration x10 mol/l3b
0 0,2 0,4 0,6 0,8 1 1,2 1,4 0,1 1 10 Aggregation rate (µm/s) -4Aluminum concentration x10 mol/l
3c
0 20 40 60 80 100 120 0,1 1 10Maximum aggregate diameter (µm) Aluminum concentration x10 mol/l-4
3d
Figure 3 : Evolution of various aggregation characteristics with aluminum dosage for saponite 0.60 : a) Residual turbidity after 24 hours; b) Sediment volume after 24 hours; c) Aggregation rate; d) Maximum aggregate mean diameter.
The curves obtained with saponite 0.75 (not shown here) exhibit very similar patterns to those observed with saponite 0.6.
DISCUSSION
The strong differences in aggregation behaviour observed for two saponites with different layer charge show unambiguously that enmeshment can not account for the aggregation of these clay particles. Indeed, if sweep-flocculation was the driving mechanism, similar aggregation characteristics should be obtained for both saponites and in particular, aggregate size should be controlled by aluminum concentration.
Furthermore, in blank experiments carried out with hydrolyzed aluminum alone, the aggregation parameters measured are drastically different from those calculated in the presence of clays. For instance, an aluminum
concentration of 2 10-4 yields an aggregation rate of 0.6 µm/s in the absence of clay, whereas this value
reaches 60 µm/s in the presence of saponite 0.45.
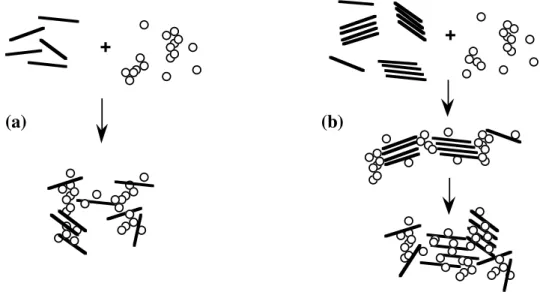
The peculiar patterns observed for saponite 0.6 could be due to changes in the organization of clay particles with varying coagulant concentration. For highly tetrahedrally charged smectites, the layers might not be completely individualized in suspension, forming stacks referred to as tactoids, whereas clays with lower layer charge should yield smaller tactoids or even single layers. This leads us to propose a tentative scheme describing saponite aggregation (figure 4).
+ +
(a) (b)
Figure 4 : Schematic representation of the aggregation of saponite by hydrolyzed aluminum species . (a) Saponite 0.45; (b) Saponite 0.60.
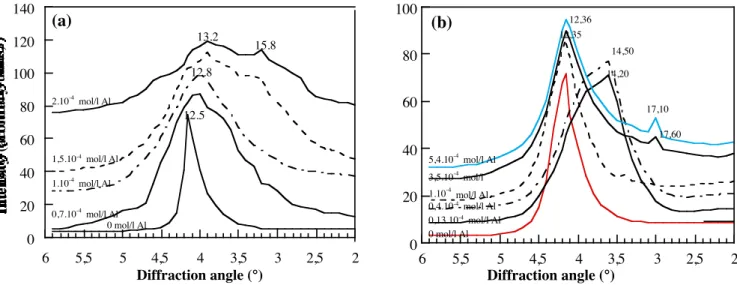
For saponite 0.45 (figure 4a), individual layers would then be aggregated by the coagulant species. On the other hand, for saponite 0.6 (figure 4b), aggregation at low aluminum dosage would proceed by sticking tactoids together; clay-coagulant interaction would then induce a reorganization provoking an increase in the number of particles to be aggregated and consequently, a decrease of both aggregation rate and maximum aggregate diameter. The driving force for this reorganization is yet to be elucidated. This scheme is partially confirmed by X-ray diffraction spectra shown in figure 5. The spectra corresponding to saponite 0.45 (figure 5a) display a continuous increase in interlayer distance associated with a broadening of this peak for increasing Al concentration. It reveals that more and more coagulant species are accomodated within the clay layers. Figure 5b shows a more complex situation. Indeed, low concentrations of coagulant result in the appearance of a double peak corresponding to distances of 12.3 and 14.5 Å. For higher aluminum dosages, the peak at 14.5 Å vanishes while a new peak (distance ~ 17 Å) grows. This latter distance is characteristic of
0 20 40 60 80 100 120 140 2 2,5 3 3,5 4 4,5 5 5,5 6 Diffraction angle (°) 12.5 12.8 13.2 15.8 2.10-4 mol/l Al 1,5.10-4 mol/l Al 1.10-4 mol/l Al 0,7.10-4 mol/l Al 0 mol/l Al Intensity (arbitrary units) (a) 0 20 40 60 80 100 2 2,5 3 3,5 4 4,5 5 5,5 6 Diffraction angle (°) 0 mol/l Al 0,13.10-4 mol/l Al 0,4.10-4 mol/l Al 1.10-4 mol/l Al 3,5.10-4 mol/l 5,4.10-4 mol/l Al 14,50 12,35 12,36 14,20 17,10 17,60 (b)
Figure 5 : X-ray diffraction patterns of freeze-dried saponite sediments obtained after aggregation with increasing aluminum dosages. (a) Saponite 0.45; (b) Saponite 0.60.
CONCLUDING REMARKS
The primary goal of our paper was to demonstrate that the enmeshment mechanism can not be applied to all the situations where it is usually invoked. The various results obtained agree with that statement. It can be definitely enforced by plotting the optimal dosage (defined as the quantity of coagulant to be used for achieving 80% clarification after 30 minutes settling) as a function of the experimental CEC (figure 6). The linear relationship obtained shows that the nature of colloids has a strong influence on the floculant dosage even at basic pH. 0 2 4 6 8 10 0.4 0.45 0.5 0.55 0.6 0.65 0.7 0.75 0.8 O p ti m al c oa g u la n t d os ag e (x 10 -4 ml)
Layer charge per half-unit cell
This preliminary study on the aggregation of saponite clays reveal rather complex mechanisms as different behaviours are observed depending on the layer charge. Most natural waters are essentially suspensions of colloidal clay particles with natural organic matter (NOM). Hence, a thorough understanding of the mechanisms involved in the aggregation of clay minerals in the presence of NOM is needed. We intend to pursue this work by investigating in detail the influence of layer charge, charge localization, pH, and nature and amount of NOM, on the flocculation behaviour of clay minerals. Experimental techniques such as Small Angle X-ray Scattering will also be used to obtain information about aggregates structure.
REFERENCES
Amirtharajah A., Mills K.M. (1982) Rapid-Mix design for mechanisms of alum coagulation. J.A.W.W.A.
74, 210-216.
Bergaoui L., Lambert J.F., Vicente-Rodriguez M.A., Michot L.J., Villiéras F. (1995) Porosity of synthetic
saponites with variable layer charge pillared by Al13 polycations. Langmuir, 11, 2849-2852.
Bottero J.Y., Cases J.M., Fiessinger F., Poirier J.E. (1980) Studies of hydrolyzed aluminum chloride solutions. 1. Nature of aluminum species and composition of aqueous solutions. J. Phys. Chem.,
84, 2933-2939.
Bottero J.Y., Tchoubar D., Axelos M.A.V, Quienne P., Fiessinger F. (1990) Flocculation of silica colloids with hydroxy aluminum polycations. Relation between floc structure and aggregation mechanisms. Langmuir, 6, 596-602.
Dentel S.K. (1988) Application of the precipitation-charge neutralization model of coagulation. Environ. Sci. Technol. 22, 825-832.
Furrer R.G., Ludwig C., Schindler P.W. (1992) On the chemistry of the Keggin Al13 Polymer. I. Acid base
properties. J. Colloid Interface Sci., 149, 56-67.
Kim W., Ludwig H.F., Bishop W.D. (1965) Cation Exchange Capacity and pH in the coagulation process. J.A.W.W.A., 57, 327-348.
Langelier W.F., Ludwig H.F. (1949) Mechanism of flocculation in the clarification of turbid waters. J.A.W.W.A., 41, 163-181.
Lartiges B.S., Derrendinger L.S., Bottero J.Y., Democrate C., Coupel J.F., Budka A. (1996) Floc size distribution measurements: a physically sound method for scaling up flocculation performance. in Chemical Water and Wastewater Treatment IV, 41-48. H.H.Hahn, E. Hoffmann, H. Odegaard Editors, Springer.
Lartiges B.S., Bottero J.Y., Derrendinger L.S., Humbert B., Tekely P., Suty H. (1997) Flocculation of
colloidal silica with hydrolysed aluminum: an 27Al solid state NMR investigation. Langmuir, 13,
147-152.
Michot L.J., Villiéras F., Robert J.L. (1998) Manuscript in preparation.
Packham R.F. (1965) Some studies of the coagulation of dispersed clays with hydrolyzing salts. J. Colloid Sci., 20, 81-92.
Rémy J.C., Orsini L. (1976) Utilisation du chlorure de cobaltihexamine pour la détermination simultanée de la capacité d'échange et des bases échangeables des sols. Science du Sol, 4, 269-275.