HAL Id: hal-02325611
https://hal.archives-ouvertes.fr/hal-02325611
Submitted on 22 Oct 2019HAL is a multi-disciplinary open access archive for the deposit and dissemination of sci-entific research documents, whether they are pub-lished or not. The documents may come from teaching and research institutions in France or abroad, or from public or private research centers.
L’archive ouverte pluridisciplinaire HAL, est destinée au dépôt et à la diffusion de documents scientifiques de niveau recherche, publiés ou non, émanant des établissements d’enseignement et de recherche français ou étrangers, des laboratoires publics ou privés.
Nanohybrids with magnetic and persistent luminescence
properties for cell labelling, tracking, in vivo real-time
imaging and magnetic vectorization
E Teston, T Maldiney, I Marangon, J Volatron, Y. Lalatonne, L. Motte, C
Boisson-Vidal, G. Autret, O Clément, D. Scherman, et al.
To cite this version:
E Teston, T Maldiney, I Marangon, J Volatron, Y. Lalatonne, et al.. Nanohybrids with magnetic and persistent luminescence properties for cell labelling, tracking, in vivo real-time imaging and magnetic vectorization. Small, Wiley-VCH Verlag, 2018. �hal-02325611�
Nanohybrids with magnetic and persistent luminescence properties for cell labelling,
tracking, in vivo real-time imaging and magnetic vectorization
E. Teston, T. Maldiney, I. Marangon, J. Volatron, Y. Lalatonne, L. Motte, C. Boisson-Vidal,
G. Autret, O. Clément, D. Scherman, F. Gazeau, C. Richard
Dr E. Teston, Dr. T. Maldiney, Prof. D. Scherman, Dr. C. Richard, Unité des Technologies
Chimiques et Biologiques pour la Santé (UTCBS), UMR 8258 CNRS, U 1022 Inserm,
Faculté de Pharmacie de Paris, F-75270 cedex France, Chimie Paristech, Paris F-75231 cedex
France. cyrille.richard@parisdescartes.fr
Dr. I. Marangon, J. Volatron, Dr. F. Gazeau, Laboratoire Matière et Systèmes Complexes
(MSC), UMR 7057 CNRS, Université Paris Diderot, Paris 75205 cedex, France
Dr. Y. Lalatonne, Prof. L. Motte, Laboratoire de Chimie, Structures, Propriétés de
Biomatériaux et d'Agents Thérapeutiques (CSPBAT), UMR 7244 CNRS, Université Paris,
Bobigny, 93017, France,
Dr C. Boisson-Vidal, Unité mixte de recherche 1140 - Thérapeutiques innovantes en
hémostase, Faculté de Pharmacie de Paris, F-75270 cedex France,
Dr. G. Autret, Prof. O. Clément, Laboratoire de Recherche en Imagerie, EA 4062, Inserm U
970 ou 494, Equipe 2, PARCC, Université Paris Descartes, Hôpital Européen George
Abstract:
Once injected into a living organism, cells diffuse or migrate around the initial injection point
and become impossible to be visualized and tracked in vivo. The present work concerns the
development of a new technique for therapeutic cell labelling and subsequent in vivo
visualisation and magnetic retention. We hypothesized and subsequently demonstrated that
nanohybrids made of persistent luminescence nanoparticles (PLNPs) and ultrasmall
superparamagnetic iron oxide nanoparticles (USPIOs) incorporated into a silica matrix can be
used as an effective nanoplatform to label therapeutic cells in a non-toxic way in order to
dynamically track them in real-time in vitro and in living mouse. As a proof-of-concept, we
have shown that once injected, these labelled cells could be visualized and attracted in vivo
using a magnet. This first step suggests that our nanohybrids represent efficient
multifunctional nanoprobes for further imaging guided cell therapies development.
1) Introduction
In recent years, cells have shown great potential in a number of biomedical applications and
researches in this area received much attention.[1] Cell therapies using mesenchymal stem
cells (MSC) or endothelial progenitor cells (EPC) have demonstrated significant potential for
the treatment and cure of several diseases such as cancer, diabetes, neurodegenerative or
cardiovascular diseases[2-4] and also for regeneration in peripheral arterial disease (PAD) in
both animal and human studies.[5-6]
Most current preclinical and clinical cell therapy trials consist of local or systemic delivery of
injury.[7] However, determining the fate and localization of these cells inside the body, as well
as targeting the cells to a particular location, are still major challenges. To address these
concerns, several methods have been developed to label therapeutic cells ex vivo in order to
monitor their fate after in vivo administration. Among the different available modalities,
X-ray computed tomography (CT),[8] magnetic resonance imaging (MRI),[9] positron emission
tomography (PET)[10] and single photon emission computed tomography (SPECT)[11] have
been used. However, the detection sensitivity of transplanted cells using such techniques is in
some cases very low, or rendered difficult and costly by the use of radiopharmaceutical
compounds. Optical imaging is expected to contribute to the development of cell
transplantation, as it is less costly, easier to handle, non-ionizing and very sensitive.[12] For
that purpose, various optical labelling techniques have been developed to apprehend cell
behavior in vitro and in vivo.[13] However, optical in vivo detection is impaired by the
autofluorescence signal coming from the body when exciting the probes.[14] To overcome this
parasitic signal, our group pioneered the use of persistent luminescent nanoparticles (PLNPs)
for in vivo imaging. Acting as optical capacitors, PLNPs can emit light in the tissue
transparency window for minutes to hours after the end of an UV or visible illumination,
leading to signals without autofluorescence and high target to background ratio.[15-20]
Recently, ultrasensitive detection of labelled cells in small animals either after intravenous
(IV) or subcutaneous (SC) injection was demonstrated in preliminary studies using
PLNPs.[18,21-22]
The long-term efficacy of stem cells therapy is presently relatively low, which can be due to a
lack of cell retention in the treatment area,[23] misplaced-injection, or cell injection into highly
fibrotic tissues.[24] Fortunately, unproperly localized injection can be prevented by real-time
imaging guidance to ensure sufficient cell delivery to the desired tissue location. In order to
labelled with magnetic nanoparticles could be influenced by applying a magnetic field and
gradient.[25-26] Various preclinical studies have exploited the magnetic properties acquired by
cells carrying magnetic nanoparticles in order to increase the retention of implanted cells at
specific sites within the body, for example with endothelial cells or EPC.[27-30]
Recently, we have developed a modified approach to synthesize a new class of mesoporous
nanohybrids (MPNHs) consisting of PLNPs and USPIOs incorporated into the same
mesoporous silica matrix.[31] We thus wondered whether these new nanohybrids could be used
to label cells of interest in order to both control their in vivo fate, using their magnetic
property, and to follow in real-time their distribution, using their persistent luminescent
property, after injection. As a model, we chose a subpopulation of EPC called “late” EPC or
endothelial colony-forming cells (ECFC) that present blood vessel-forming ability.[32-33]
Herein, we report the use of MPNHs to label ECFC in non-toxic conditions, allowing these
cells to keep their proliferation ability and biological properties. After labelling, it was
possible to detect the cells in vivo and we show that MPNHs-COOH labelled ECFC can be
remotely controlled in vivo by applying an external magnetic field and gradient.
2. Results and discussion
2.1. Characterization and functionalization of the nanohybrids
We have previously reported the synthesis of different mesoporous nanohybrids (MPNH)
made of PLNPs and containing increasing amount of USPIOs (0, 1.4, 3.5 and 5.2% (w/w),
named MPNH0, MPNH1, MPNH2 and MPNH3, respectively) incorporated into a silica matrix
(Fig 1.a-d). These nanohybrids have been synthesized using tetraethoxysilane (TEOS),
cetyltrimethylammonium bromide (CTAB) and comprise the two types of nanoparticles
the internalization efficacy and on the cell cytotoxicity, these nanohybrids have been coated
either with (3-aminopropyl)triethoxysilane (APTES) to introduce amine groups on the
MPNHs (MPNH-NH2) or with diglycolic anhydride (DGA) to introduce carboxylic acids
functions (MPNH-COOH) (Fig 1.f). The different MPNHs have a spherical-like shape (Fig
1.a-d) and persistent luminescence properties after both UV and visible excitation (Fig 1.e).
The light emission can persist for several dozen of minutes after the end of the excitation,
which is necessary to get in vivo optical signals without background. Figure 1.e also informs
about the compared efficacy of UV versus visible illumination. As shown on the
corresponding decay curves, the persistent luminescence signal is approximately one log
weaker following visible light excitation, in comparison with the signal obtained following
UV excitation. Such typical trend regarding the persistent luminescence signal of these
MPNHs matches the results demonstrated earlier in several other studies from our group.[31,34]
More importantly, the persistent luminescence properties of MPNHs do not vary with the
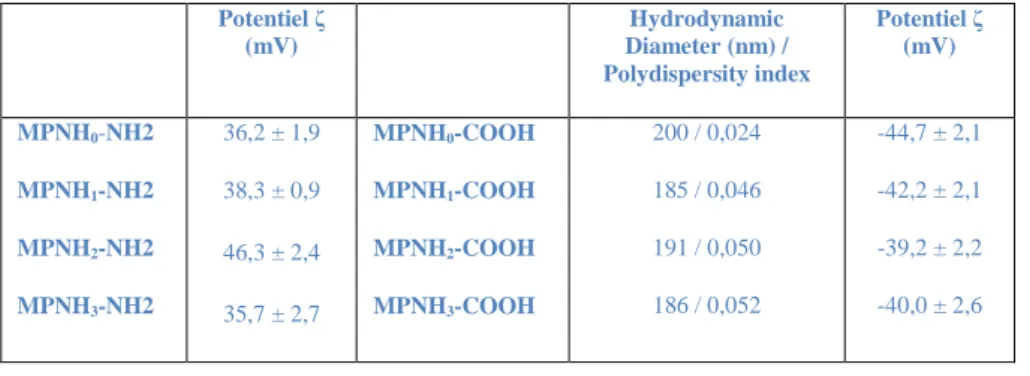
percentage of USPIO (Fig 1.e). As expected, the functionalization procedure has an effect on
the zeta potential of the MPNHs: MPNHs-NH2, with the amino groups, are protonated in mQ
water and have positive surface charges, whereas MPNHs-COOH, with the carboxylic acids,
have negative zeta potentials (Table 1). In addition, the amount of USPIOs does not seem to
have any major impact on the global physicochemical properties of the MPNHs. Notably, all
MPNHs display both similar zeta potential, either positive around + 40 mV with MPNHs-NH2
or negative around – 40 mV with MPNHs-COOH, and hydrodynamic diameters which are
rather stable around 190 nm from MPNH0-COOH to MPNH3-COOH.
As a cell model we have chosen ECFC, a variety of endothelial progenitors.[32,33] Thus, our
objective was to find non-toxic conditions to label ECFC with MPNH and allow in vivo cell
tracking under magnetic control.
We first assessed the influence of three parameters designated as the type of MPNH, the
surface coating (-NH2 or -COOH) and the incubation time (6 h and 24 h) on the global ECFCs
viability. To this end, 104 cells deposited in 96-well plates were incubated with increasing
amounts of nanoparticles. The Alamar blue test was used to evaluate the cell metabolic
activity. As can be observed in Fig 2, the coating has an influence on cell viability. When we
look at MPNH0 (nanohybrids with 0% of USPIOs), we can verify that amine-coated MPNHs
are more cytotoxic than the carboxylic coated ones (Fig 2.a). This is certainly due to the
positive charge of amine-coated MPNHs, leading to a higher cellular uptake as can be seen in
the literature.[35,36] This apparent toxicity is even more important when the incubation time
increases from 6 to 24 hours. In contrast to particle coating, the amount of USPIOs in MPNH
type (MPNH1-3) has little influence on the cell viability (Fig 2.a-d). Such absence of effect
could be attributed to the fact that USPIOs are incorporated into the core of the silica matrix,
therefore not in direct contact with the cells. Moreover, this trend is also in line with previous
work in which USPIOs alone are not responsible for any significant cytotoxic effect at these
concentrations (< 1mM) on endothelial cells.[37,38] Finally, we observed that the low
cytotoxicity of MPNHs-COOH is time independent.
Beside the assessment of cellular metabolic activity by Alamar blue test, a cell proliferation
assay was carried out up to 7 days post-labeling. For this purpose, we selected a concentration
of MPNHs for which the cell viability with the Alamar blue test was above 80% at 24 h, i.e.
0.25 mg.mL-1 (which correspond to 73,5 μg of MPNH per cm2). As can be seen from Fig 2.e,
exposure of ECFC to MPNH3-NH2 appears to significantly alter the proliferation, as
using the Alamar blue test. On the other hand, incubation of ECFC with MPNH3-COOH does
not alter the proliferation of ECFC even after 7 days of proliferation (Fig 2.e).
2.3. Cellular uptake of nanohybrids and opto-magnetic properties of labelled cells
To determine the cell uptake of the MPNHs, different techniques have been used. Since the
MPNHs-COOH are less cytotoxic, a concentration of 73,5 μg.cm-2 (0.25 mg/mL) for each
MPNH-COOH was chosen for subsequent experiments. Transmission electron microscopy
(TEM) observations of ECFC (6 h after labelling) principally show intra-endosomal
confinement of the different MPNH1-3-COOH (Fig. 3.a-c), thus indicating that the low
toxicity obtained by Alamar blue and proliferation tests are not the consequence of an absence
of MPNHs-COOH internalization. We can also observe that these nanoparticles are
internalized in different ways: some MPNHs are observed in small intracellular vesicles,
while the majority are clustered in large lysosome-like vesicles. MPNHs isolated in small
vesicles probably follow clathrin-dependent endocytosis, as previously shown with silica
nanoparticles of about one hundred nanometers.[39]
In order to quantify the amount of MPNHs internalized by the cells, a magnetophoresis
experiment was performed with cells labelled under conditions identical to that of the TEM
experiment. By exploiting the magnetophoretic mobility of each labelled cell in suspension in
a magnetic field gradient, we were able to determine the mass of iron per cell, deduced from
the measurements of single cell velocity towards the magnet and cell radius (Fig 3.d).[40]
Depending on the initial amount of USPIOs in MPNHs, the average mass of iron per cell
approximately varies from 1.7 pg to 3 pg. These results are consistent with previous studies
reporting EPC labelling with similar USPIOs, which obtained iron load from 3[27] to 10[37] pg
iron concentrations ranging from 0.043 to 0.16 mM (for 0.25 mg.mL-1 of MPNH1 and
MPNH3, respectively) and USPIO were embedded in the silica matrix. In addition to the mean
cellular magnetic load, this assay allows determining the iron mass distribution in the cell
population (Figure S1). As MPNHs compositions were previously determined using
ICP-MS,[31] we could determine the average mass of MPNHs per cell from the magnetophoresis
data (Fig 3.e). Unexpectedly, the data from Figure 3.e indicate that the final amount of
MPNHs per cell depends on the type of MPNHs. Indeed, the higher the USPIOs load in
MPNHs, the lower the MPNHs uptake within each cell. Cells labelled with MPNH2-COOH
contain the same amount of iron as those labelled with MPNH3-COOH (Fig 3.d). Thus,
MPNH3 are less internalized than MPNH2 and MPNH1.
After the magnetophoresis experiments, the cells were embedded in an agarose gel (1.5.106
cells per mL) to be characterized by MRI spectrometry in order to measure both T1 and T2
relaxation times (Fig S.2 and 3.f). The presence of USPIOs in cells shows a slight but
non-significant influence on T1-weighted images, and no difference between the T1 of the gel
containing the non-magnetic MPNH0-COOH labelled ECFC when compared to the control
(Fig S2). As expected from magnetically labelled cells, the contrast evolution is much more
important when looking at T2-weighted images.[41] The gel containing the non-magnetic
MPNH0-COOH labelled cells (dark blue column) displayed a contrast similar to the control
gel containing unlabelled ECFC (light blue column), but the gels containing cells labelled
with magnetic MPNH1,2,3 have a much lower T2 than the control (Fig 3.f).
Due to the dual imaging properties of PLNPs, the labelled cells can be readily detected
through their luminescence emission. We compared the luminescence intensity of cells
labelled with the four MPNHs under the same conditions. The gels previously used for the
MRI experiment were illuminated with a visible LED and the persistent luminescence was
depends on the type of MPNH used. The more USPIO concentration in MPNHs, the lower is
the cell luminescence. These variations in the luminescence emission are well correlated to
the different cellular uptake reported before (Fig. 3.e). While MPNH3-COOH labelled cell
have similar iron content and magnetophoretic mobility compared to MPNH2-COOH labelled
cell, their luminescence is 6 times lower than those labelled with MPNH2-COOH (Fig 3.g)
which is in line with the different cell uptake. In addition, despite the higher luminescence
intensity of MPNH1-COOH labelled cells, their magnetic resonance detectability and
magnetic attraction are very low compared to MPNH2-COOH labelled cells. Therefore, in a
trade-off between cellular uptake, luminescence detection, MR detection and magnetophoretic
mobility of cells, MPNH2-COOH appears as the best candidate to carry out further in vivo
dual image-guided and magnetically targeted cellular vectorization experiment.
2.4 Functional properties of labelled cells
For in vivo cell-based therapy, labelled progenitor cells should maintain crucial biological
properties such as migration and capillary network formation abilities.[38,42-44] Thus, we
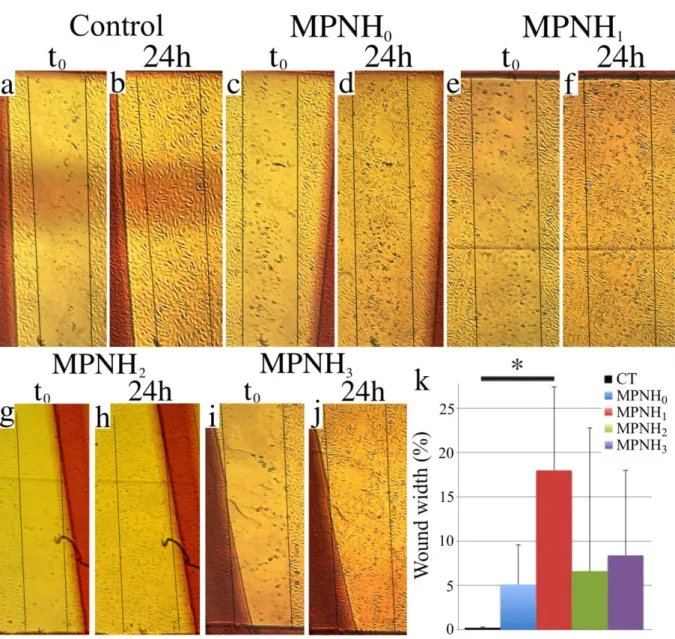
performed two sets of experiments to evaluate these properties. In vitro, the study of cell
migration was carried out using a scratch/wound healing assay.[45] We created a wound gap in
a MPNH-labelled ECFC monolayer by scratching and monitored their migration towards the
gap. The remaining gaps in MPNH treated wells were measured when control scratches had
disappeared, around 24 h after their realization. Thus, injured areas were photographed to
assess healing in each area. Fig 4.a shows the initial injuries (t0) and 24 hours later (24 h). The
wounds are almost all closed after 24 h. Compared to the untreated control, only cells treated
with MPNH1-COOH showed significant decrease in the cell ability to close up the gap (Fig
internalized nanoparticles by ECFC among USPIOs containing MPNH. It is then conceivable
that the greater internalization of MPNH1-COOH is responsible for the longer gap closing
delay. It is worthwhile to precise that these results were obtained when cells were cultured in
EGM-2 culture medium with 2 % (v/v) of foetal calf serum. This is necessary to avoid a bias
due to cell proliferation: a control with 10 % (v/v) of foetal calf serum showed no difference
in the wound healing between control and labelled ECFC (data not shown).
As previously mentioned, ECFC have been shown to possess all the characteristics of
endothelial progenitor to promote vascular repair and angiogenesis in vivo.[32,33] Evaluating
their ability to form vascular structures is one of the most specific ways to assess their ability
to stimulate angiogenesis. This was tested in vitro by plating cells on constituents mimicking
the extracellular matrix called Matrigel. Matrigel stimulates the organization of endothelial
cells in networks evoking microvasculature. ECFC were labelled with MPNHs-COOH before
seeding on Matrigel for 16 h. Under these experimental conditions, labelled and control ECFC
formed extensive tubular network and the labelling process did not affect their properties (Fig
5 and Fig S3). Typical characterizations of tubular structures include the total number of tubes
and their mean lengths (Fig 5.f and 5.g, respectively), but it is also possible to evaluate the
mean covered area, the number of loops, the total length of the network, the loops mean areas
and perimeters, as well as the total branching points (Fig S3.a-f, respectively). As can be seen
on the Fig 5 and Fig S3, there is no significant difference between the networks formed by
labelled and non-labelled ECFC, regardless of the property under consideration. Similar
results have already been reported in the literature using magnetic nanoparticles.[37]
Altogether, these results confirm the MPNHs innocuousness regarding ECFC
2.5 Real time dynamic tracking and magnetic manipulation of transplanted cells in vivo
As a proof of concept, we carried out in vivo experiment to determine whether it was possible
to follow the distribution of MPNH-labelled ECFC in real time by luminescence imaging and
simultaneously to control their localization by magnetic fields. ECFC were labelled with
MPNH0-COOH or MPNH2-COOH under the same conditions to those previously used. 5.105
labelled ECFC were pre-illuminated by an orange LED for 5 min and were then injected in
the peritoneal cavity of BALB/c mice. A luminescence image was acquired before and after
applying a magnet to the right side of each mouse. The ECFC labelled with MPNH0-COOH
represent the control group since MPNH0 do not contain USPIOs and therefore do not react to
the presence of a magnetic field gradient. To evaluate the influence of the presence of an
external magnet on the distribution of ECFC, we monitored the persistent luminescence
intensity for twelve minutes throughout five regions of interest along the abdominal cavity
(red rectangles, Fig 6.a). When looking at the signal of ECFC labelled with MPNH0-COOH, it
can be seen that the luminescence in the mice does not evolve (Fig 6.b) and that the
luminescence profile traced as indicated above is stable after applying the magnet against the
right flank of the mouse (Fig 6.d). On the contrary, when looking at the signal of MPNH2
-COOH labelled ECFC, we observe a significant preferential accumulation with time of the
luminescence situated in the right part of the abdomen towards the right flank of the mouse,
where the magnet is placed (Fig 6.c). Moreover, the luminescence coming from the left half
side of the mice did not change over time, unlike that of the right side. The persistent
luminescence signal increases significantly in the closest area to the magnet (Fig 6.e). This
graph confirms results from the luminescence images: the signal does not evolve at a distance
greater than 2 cm from the magnet. This makes it possible to determine an effective distance
of action of the magnet on the MPNH2-COOH labelled ECFC. Furthermore, the most
experiment, suggesting that once cell sedimentation or tissue adhesion happen, no more cell
movement can occur in our experimental conditions.
These first experiments of magnetic cellular vectorization using MPNHs in vivo show the
possibility to magnetically attract MPNHs-loaded cells injected into the peritoneal cavity and
to optically localize them in real-time by luminescence measurements. This study proved, for
the first time, the feasibility of using nanoparticles as a tool to magnetically vectorize and
concomitantly track cell migration in vivo in real-time, without unnecessary sacrifice of the
animal. The non-invasive nature of this technique opens access to information regarding cell
magnetic vectorization dynamics in living animals. This proof of concept was made possible
in our situation because it was realised on mice. As near-infrared luminescence does not have
an important penetration depth, its actual potential would be limited to preclinical studies on
small animals, per-operative imaging and surface applications (dermatology, gastro-intestinal
endoscopy). Another promising enhancement of this technique could be achieved using PLNP
emitting in the second near-infrared window (between 1.0 and 1.4 μm), as penetration depth is higher for this wavelength range.
3. Conclusion
Nanoparticles with persistent luminescence and magnetic properties were integrated into
nanohybrids in order to label cells of therapeutic interest. In this study, we showed that with
such MPNHs, it is possible to define non-toxic labelling conditions, which allow cells
tracking in real-time using persistent luminescence. Moreover, this led to signals devoid of
autofluorescence and allowed following the injected cells in vivo dynamic and attraction with
a magnet. Our findings provide a proof-of-concept demonstrating that it is possible to realize
sensitivity using persistent luminescence. Thus, we postulate that, by applying an appropriate
magnetic field gradient, the approach developed in this study could be useful to assess cell
targeting to specific locations inside the body for cell-based therapies. This study also
suggests the possibility to realize cell retention in the peritoneal cavity using our
nanoparticles, which may be interesting for applications such as cancer cell therapies[46] if
similar results are further obtained with different kind of therapeutic cells.
4. Experimental section
Chemicals and biologics:
Zinc nitrate hexahydrate (>99%), diglycolic anhydride (>90%) and dimethylhydroxylamine
solution (40%) were obtained from Fluka. Gallium oxide (99.999%), chromium (III) nitrate
nonahydrate (99.99%) and sodium n-dodecyl sulfate (99%) were purchased from Alfa Aesar.
Dimethylformamide (>99.99%) was purchased from SDS. Cetyltrimethylammonium bromide
(CTAB, >98%), tetraethyl orthosilicate (TEOS, >98%), iron (II) chloride tetrahydrate, caffeic
acid and HCl were purchased from Sigma-Aldrich. Water was purified with a Millipore
system (resistivity 18.2 MΩ cm). HBSS and D-PBS were purchased from Dubco.
ECFC isolation, culture and labelling:
Umbilical cord blood collected from consenting mothers was diluted in an equal volume of
HBSS, and mononuclear cells were isolated by density-gradient centrifugation using
1.077g.mL-1 Histopaque solution (Sigma Chemicals, Saint Quentin Fallavier, France) as
described by Bompais et al.[47] CD34+ cells were selected with immunomagnetic beads and
the MACS technique (Miltenyi Biotec, Paris, France). They were plated on 0.2%
medium (EGM-2, Lonza, Walkersville, MD, USA). After 4 days, non-adherent cells were
removed by thorough washing with culture medium. After 10 days of culture, ECFC colonies
became visible microscopically. Cells were then detached with trypsin-EDTA (Eurobio, Les
Ulis, France) and expanded in EGM-@ on 0.2% gelatin coated plates and grown at 37°C in a
humidified 5% CO2 atmosphere for further use. ECFC were used 25 to 45 days after cord
blood processing.
Cell labelling was performed by adding a suspension of MPNHs in EGM-2 culture medium to
adherent cells. Cells were incubated at 37°C for different incubation times (6 or 24h) with
various MPNH concentrations. Incubation was followed by two washes with MPNH-free
D-PBS.
Synthesis and functionalization of the four nanohybrids:
Persistent luminescence nanoparticles (ZnGa2O4:Cr3+), maghemite ultrasmall iron oxide
nanoparticles (γ-Fe2O3) and the four types of mesoporous nanohybrides were synthesized as
previously described.[31]
The surface functionalization of MPNHs was realized as follow: MPNH0,1,2,3-NH2
nanoparticles were obtained by adding APTES (40 μL) to a suspension of MPNH0,1,2,3-OH (10
mg) in DMF (4 mL). The reaction mixture was sonicated for the first 2 minutes using a
Branson Ultrasonic Cleaner 1210 and kept under vigorous stirring for 5 hours at RT.
Particles were washed from the unreacted APTES by three centrifugation/redispersion steps
in DMF. MPNH0,1,2,3-COOH were obtained by having DGA (2.7 mg) react with MPNH0,1,2,3
-NH2 particles (10 mg) in DMF (4 mL) under vigorous stirring overnight at RT. After washing,
MPNH0,1,2,3-COOH were dispersed in sterile glucose (5%).
Alamar blue assay:
Growing amounts of cells (nine conditions from 4.103 to 2.104 cells per well) were seeded in
96-well flat bottom plates (Falcon, Strasbourg, France) and incubated subsequently in complete culture medium, without Alamar Blue reagent for 24 hours and with Alamar Blue
for 5 hours. Fluorescence measurements were then realized every hour (λexc = 530 nm / λem =
590 nm) with a Tecan Infinite Pro 2000 (Tecan Trading AG, Switzerland). This experiment
allowed us to determine efficient conditions for the following cytotoxicity assays.
ECFC were seeded at a density of 104 cells per well in 96-well flat-bottom plates and
incubated in complete culture medium (EGM-2) for 24 hours. Then, medium was replaced by
EGM-2 containing increasing concentrations of MPNH-NH2 or MPNH-COOH. After 6 or 24
hours, medium was removed and EGM-2 with Alamar Blue reagent (10%, v/v) was added for
4 hours at 37°C. Cell viability is calculated from the measured fluorescence of metabolized
Alamar Blue using a Tecan Infinite Pro 2000.
Cell proliferation assay:
ECFC were seeded at a density of 103 cells per well in 96-well flat-bottom plates and
incubated in complete culture medium overnight. Cells were then exposed 6 h to EGM-2
(control), MPNH-NH2 or MPNH-COOH suspensions in EGM-2 at the concentration of 0.25
mg.mL-1. Mediums were then removed and three control wells, as well as three
MPNH-treated wells, were MPNH-treated as follow: the supernatants were removed, wells were gently
washed using 300 μL of DPBS, cells were treated with 20 μL of trypsin-EDTA for 5 min at
37°C before adding 40 μL of 10% trypan blue (v/v) EGM-2, cells were transferred in an
Eppendorf tube and another 20 μL of EGM-2 was used to rince the wells. Cells were then
counted on a Malassez cell. This action was repeated over time.
Magnetophoresis:
Cellular uptake was quantified by means of magnetophoresis,[48] which consists of measuring
gradient gradB = 18.5 mT.mm-1). The iron mass per cell is calculated from the balance of
viscous force (6πηRυ, η being the water viscosity, R the cell radius, υ the cell velocity) and the
magnetic force (M*gradB, M being the cell magnetic moment). Measuring, from video analysis, the velocity υ and the radius R of cells migrating toward the magnet, we obtain their
magnetic moment or, equivalently, their iron mass mFe. In addition to the mean cellular
magnetic load, this assay allows determining the iron mass distribution in the cell population (n > 87 cells for each incubation condition).
Optical characterization of cells:
Labelled cells were fixed in Eppendorf tubes containing a low gelling point agarose (BMA
Products, USA) solution 3% (w/v) at 38°C, and a concentration of 1.5.106 ECFC.mL-1.
Eppendorfs were then illuminated for 5 minutes before signal acquisition. Signal acquisition
was carried out using a photon-counting system based on a cooled GaAs intensified
charge-coupled device (ICCD) camera (Optima, Biospace, Paris, France).
Magnetic characterization of cells:
The agarose gels were also used to perform MRI measurements. MRI was performed with a
dedicated small-animal 4.7 Tesla MR system (Biospec 47/40 USR Bruker), using a
quadrature transmit/receive body coil with a 35 mm inner diameter. A 5 mm water reference
tube was also inserted. The T2 sequence was used with following parameters: TR = 12 s, 100
TE were done from 9 ms with 9 ms between each, 149 x 85 matrix, 3 slices of 1 mm thickness,
resolution 235 x 235 μm and FOV = 3.5 x 2 cm. The T1 sequence was used with following
parameters: TE = 11 s, TR = 10 s / 7 s / 4,5 s / 3 s / 1,5 s / 800 ms / 400 ms / 200 ms / 150 ms
/ 100 ms / 90 ms, 149 x 85 matrix, 3 slices of 1 mm thickness, resolution 235 x 235 μm and
FOV = 3.5 x 2 cm.
Cell migration assays were performed by plating 3.105 ECFC on 6-well plates until
confluence was reached. Then, the cells were treated with 73.5 μg.cm-2 (0.25 mg.mL-1) of each
MPNH-COOH for 6 h. Wells were rinsed with PBS and three wounds were realized in each
well using a P200 pipette tip. PBS supernatants were discarded and EGM-2 with 2 or 10 % of
serum was added. Wounds widths were measured 24 h after they were realized. The cells
were imaged using a Nikon Diaphot inverted contrast microscope. The width of the wounds
was quantified using ImageJ. Six width measures were performed on three wounds for each
condition.
In vitro tube formation assay:
These experiments were carried out with cells labelled under the same conditions as for the
previous experiments (MPNH-COOH, 6 h, 73.5 μg.cm-2 / 0.25 mg.mL-1). At the same time,
48-well plates were coated with 150 μL of growth factor reduced Matrigel. Polymerization of
Matrigel was realized at 37°C for 1 h. 4.104 control and labelled ECFC were loaded on
Matrigel and incubated in EGM-2 for 16 h to allow cellular network structures to fully
developp. Cell structures were imaged using a Nikon Diaphot inverted contrast microscope,
and networks were characterized with the online software Wimasis Image Analysis, using the
Wimtube protocol (www.wimasis.com/en/products/13/WimTube).
In vivo cell imaging and tracking:
Animal studies were conducted in agreement with the French guidelines for animal care in
compliance with procedures approved by the Paris Descartes ethics committee for animal
research (ref. CEEA34.JS.142.12). Five weeks old female BALB/c mice (Janvier, Le Genest
St. Isle, France) were anesthetized by oral inhalation of isoflurane. A quantity of 5.105 ECFC
were labelled with either MPNH0-COOH (control) or MPNH2-COOH under previously
μL of a 5% sterile D-PBS solution at a concentration of 5.106
ECFC.mL-1. The suspension of
labelled ECFC was first excited ex vivo for 5 minutes under an orange LED before injection
in the peritoneal cavity of mice. Animals were then placed on their back under the
photon-counting device, and the signal acquisitions were performed. A luminescence image was
realized for ten seconds before applying a magnet against the right side of the mouse.
Luminescence was then followed for ten minutes, until its distribution stops evolving. Four
ring neodymium magnets (outer diameter 19.1 mm, inner diameter 9.5 mm, height 6.4 mm,
strength 75.5 N, Supermagnete, Gottmadingen, Germany) were joined to be applied on the
side of the mouse.
Acknowledgements
The authors sincerely thank Anna Lokajczyk and Nour Bacha for their advices and help
concerning ECFC cultures and experiments (from the laboratory "Therapeutiques innovantes
en hémostase", Inserm U S1140), Johanne Seguin (from the UTCBS, CNRS UMR 8258),
René Lai-Kuen and Bruno Saubaméa (from the technological Platform of
IFR71/IMTCE-Cellular & Molecular Imaging), Dan Elgrabli (from the MSC, CNRS UMR 7057), as well as
Florence Delestre and Maurice Teston for their unwavering support. This work was supported
by a grant from the Pres Sorbonne Paris-Cité (ODICEO project).
References
[1] A. Trounson, C. McDonald, Cell Stem Cell 2015, 17, 11.
[2] N.J. Leeper, A.L. Hunter, J.P. Cooke, Circulation 2010, 122, 517.
[3] R.J. Morris, Y. Liu, L. Marles, Z. Yang, C. Trempus, S. Li, J. S. Lin, J. A. Sawicki and G. Cotsarelis, Nat. Biotechnol. 2004, 22, 411.
[4] W.-B. Shen, C. Plachez, O. Tsymbalyuk, N. Tsymbalyuk, S. Xu, A. Smith, S. Michel, D. Yarnell, R. Mullins, R. Gulapalli, A. Puche, J.M. Simard, P.S. Fishman and P. Yarowsky, Cell Transplant. 2016, 25, 1085.
[5] M. Ishii, Y. Numaguchi, K. Okumura, R. Kubota, X. Ma, R. Murakami, K. Naruse, T.
Murohara, Atherosclerosis 2009, 206, 109.
[6] F. Zemani, J.-S. Sylvestre, F. Fauvel-Lafeve, A. Bruel, J. Vilar, I. Bieche, I. Laurendeau, I. Galy-Fauroux, A.-M. Fischer, C. Boisson-Vidal, Arterioscler. Thromb. Vasc. Biol. 2008, 28(4), 644.
[7] I.M. Barbash, P. Chouraqui, J. Baron, M.S. Feinberg, S. Etzion, A. Tessone, L. Miller,
E. Guetta, D. Zipori, L.H. Kedes, R.A. Kloner, J. Leor , Circulation 2003, 108, 863.
[8] D.J. Brenner, E.J. Hall, N. Engl. J. Med. 2007, 357, 2277.
[9] M. Modo, J. Kolosnjaj-Tabi, F. Nicholls, W. Ling, C. Wilhelm, O. Debarge, F. Gazeau, O. Clement, Contrast Media Mol. Imaging 2013, 8, 439.
[10] C. Yoshida, A.B. Tsuji, H. Sudo, A. Sugyo, C. Sogawa, N. Inubushi, T. Uehara, T. Fukumura, M. Koizumi, Y. Arano, T. Saga, Nucl. Med. Biol. 2011, 38, 331.
[11] J.L. Ortiz, A. Ortiz, J. Milara, M. Armengot, C. Sanz, D. Compan, E. Morcillo, J. Cortijo. Plos One 2016, 11, e0164399.
[12] J. Li, W.Y. Lee, T. Wu, J. Xu, K. Zhang, G. Li, J. Xia, L. Bian. Adv. Helthcare Mater.
2016, 77, 14.
[13] H. Yukawa, S. Mizufune, C. Mamori, Y. Kagami, K. Oishi, N. Kaji, Y. Okamoto, M.
Takeshi, H. Noguchi, Y. Baba, M. Hamaguchi, N. Hamajima, S. Hayashi, Cell Transplant.
2009, 18, 591.
[14] H. Yukawa, M. Watanabe, N. Kaji, Y. Baba, Cell Med. 2014, 7, 75.
[15] Q. le Masne de Chermont, C. Chanéac, J. Seguin, F. Pellé, S. Maîtrejean, J.-P. Jolivet, D. Gourier, M. Bessodes, D. Scherman, Proc. Natl. Acad. Sci. USA 2007, 104, 9266.
[16] T. Maldiney, A. Lecointre, B. Viana, A. Bessiere, M. Bessodes, D. Gourier, C. Richard, D. Scherman, J. Am. Chem. Soc. 2011, 133, 11810.
[17] T. Maldiney, B. Viana, A. Bessiere, D. Gourier, M. Bessodes, D. Scherman, C. Richard, Opt. Mater. 2013, 35, 1852.
[18] T. Maldiney, A. Bessière, J. Seguin, E. Teston, S.K. Sharma, B. Viana, A.J.J. Bos, P.
Dorenbos, M. Bessodes, D. Gourier, D. Scherman, C. Richard, Nat. Mater. 2014, 13, 418.
[19] T. Lécuyer, E. Teston, G. Ramirez-Garcia, T. Maldiney, B. Viana, J. Seguin, N. Mignet, D. Scherman, C. Richard, Theranostics 2016, 6, 2488.
[20] E. Teston, S. Richard, T. Maldiney, N. Lièvre, G. Yangshu Wang, L. Motte, C. Richard, Y. Lalatonne, Chem. Eur. J. 2015, 21, 7350.
[21] S.-Q. Wu, C.-W. Chi, C.-X. Yang, X.-P. Yan, Anal. Chem. 2016, 88, 4114.
[22] S.-Q. Wu, C.-X. Yang, X.-P.Yan. Adv. Funct. Mater. 2017, 1604992.
[23] S.K. Sanganalmath, R. Bolli, Circ. Res. 2013, 113, 810.
[24] G. Vunjak-Novakovic, K.O. Lui, N. Tandon, K.R. Chien, Annu. Rev. Biomed. Eng.
2011, 13, 245.
[25] B. Polyak, I. Fishbein, M. Chorny, I. Alferiev, D. Williams, B. Yellen, G. Friedman,
R. J. Levy, Proc. Natl. Acad. Sci. USA 2008, 105,698.
[26] L. Cheng, C. Wang, X. Ma, Q. Wang, Y. Cheng, H. Wang, Y. Li, Z. Liu, Adv. Funct.
Mater. 2013, 23, 272.
[27] A. Chaudeurge, C. Wilhelm, A. Chen-Tournoux, F. Farahmand, V. Bellamy, G.
Autret, C. Ménager, A. Hagège, J. Larghéro, F. Gazeau, O. Clément, P. Menasché, Cell Transplant. 2012, 21, 679.
[28] J. Riegler, A. Liew, S.O. Hynes, D. Ortega, T. O'Brien, R.M. Day, T. Richards, F. Sharif, Q.A. Pankhurst, M.F. Lythgoe, Biomaterials 2013, 34(8),1987.
[29] B. Polyak, M. Medved, N. Lazareva, L. Steele, T. Patel, A. Rai, M.Y. Rotenberg, K.
Wasko, A.R. Kohut, R. Sensenig, G. Friedman, ACS Nano, 2016, 10(10), 9559.
[30] B. Polyak, I. Fishbein, M. Chorny, I. Alferiev, D. Williams, B. Yellen, G. Friedman,
[31] E. Teston, Y. Lalatonne, D. Elgrabli, G. Autret, L. Motte, F. Gazeau, D. Scherman, O. Clément, C. Richard, T. Maldiney, Small 2015, 11, 2696.
[32] M.C. Yoder, L.E. Mead, D. Prater, T.R. Krier, K.N. Mroueh, F. Li, R. Krasich, C.J. Temm, J.T. Prchal, D.A.Ingram, Blood 2007, 109(5), 1801.
[33] C. Bouvard, B. Gafsou, B. Dizier, I. Galy-Fauroux, A. Lokajczyk, C. Boisson-Vidal,
A.-M. Fischer, D. Helley, Arterioscler. Thromb. Vasc. Biol. 2010, 30, 1569.
[34] T. Maldiney, B. Ballet, M. Bessodes, D. Scherman, C. Richard, Nanoscale 2014, 6, 13970.
[35] A.M. Abdelmonem, B. Pelaz, K. Kantner, N.C. Bigall, P. del Pino, W.J. Parak, J. Inorg. Biochem. 2015, 153, 334.
[36] T.-H. Chung, S.-H. Wu, M. Yao, C.-H. Lu, Y.-S. Lin, Y. Hung, C.-Y. Mou, Y.-C. Chen, D.-M. Huang, Biomaterials, 2007, 28(19), 2959.
[37] C. Wilhelm, L. Bal, P. Smirnov, I. Galy-Fauroux, O. Clément, F. Gazeau, J. Emerich,
Biomaterials 2007, 28, 3797.
[38] Z. Orynbayeva, R. Sensenig, B. Polyak. Nanomedicine (Lond). 2015, 10(10), 1555.
[39] D.-M. Huang, Y. Hung, B.-S. Ko, S.-C. Hsu, W.-H. Chen, L. Chien, P. Tsai,
C.-T. Kuo, J.-C. Kang, C.-S. Yang, C.-Y. Mou, Y.-C. Chen, FASEB J. 2005, 19, 2014.
[40] J. Kolosnjaj-Tabi, C. Wilhelm, O. Clément, F. Gazeau, J. Nanobiotechnology 2013,
11(Suppl 1):S7.
[41] M. Levy, C. Wilhelm, M. Devaud, P. Levitz, F. Gazeau, Contrast Media Mol. Imaging
2012, 7(4), 373.
[42] F. Gazeau, C. Wilhelm, Future Medicinal Chemistry, 2010, 2(3), 397. [43] J. Emmerich, Int. J. Low Extrem. Wounds, 2005, 4(4), 234.
[44] H. Lawall, P. Bramlage, B. Amann, J. Vasc. Surg. 2011, 53(2), 445.
[45] C. C. Liang, A. Y. Park, J. L. Guan, Nat. Protoc. 2007, 2, 329.
[46] S. C. Katz, G. R. Point, M. Cunetta, M. Thorn, P. Guja, N. J. Espat, C. Boutros, N. Hanna, R. P. Junghans, Cancer Gene Ther. 2016, 23(5), 142.
[47] H. Bompais, J. Chagraoui, X. Canron, M. Crisan, X.H. Liu, A. Anjo, C. Tolla-Le Port, M. Leboeuf, P. Charbord, A. Bikfalvi, G. Uzan, Blood, 2004, 103(7), 2577.
[48] C. Wilhelm, F. Gazeau, J.C. Bacri, Eur. Biophys. J. 2002, 31(2), 118.
Figures
Figure 1: TEM images of non-functionalized MPNH0 (a), MPNH1 (b), MPNH2 (c), MPNH3
(d). e) Decay curves of MPNHs after 2 min UV (254 nm) or red-LED illumination Persistent
luminescence intensity is expressed in log10 scale in arbitrary units. f) Synthetic pathway from
MPNHs-OH to MPNHs-COOH. (adapted from [31])
Figure 2: Cytotoxicity of MPNHs in ECFC. a-d) Percentage of viability after 6 (red and blue
diamonds) or 24 h (black squares) of incubation with MPNHs-NH2 (red curves) or
MPNHs-COOH (blue curves). All types of MPNH (MPNH0 to MPNH3, as shown on graphs (a) to (d),
(294 μg.cm-2). e) Cell proliferation after incubation in the absence (control, blue diamonds) or
presence of MPNH3-NH2 (red squares) or -COOH (green squares) (incubation time 6 h,
concentration of 0.25 mg.mL-1 / 73.5 μg.cm-2). Growth capacity was not affected by the
carboxylic coating, as opposed to the amino coating, compared with growth capacity in
control.
Figure 3: Optical and magnetic characterizations of MPNHs labelled ECFC. a-c) Electron
micrographs of ECFC after 6 h of incubation with MPNH1-COOH (a), MPNH2-COOH (b)
load per cell after incubation. Statistical analyses were realized using an Anova test followed
by a Bonferroni comparison. Bar graphs show mean ± SEM (n = 88, 178 and 109 for MPNH1,
MPNH2 and MPNH3, respectively). ** and *** correspond to p < 0.01 and 0.001,
respectively. f) T2* MRI measurements and images of agarose gels with 1.5.106 ECFC.mL-1.
Control tube (CT, sky blue) contains the same concentration of unlabelled ECFC. Bar graph
show mean ± SD, images of corresponding tubes are shown under the graphics. g) Persistent
luminescence of previously described agarose gels after 5 min of red-LED illumination (bar
graph show mean ± SD).
Figure 4: Assessment of the invasion ability of labelled ECFC. a-j) Images of wounds were
taken 24 h after their realization, when control wounds have disappeared. k) Evaluation of
an Anova test followed by a Bonferroni comparison. Bar graphs show mean bar graph show
mean ± SD, * indicates p < 0.05.
Figure 5: Vasculogenesis in vitro with labelled cells on Matrigel. Control (a) and MPNH0,1,2,3
-COOH (respectively b, c, d and e) labelled ECFC were incubated at 37°C in EGM-2 during
of tubes (f) or the mean tube length (g) were assessed with an online software (Wimasis). Bar
Figure 6: In vivo magnetic vectorisation of labelled ECFC and real-time optical imaging of
their biodistribution. a) Representation of the in vivo experiment and segmentation of mice
abdomen to follow the evolution of the luminescence distribution. b-e) Caracteristic evolution
of persistent luminescence distribution in a mouse after injection of MPNH0-COOH labelled
ECFC (b, control experiment) or MPNH2-COOH labelled ECFC (c) and corresponding
graphs (respectively d and e). Statistical analyses were realised between the luminescence
intensities before and 12 min after magnet apposition using an Anova test followed by a
Tables
Table 1: DLS measurements giving hydrodynamic diameters and ζ-potentials of MPNHs-NH2
and MPNHs-COOH. Potentiel ζ (mV) Hydrodynamic Diameter (nm) / Polydispersity index Potentiel ζ (mV) MPNH0-NH2 MPNH1-NH2 MPNH2-NH2 MPNH3-NH2 36,2 ± 1,9 38,3 ± 0,9 46,3 ± 2,4 35,7 ± 2,7 MPNH0-COOH MPNH1-COOH MPNH2-COOH MPNH3-COOH 200 / 0,024 185 / 0,046 191 / 0,050 186 / 0,052 -44,7 ± 2,1 -42,2 ± 2,1 -39,2 ± 2,2 -40,0 ± 2,6 Supplementary
Figure S1: Iron mass distribution in MPNHs-COOH labelled ECFC. a) MPNH0-COOH, b)
Figure S2: T1* MRI measurements and images of agarose gels with 1.5.106 ECFC.mL-1.
Control tube (CT, sky blue) contains the same concentration of unlabelled ECFC. Bar graph
Figure S3: Supplementary characterizations of vascular network formed by unlabelled and