Association of Virus Load, CD4 Cell Count, and Treatment with Clinical
Progression in Human Immunodeficiency Virus–Infected Patients with Very
Low CD4 Cell Counts
Veronica Miller,1,aAndrew N. Phillips,2 Bonaventura Clotet,3Amanda Mocroft,2
Bruno Ledergerber,4Ole Kirk,5Vidar Ormaasen,6 Panagiotis Gargalianos-Kakolyris,7Stefano Vella,8 and Jens D. Lundgren,5for the EuroSIDA Study Groupb
1Klinikum der Johann Wolfgang Goethe-Universita¨t, Zentrum der Inneren Medizin, Frankfurt, Germany;2Royal Free Centre for HIV Medicine and Department of Primary Care and Population Sciences, Royal Free and University College Medical School, London, United Kingdom;3Fundacio` irsi Caixa, Hospital Universitari Germans Trias i Pujol, Barcelona, Spain;4Division of Infectious Diseases, University Hospital Zurich, Switzerland;5Hvidovre Hospital, University of Copenhagen, Denmark;6Department of Infectious Diseases, Ulleva˚l Hospital, Oslo, Norway;7Special Infectious Unit, First Department of Medicine, General Hospital of Athens, Athens, Greece;8Laboratory of Virology, Instituto Superiore di Sanita`, Rome, Italy This study prospectively assessed the impact of treatment modality, virus load, and CD4
cell count of !50 cells/mm3
on human immunodeficiency virus disease progression. The in-cidence rate of new AIDS disease or death was 54.8 (95% confidence interval, 48.7–59.9) per 100 person-years of follow-up. Independent predictors related to progression were latest CD4 cell count (relative risk [RR], 0.84/10 mm3
higher;P!.0001), latest hemoglobin level (RR, 0.79/g/L higher; P!.0001), Pneumocystis carinii pneumonia prophylaxis (RR, 0.49; P!
), latest body mass index (RR, 0.93/kg/m2
higher; ), latest virus load (RR, 1.11/
.0001 P p .002
log10higher;P p .03), and intensity of treatment (RR, 1.82,P p .004; RR 2.27,P!.0001; RR 2.46,P p .0001; RR 2.33P!.0006; 5.10,P!.0001, respectively, for 4, 3, 2, 1, or no drugs vs.⭓5 drugs). Although reverse causality cannot be excluded, more intense antiviral treatment appears to decrease the risk of progression in immunocompromised patients.
Although highly active antiretroviral therapy (HAART) has noticeably and significantly reduced the morbidity and mortality associated with human immunodeficiency virus (HIV) type 1 infection [1, 2], virologic treatment failure is frequent [3, 4]. The prognostic value of plasma HIV-1 RNA and CD4 cell count for clinical progression was originally measured in antiretroviral un-treated or minimally un-treated patient populations [5, 6].
Data from several cohorts indicate that CD4 cell counts may remain stable or continue to increase in patients on HAART, despite a rebound in plasma HIV-1 RNA levels [7–9]. Because the level of immunosuppression or immunocompetence
deter-Received 30 November 2001; revised 19 March 2002; electronically pub-lished 3 July 2002.
National and local guidelines were followed to obtain informed consent at participating study centers.
Financial support: European Commission (BIOMED); GlaxoSmithKline, Roche, and Boehringer-Ingelheim (unrestricted); Swiss Federal Office for Education and Science (support of Swiss sites).
a Present affiliation: George Washington University, School of Public Health and Human Services, Washington, DC.
b Study group members are listed after the text.
Reprints or correspondence: Dr. Veronica Miller, Forum for Collabo-rative HIV Research, George Washington University, School of Public Health and Health Services, 2021 K St. NW, Ste. 800, Washington, DC 20009 ([email protected]).
The Journal of Infectious Diseases 2002; 186:189–97
䉷 2002 by the Infectious Diseases Society of America. All rights reserved. 0022-1899/2002/18602-0006$15.00
mines disease progression, CD4 cell count may be a better predictor for progression than plasma HIV-1 RNA levels for patients receiving HAART. On the other hand, a treatment benefit independent of both CD4 cell count and virus load was observed when patients receiving protease inhibitors (PIs) were compared with patients not receiving PI-containing therapies, although both virus load and CD4 cell count remained signif-icant independent factors associated with disease progression [10]. Furthermore, treatment discontinuation in patients with virologic failure leads to rapid increases in virus load and de-clining CD4 cell count, which provides further evidence of a treatment benefit despite virologic failure [11, 12]. However, continuation of antiretroviral treatment in the presence of de-tectable levels of viral replication carry the risk of further viral evolution toward higher levels of resistance [13] and the de-velopment or worsening of existing drug toxicities. Thus, it is important to investigate the relationship between plasma HIV-1 RNA levels, CD4 cell counts, treatment modality, and disease progression in greater detail. From a clinical perspective, the management options for the increasing proportion of patients experiencing significant immunologic and virologic failure while receiving HAART are sparse; multidrug combinations of⭓6 drugs are frequently used without clinical endpoint data to support this practice [14, 15].
A previous analysis of the EuroSIDA cohort indicated that disease progression in patients with low CD4 cell counts was
related inversely to intensity of treatment. The incidence rates of clinical progression were 38–78 per 100 person-years of pa-tient follow-up, according to the intensity of treatment, even though all patients had CD4 cell counts of⭐50 cells/mm3[16]. In another study, the incidence of AIDS-defining illnesses was significantly lower if patients were receiving HAART in each CD4 cell strata examined, and this was confirmed for 7 of 8 individual diagnoses [17]. In these 2 studies, the impact of plasma HIV-1 RNA and type of HAART treatment on disease progression could not be established. Historically, the majority of patients receiving HAART received PIs.
Our objective for the present analysis was to assess the impact of the treatment modality in combination with virus load and CD4 cell count on disease progression in patients with CD4 cell counts of ⭐50 cells/mm3. In addition to CD4 cell count and virus load, we looked at hemoglobin levels [17–19], body mass index (BMI), and the use of prophylaxis for opportunistic infections.
Subjects and Methods
Subjects and setting. The EuroSIDA study includes18500
pa-tients from 64 centers across Europe and Israel. Details of the study have been published elsewhere [17, 20]. In brief, patients⭓16 years old with CD4 cell count of⭐500 cells/mm3
(restriction applies to cohorts 1–3) were recruited into the study. Information is collected from patient case notes onto a standardized data collection form at baseline and every 6 months thereafter. Data collected at each follow-up visit include the latest weight and hemoglobin measure-ments, all CD4 lymphocyte counts measured at the participating site since last the follow-up, and all virus load measurements (with the method used and the lower limit of detection). The date of starting and stopping each antiretroviral drug is recorded, as are drugs for prophylaxis against opportunistic infections. Dates of diagnosis of all AIDS-defining illnesses are also recorded as defined by the 1993 Centers for Disease Control and Prevention clinical definition of AIDS [21]. Members of the coordinating office visit all centers to ensure correct patient selection and accurate data collection. Follow-up for this analysis is to summer 2000.
Statistical analyses. Incidence rates of clinical progression (new AIDS or death) were calculated as number of events per 100 per-son-years of follow-up [22] within various strata of current calendar year, presence of a previous AIDS diagnosis, latest CD4 cell count (cells/mm3
), latest virus load (copies/mL) measurement, latest he-moglobin (g/L) measure, latest BMI (kg/m2
), number of drugs re-ceived 3 months previously, total drugs ever taken, and current use of Pneumocystis carinii pneumonia (PCP) and/or Mycobacterium avium complex (MAC) prophylaxis. The basic time units used were months. A given month for a given subject contributed to the person-years at risk if the most recent CD4 cell count and virus load were measured⭐6 months earlier, the most recent CD4 cell count was!50 cells/mm3
, and the subject was under active follow-up in the EuroSIDA. Thus, person-months contributed by a given subject were not necessarily consecutive, depending on availability of virus load and CD4 cell counts and on whether CD4 cells were
!50 cells/mm3
. Eligible patients had⭓1 month of follow-up; the first such month was the baseline date for that patient.
When we considered the association with clinical progression of the number of drugs being taken, patient follow-up was allocated to the treatment regimen 3 months previously rather than that in the same month. This lag was used because of the tendency for all drugs to be stopped immediately before death and occasionally upon occurrence or diagnosis of an AIDS disease, and we wished to study the effect of the drug regimen on risk of death and not the converse. We calculated confidence intervals (CIs) for the in-cidence rates by using a normal approximation (if there were!20
events, Poisson distribution was used). Poisson regression models were used to assess predictors of disease progression.
In addition to grouping patients by number of drugs received 3 months earlier, we also grouped patients according to whether they were receiving a PI, a nonnucleoside reverse-transcriptase inhibitor (NNRTI), or nucleoside reverse-transcriptase inhibitors (NRTIs) only. We used generalized estimating equations with the Poisson mod-els when we considered rates of new AIDS disease or death because we included multiple AIDS events for the same subject [23]. PCP prophylaxis was defined as use of cotrimoxazole, trimethoprim-sulfamethoxazole, pentamidine, dapsone, or atovaquone. MAC pro-phylaxis was defined as the use of (any) ethambutol, rifabutin, or clarithromycin/azithromycin. All statistical analyses were performed by using SAS software (version 6.12; SAS Institute). Poisson re-gression was performed with PROC GENMOD software (SAS Institute).
Results
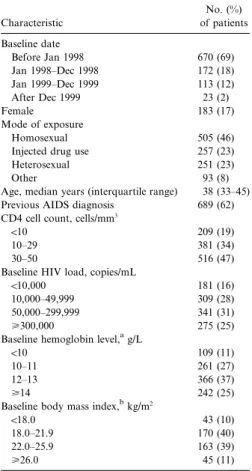
Patient population. In total, 1106 patients satisfied the entry criteria for this study and yielded 808.0 person-years of follow-up. Table 1 shows the characteristics of the patients at the time they first met eligibility criteria (referred to as baseline). Of the subjects, 69% had a baseline date before January 1998, 83% were male, and 46% were infected through homosexual contact. The median CD4 cell count was 27 cells/mm3; 53% of patients entered the study with CD4 cell counts of!30 cells/mm3. The median virus load at baseline was 4.8 log10copies/mL (63,000 copies/mL), and 56% of patients had150,000 HIV copies/mL at study entry. Table 1 also shows the distributions for he-moglobin and BMI categories.
At baseline, 122 (11%) patients were not receiving any an-tiretroviral treatment (table 2), 68% were receiving⭓3 drugs (10% were receiving⭓5 drugs), 727 (74%) were receiving ⭓1 PIs at baseline, 112 (11%) were receiving⭓1 NNRTIs, and 222 (23%) were receiving NRTIs only. Of those receiving⭓5 drugs, 58% were receiving ritonavir, compared with 43% receiving 4 drugs, and 18% receiving 3 drugs. Because the EuroSIDA da-tabase does not include drug doses, it is not possible to report whether ritonavir was being used only as a pharmacologic en-hancer of drug levels of other PIs or at therapeutic levels. The majority of subjects (52%) had ever received 3–5 drugs; 29% had ever received⭓6 drugs (table 2). Opportunistic infection
Table 1. Patient characteristics (n p 1106). Characteristic No. (%) of patients Baseline date Before Jan 1998 670 (69) Jan 1998–Dec 1998 172 (18) Jan 1999–Dec 1999 113 (12) After Dec 1999 23 (2) Female 183 (17) Mode of exposure Homosexual 505 (46)
Injected drug use 257 (23)
Heterosexual 251 (23)
Other 93 (8)
Age, median years (interquartile range) 38 (33–45) Previous AIDS diagnosis 689 (62) CD4 cell count, cells/mm3
!10 209 (19)
10–29 381 (34)
30–50 516 (47)
Baseline HIV load, copies/mL
!10,000 181 (16)
10,000–49,999 309 (28)
50,000–299,999 341 (31)
⭓300,000 275 (25)
Baseline hemoglobin level,ag/L
!10 109 (11)
10–11 261 (27)
12–13 366 (37)
⭓14 242 (25)
Baseline body mass index,bkg/m2
!18.0 43 (10)
18.0–21.9 170 (40)
22.0–25.9 163 (39)
⭓26.0 45 (11)
NOTE. HIV, human immunodeficiency virus. a
Data available for 978 patients. b
Data available for 421 patients.
Table 2. Antiretroviral treatment at baseline and previous drug history (n p 1106).
Treatment history
No. (%) of patients No. of current drugs
0 122 (11) 1 54 (5) 2 182 (16) 3 440 (40) 4 195 (18) ⭓5 113 (10)
Total different drugs taken
0–2 217 (20)
3–5 570 (52)
6–8 256 (23)
⭓9 63 (6)
prophylaxis use increased with increasing antiretroviral drug use: for patients receiving 0, 1, 2, 3, 4, or⭓5 drugs, PCP pro-phylaxis was used by 66%, 74%, 72%, 84%, 89%, and 92%, respectively, and MAC infection prophylaxis was used by 16%, 23%, 22%, 24%, 34%, and 39%, respectively.
Clinical progression. For all follow-up comparisons, the me-dian/mean (interquartile range) months since the most recent CD4 cell count was 1/1.7 months (0–3/0–6 months). For virus load the equivalent values were 1/1.5 months (0–2/0–6 months). In all, 443 clinical events occurred during the follow-up period. Of these, 190 (42.9%) were progressions to new AIDS events in patients with AIDS at baseline, 178 (40.2%) were deaths, and 75 (16.9%) were first AIDS-defining events. Thus, the overall inci-dence rate (AIDS-defining illnesses and death) was 54.8 (95% CI, 49.7–59.9) per 100 person-years of follow-up; the overall rate for death was 22.1 (95% CI, 18.9–25.3). The most common clin-ical events were esophageal candidiasis (20%), cytomegalovirus retinitis (12%), non-Hodgkin lymphoma (9%), PCP (8%), Kaposi sarcoma (7%), progressive multifocal leukoencephalopathy (6%), and disseminated MAC infection (5%).
Both the overall rate of clinical disease progression (a new
AIDS-defining illness or death) and the death rate decreased with each additional drug received 3 months earlier (141.9 [95% CI, 114.4–169.4] vs. 26.9 [95% CI, 18.6–35.2] for patients re-ceiving 0 vs.⭓5 drugs for overall rate; 72.3 [95% CI, 52.6–92.0] vs. 6.7 [95% CI, 2.5–10.9] for death rate) (table 3). In contrast, the rates did not change consistently by number of drugs ever taken. Patients with an AIDS diagnosis (prior to the month under consideration) had a higher overall rate (61.6 [95% CI, 55.2–68.0] vs. 38.7 [95% CI, 30.8–46.6]). The rate increased with decreasing latest CD4 cell count (36.1 [95% CI, 29.1–43.1] for ⭓30 vs. 86.5 [95% CI, 73.7–99.3] for CD4 cell counts of ⭐10 cells/mm3) and with increasing latest virus load (33.5 [95% CI, 23.5–43.5] vs. 77.2 [95% CI, 64.9–89.5] for!10,000 vs.⭓300,000 copies/mL).
The AIDS-defining illness or death rate also increased as he-moglobin and BMI decreased (24.9 [95% CI, 17.4–32.4] vs. 132.7 [95% CI. 108.7–156.7] for hemoglobin levels⭓14 g/L vs.!10 g/ L; 43.5 [95% CI, 22.2–64.8] vs. 135.4 [95% CI, 105.7–165.1] for BMI⭓26 kg/m2vs.!18 kg/m2). When we considered death as an end point, the rate increased or decreased in a similar manner. Patients receiving PCP prophylaxis experienced a lower rate of new AIDS-defining illnesses or death (46.3 [95% CI, 41.3–51.3] vs. 110.5 [95% CI, 90.6–130.3]), whereas the rate was slightly higher in patients receiving MAC prophylaxis (62.1 [95% CI, 52.0–72.0] vs. 51.9 [95% CI, 46.0–57.8]). The event rate did not differ substantially by current (i.e., the month of follow-up under consideration) calendar year.
Clinical progression according to latest virus load, CD4 cell count, or hemoglobin level in combination with number of drugs received. The combined effect of number of drugs received 3 months previously with latest virus load, CD4 cell count, and hemoglobin measurements on event rates is illustrated in figure 1. This figure shows how the number of drugs affect clinical progression according to each of the other variables. The as-sociation between the number of drugs and clinical progression was generally consistent across the strata of other variables.
Predictors of disease progression. We next estimated the effect of all of the variables on disease progression to clinical
Table 3. Distribution of person-years of follow-up, numbers of disease progression events, and number of deaths with rates per 100 person-years.
Characteristic
Person-years of follow-up
New AIDS or death Death
No. Rate 95% CI No. Rate 95% CI
Calendar year (current)
Before Jan 1998 336.8 194 57.6 49.9–65.6 74 22.0 17.1–26.9
Jan 1998–Dec 1998 221.7 116 52.3 42.7–61.9 50 22.5 16.2–28.8
Jan 1999–Dec 1999 191.0 98 51.3 41.1–61.5 35 18.3 7.97–18.23
After Dec 1999 58.5 35 59.8 40.0–79.6 19 32.5 17.9–47.1
Previous AIDS diagnosis
Yes 570.2 351 61.6 55.2–68.0 161 28.2 23.8–32.6
No 237.8 92 38.7 30.8–46.6 17 71.5 68.1–74.9
Latest CD4 cell count, cells/mm3
!10 201.2 174 86.5 73.7–99.3 79 39.3 30.6–47.7
10–29 324.0 167 51.5 43.7–59.3 60 18.5 13.8–23.2
30–50 282.8 102 36.1 29.1–43.1 39 13.8 9.5–18.1
Latest HIV load, copies/mL
!10,000 128.5 43 33.5 23.5–43.5 24 18.7 11.4–26.0
10,000–49,999 211.2 89 42.1 33.4–50.8 39 18.5 12.7–24.3
50,000–299,999 274.0 161 58.8 49.7–67.9 64 23.3 17.6–29.0
⭓300,000 194.3 150 77.2 64.9–89.5 51 26.2 19.0–33.4
Latest hemoglobin level, g/L
!10 88.2 117 132.7 108.7–156.7 73 82.8 63.8–101.8
10–11 195.2 148 75.8 63.6–88.0 59 30.2 22.5–37.9
12–13 258.3 90 34.8 27.6–42.0 31 12.0 7.8–16.2
⭓14 168.8 42 24.9 17.4–32.4 8 4.7 1.4–8.0
Latest body mass index, kg/m2
!18.0 59.1 80 135.4 105.7–165.1 45 76.1 53.9–98.3
18.0–21.9 196.0 122 62.2 51.2–73.2 42 21.4 14.9–27.9
22.0–25.9 155.3 66 42.5 32.3–52.7 23 14.8 8.8–20.8
⭓26.0 36.8 16 43.5 22.2–64.8 8 21.7 6.6–36.8
No. of different drugs taken in prior 3 months
0 71.9 102 141.9 114.4–169.4 52 72.3 52.6–92.0 1 44.3 28 63.2 39.8–86.6 10 22.6 8.6–36.6 2 118.0 67 56.8 43.2–70.4 29 24.6 15.7–33.5 3 258.5 130 50.3 41.7–58.9 51 19.7 14.3–25.1 4 166.7 76 45.6 35.4–55.8 26 15.6 9.6–21.6 ⭓5 148.7 40 26.9 18.6–35.2 10 6.7 2.5–10.9
Total different drugs taken
0–2 61.0 56 91.8 67.8–115.8 19 31.1 17.1–45.1
3–5 301.0 158 52.5 44.3–60.7 60 19.9 14.9–24.9
6–8 269.9 125 46.3 38.2–54.4 62 23.0 17.3–28.7
⭓9 176.1 104 59.1 47.8–70.4 37 21.0 14.2–27.8
Pneumocystis carinii pneumonia prophylaxis
Yes 700.3 324 46.3 41.3–51.3 110 15.7 12.8–18.6
No 107.7 119 110.5 90.6–130.3 68 63.1 48.1–78.1
Mycobacterium avium complex prophylaxis
Yes 233.5 145 62.1 52.0–72.0 52 22.3 16.3–28.3
No 574.5 298 51.9 46.0–57.8 126 21.9 18.1–25.7
NOTE. CI, confidence interval; HIV, human immunodeficiency virus.
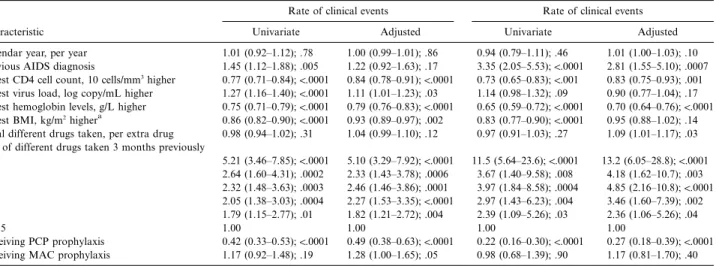
events or death in univariable and multivariable (adjusted for all variables in the table, except BMI) models (table 4). Cal-endar time of entry into the analysis was not associated with progression to clinical events or death. After adjusting for all other variables, a previous AIDS diagnosis was associated only with death (rate ratio, 2.81; 95% CI, 1.55–5.10;P p .007) and not with clinical progression. A latest CD4 cell count of⭓10 cells/mm3was associated with a lower rate ratio for both clinical progression and death, with a rate ratio of 0.84 (95% CI, 0.78– 0.91; P!.0001) and 0.83 (95% CI, 0.75–0.93;P p .003), re-spectively. In contrast, a 1-log higher latest virus load was less significant and was associated with clinical progression only,
with a rate ratio of 1.11 (95% CI, 1.01–1.23;P p .03). Both latest hemoglobin and BMI remained highly significantly as-sociated with clinical progression (P!.002andP p .0009, re-spectively). Only hemoglobin remained a significant predictor for death (P!.0001). We also considered weight, but, in this analysis, BMI had a stronger association with risk of disease progression and death.
In contrast to the number of different drugs taken, the effect of the number of drugs in the regimen was striking. For clinical progression, receiving 4 versus⭓5 drugs was associated with an increased ratio of 1.82 (95% CI, 1.21–2.72;P p .004), and the rate ratios continued to increase with fewer drugs, with a
Figure 1. Overall event rate (new AIDS-defining illnesses or death) per 100 person-years of follow-up by number of antiviral drugs and latest virus load (A), CD4 cell count (B), and hemoglobin measurement (C).
rate ratio of 5.10 (95% CI, 3.29–2.92;P!.0001) for patients receiving no drugs. Similarly, for death, the rate ratio for pa-tients receiving 4 versus⭓5 drugs increased to 2.36 (95% CI, 1.06–5.26;P p .04), and the rate ratio increased to 13.2 (95% CI, 6.05–28.8;P!.0001) for patients receiving no drugs. Pa-tients receiving PCP prophylaxis had a profoundly reduced rate ratio for clinical progression (relative risk [RR], 0.49; 95% CI, 0.38–0.63;P1.0001) and for progression to death (RR, 0.27; 95% CI, 0.18–0.39;P!.0001), whereas those receiving MAC prophylaxis were at a slightly raised risk of clinical progression (P p .05).
We also assessed the effect of class of drugs used (PI and NNRTI, PI but not NNRTI, NNRTI but not PI, and NRTI only) but this was not independently associated with risk of progression. Similarly, total time receiving antiviral therapy, total time receiving PI, total time receiving NNRTIs, total time receiving antiviral therapy with HIV-1 RNA level measured as 1500 copies (which relies on virus load actually being measured
and thus is only a crude proxy for the true time with virus load actually1500 copies/mL) were not significant for either end-point. In a further analysis, we also included in the model a variable indicating whether or not one of the drugs was rito-navir, and this was not significantly independently associated with risk of disease progression. Results in table 4 were similar when we allowed CD4 cell count and virus load values to re-main current for only 3 months instead of 6 months (n p ; 633.3 person-years; adjusted rate ratio for AIDS or death 1048
for virus load, 1.13;P p .02) and for CD4 cell count (0.84; ). We also fitted the number of drugs taken 3 months
P p .0001
earlier as a continuous variable. The rate ratios per 1 less drug were 1.30 (P!.0001) for new AIDS or death and 1.54 (P! ) for death as end point. There was no significant inter-.0001
action between calendar time and these associations (P1.1). Finally, we repeated the analysis by including the number of drugs in use 6 months rather than 3 months previously. For new events, the rate ratio for patients using 4, 3, 2, 1, and 0
Table 4. Results from Poisson regression models of predictors of disease progression and death shown as rate ratio on the basis of 710.5 person-years of follow-up with hemoglobin level known.
Characteristic
Rate of clinical events Rate of clinical events
Univariate Adjusted Univariate Adjusted
Calendar year, per year 1.01 (0.92–1.12); .78 1.00 (0.99–1.01); .86 0.94 (0.79–1.11); .46 1.01 (1.00–1.03); .10 Previous AIDS diagnosis 1.45 (1.12–1.88); .005 1.22 (0.92–1.63); .17 3.35 (2.05–5.53);!.0001 2.81 (1.55–5.10); .0007
Latest CD4 cell count, 10 cells/mm3
higher 0.77 (0.71–0.84);!.0001 0.84 (0.78–0.91);!.0001 0.73 (0.65–0.83);!.001 0.83 (0.75–0.93); .001
Latest virus load, log copy/mL higher 1.27 (1.16–1.40);!.0001 1.11 (1.01–1.23); .03 1.14 (0.98–1.32); .09 0.90 (0.77–1.04); .17
Latest hemoglobin levels, g/L higher 0.75 (0.71–0.79);!.0001 0.79 (0.76–0.83);!.0001 0.65 (0.59–0.72);!.0001 0.70 (0.64–0.76);!.0001
Latest BMI, kg/m2highera 0.86 (0.82–0.90);!.0001 0.93 (0.89–0.97); .002 0.83 (0.77–0.90);!.0001 0.95 (0.88–1.02); .14
Total different drugs taken, per extra drug 0.98 (0.94–1.02); .31 1.04 (0.99–1.10); .12 0.97 (0.91–1.03); .27 1.09 (1.01–1.17); .03 No. of different drugs taken 3 months previously
0 5.21 (3.46–7.85);!.0001 5.10 (3.29–7.92);!.0001 11.5 (5.64–23.6);!.0001 13.2 (6.05–28.8);!.0001 1 2.64 (1.60–4.31); .0002 2.33 (1.43–3.78); .0006 3.67 (1.40–9.58); .008 4.18 (1.62–10.7); .003 2 2.32 (1.48–3.63); .0003 2.46 (1.46–3.86); .0001 3.97 (1.84–8.58); .0004 4.85 (2.16–10.8);!.0001 3 2.05 (1.38–3.03); .0004 2.27 (1.53–3.35);!.0001 2.97 (1.43–6.23); .004 3.46 (1.60–7.39); .002 4 1.79 (1.15–2.77); .01 1.82 (1.21–2.72); .004 2.39 (1.09–5.26); .03 2.36 (1.06–5.26); .04 ⭓5 1.00 1.00 1.00 1.00 Receiving PCP prophylaxis 0.42 (0.33–0.53);!.0001 0.49 (0.38–0.63);!.0001 0.22 (0.16–0.30);!.0001 0.27 (0.18–0.39);!.0001 Receiving MAC prophylaxis 1.17 (0.92–1.48); .19 1.28 (1.00–1.65); .05 0.98 (0.68–1.39); .90 1.17 (0.81–1.70); .40
NOTE. Data are rate ratio (95% confidence interval) and P value. BMI, bone mass index; MAC, Mycobacterium avium complex; PCP, Pneumocystis carinii pneumonia.
a
Based on 447.2 person-years of follow-up.
drugs relative to ⭓5 drugs was 1.43 (P p .07), 1.99 (P p
), 1.32 ( ), 1.04 ( ), and 3.00 ( ),
.0003 P p .21 P p .90 P1.0001
respectively. For death as outcome, the corresponding figures were 1.99 (P p .07), 3.42 (P p .0003), 2.83 (P p .006), 2.10 (P p .09), and 6.42 (P!.0001).
Discussion
In this analysis of patients with CD4 cell counts of!50 cells/ mm3, we found that disease progression and death are predicted by the latest CD4 cell count, hemoglobin measurement, BMI while receiving PCP prophylaxis, and number of drugs in the treatment regimen. AIDS status was a predictor for death only, and plasma HIV-1 RNA was a predictor for clinical progression only. Thus, our data suggest that it is helpful to continue an-tiviral therapy and prophylactic therapy, despite severe im-munodeficiency and regardless of plasma HIV RNA levels, and that the benefit due to each therapy is independent of the other. The association between the number of antiviral drugs used could indicate that receiving⭓5 drugs may be more beneficial than the standard 3-drug combination therapy for this patient population. An alternative explanation is that there is a “reverse causality,” such that the number of drugs a person is taking is a reflection of health status and that those patients able to manage more drugs have a lower risk of disease and death than those patients not able to take any or many drugs. This may also contribute to the strong effect attributable to PCP pro-phylaxis in our analysis.
In an attempt to reduce this reverse causality effect, we used the number of antiviral drugs a person was taking 3 months before the period of risk under consideration, rather than at the latest time. The greater this lag period, the less we would expect to see the influence of reverse causality; so, in a secondary
anal-ysis, this lag time was increased to 6 months. Although the mag-nitude of the association was reduced (as would be expected regardless of the direction of causality), a significant association was maintained, which suggests that a reverse causality effect is unlikely to fully explain the association.
The intensity of antiviral treatment appears to provide a treatment effect over and above that we can model with the surrogate markers of CD4 cells, virus load, use of prophylaxis, and the additional clinical markers of hemoglobin level and BMI. This effect may be due to the treatment itself and, as such, may be related to its potency or to the patient’s adherence or alternatively be due to some effect of the treatment that we cannot yet measure. It is possible that in the identification of patients taking more than the standard (3-drug combination) antiviral therapy, we selected for patients who had a longer treatment phase and who lived longer for as yet unknown rea-sons. Our additional analyses (time on antiviral therapy), how-ever, do not support this hypothesis.
Another finding of interest is that in patients with very low CD4 cell counts, the absolute number of CD4⫹cells does mat-ter. Thus, patients with CD4 cell counts of!10 cells/mm3fare worse than patients with CD4 cell counts of⭓10 cells/mm3. Of the 2 surrogate markers, CD4 cell count was a stronger pre-dictor for disease progression. Plasma HIV-1 RNA did not predict death in this patient population (P p .17). This is in agreement with previous studies that found CD4 cell count to be a better predictor for clinical progression in patients with very advanced HIV disease [19, 24].
In previous studies, hemoglobin was found to be a prognostic marker [18, 19, 25–27]. Anemia may be a marker of ongoing, as yet undiagnosed opportunistic disease or a marker of general immune activation. Weight was not previously associated with progression, and it is of interest that BMI (a measure of weight
standardized for height) was a prognostic marker in this study of patients with very advanced disease. It is likely that BMI is a better indicator of health status than weight alone. It will be of interest to confirm this finding in other studies.
Treatment management of patients with advanced HIV disease is becoming increasingly complex with issues of drug toxicity and requirement for comedications playing a significant role. In ad-dition, these patients frequently have had extensive prior treat-ment experience and are experiencing virologic failure.
In our study, 84% of the patients had plasma HIV-1 RNA levels 110,000 copies/mL, and 29% had been exposed to ⭓6 drugs. Our data raise the possibility that intensive antiretroviral treatment (⭓5 antiretroviral drugs) is of clinical benefit in this patient population. However, these results are based on follow-up in an observational cohort rather than by randomized as-signment to various treatment modalities. Thus, care should be taken in the interpretation of these findings. It will be of interest to compare our results with those of randomized trials that are currently underway to address the issue of treatment intensity in persons with advanced HIV disease and treatment failure. Our study spans from January 1998 to the first quarter of 2000. Although the availability of treatment choices may have in-creased during the study period, this is unlikely to have influ-enced our findings as calendar time was not identified as a predictor in any of the models tested.
The finding of an independent treatment benefit is in agreement with findings in prior studies [7, 8, 10, 16, 17], indicating a clinical and/or immunologic benefit to continuing treatment despite vi-rologic failure and (possibly) viral drug resistance. This treatment effect could be due to a residual activity of the regimen in spite of decreased drug susceptibility, changes in virus characteristics due to accumulation of drug resistance-associated mutations (de-creased fitness or replicative capacity and/or changes in patho-genicity), or to nonantiviral effects of the inhibitors. For example, HIV-1 PIs inhibit proteases of Candida albicans [28] and P. carinii [29] in in vitro models. In addition, they may be protective for CD4 cells against apoptosis [30].
We found that use of PCP prophylaxis was associated with a markedly reduced risk of new AIDS and/or deathaA. Al-though this likely partly reflects the efficacy of prophylaxis, it could also be due to reverse causality, as discussed above. How-ever, in contrast, use of MAC prophylaxis was associated with a somewhat raised rate of new AIDS/death, which was of bor-derline statistical significance (P p .05). This could reflect some residual confounding, with persons given such prophylaxis be-ing at increased risk of new AIDS/death due to factors not captured and adjusted for in the multivariable model. Ran-domized trials have shown clinical benefit for MAC prophy-laxis, and our results do not contradict the current recommen-dations for MAC prophylaxis [31].
Patients with low CD4 cell counts are at a high risk of clinical progression. Unfortunately, many such persons have experi-enced previous treatment failures, potentially have
drug-resis-tant virus, and may not have many therapeutic options avail-able to them. Although it is difficult to exclude the possibility that some of the association is due to reverse causality—with healthier people able to tolerate more drugs—our results sug-gest that keeping these patients on antiviral treatment never-theless is likely to be better than not giving any treatment at all. Although the risk-benefit evaluation should also include the risk for continued evolution of resistance [13, 32] and of pos-sible long-term drug toxicities, our findings add further evi-dence that the risk-benefit ratio for clinical progression weighs in favor of treatment continuation rather than interruption in patients with virologic failure.
EuroSIDA Study Group Members
Study group members are shown by country, with national coordinators in italics. Austria: N. Vetter (Pulmologisches Zen-trum der Stadt Wien, Vienna); Belgium: N. Clumeck, P. Her-mans, B. Sommereijns, (Saint-Pierre Hospital, Brussels) and R. Colebunders (Institut of Tropical Medicine, Antwerp); Czech Republic: L. Machala and H. Rozsypal (Faculty Hospital Bu-lovka, Prague); Denmark: J. Nielsen, J. Lundgren, T. Benfield, and O. Kirk (Hvidovre Hospital) and J. Gerstoft, T. Katzen-stein, B. Røge, and P. Skinhøj (Rigshospitalet, Copenhagen), and C. Pedersen (Odense University Hospital); France: C.
Kat-lama and C. Rivie`re (Hoˆpital de la Pitie´-Salpe´tie`re) and J.-P.
Viard (Hoˆpital Necker-Enfants Malades, Paris), T. Saint-Marc (Hoˆpital Edouard Herriot), P. Vanhems (University Claude Bernard, Lyon), and C. Pradier (Hoˆpital de l’Archet, Nice); Germany: M. Dietrich and C. Manegold (Bernhard-Nocht-In-stitut for Tropical Medicine), and J. van Lunzen (Eppendorf Medizinische Kernklinik, Hamburg), V. Miller and S. Stasz-ewski (J. W. Goethe University Hospital, Frankfurt), F.-D. Goebel (Medizinische Poliklinik, Munich), B. Salzberger (ersita¨t Ko¨ln, Cologne), Ju¨rgen Rockstroh (Medizinische Univ-ersita¨tsklinik, Bonn); Greece: P. Gargalianos, H. Sambatakou, and J. Perdios (Athens General Hospital), and G. Stergiou, G. Panos, G. Boulmetis, and M. Astriti, (1st IKA Hospital, Ath-ens); Hungary: D. Banhegyi (Szent La´slo´ Hospital, Budapest); Ireland: F. Mulcahy (St. James’s Hospital, Dublin); Israel: I.
Yust and D. Turner (Ichilov Hospital, Tel Aviv), S. Pollack and
Z. Ben-Ishai (Rambam Medical Center, Haifa), Z. Bentwich (Kaplan Hospital, Rehovot), S. Maayan (Hadassah University Hospital, Jerusalem); Italy: S. Vella, A. Chiesi (Istituto Super-iore di Sanita, Rome); F. Suter and A. Cremaschi (Ospedale Riuniti, Bergamo), R. Pristera´ (Ospedale Generale Regionale, Bolzano), F. Mazzotta and F. Vichi (Ospedale S. Maria An-nunziata, Florence), B. DeRienzo and A. Bedini (Universita` di Modena), A. Chirianni and V. Montesarchio (Presidio Ospe-daliero A. D. Cotugno, Naples), V. Vullo and P. Santopadre (Universita` di Roma La Sapienza) and C. Arrici, P. Franci, P. Narciso, A. Antinori and M. Zaccarelli (Ospedale Spallanzani, Rome), A. Lazzarin and R. Finazzi (Ospedale San Raffaele)
and A. D’Arminio Monforte (Ospedale L. Sacco, Milan); embourg: R. Hemmer and T. Staub (Centre Hospitalier, Lux-embourg); The Netherlands: P. Reiss (Academisch Medisch Centrum bij de Universiteit van Amsterdam); Norway: J.
Bruun, A. Mæland, and V. Ormaasen (Ulleva˚l University
Hos-pital, Oslo); Poland: B. Knysz and J. Gasiorowski (Medical University, Wroslaw), A. Horban (Centrum Diagnostyki i Ter-apii AIDS, Warszawa), R. Rogowska-Szadkowska (Medical University, Bialystok), A. Boron-Kaczmarska (Medical Uni-versity, Szczecin), M. Beniowski (Osrodek Diagnostyki i Terapii AIDS, Chorzow), H. Trocha (Medical University, Gdansk); Portugal: F. Antunes (Hospital Santa Maria), K. Mansinho (Hospital de Egas Moniz), and R. Proenca (Hospital Curry Cabral, Lisbon); Spain: J. Gonza´lez-Lahoz, R. Polo, and V. Soriano (Hospital Carlos III, Madrid), B. Clotet, A. Jou, J. Conejero, and C. Tural (Hospital Germans Trias i Pujol, Ba-dalona), J. Gatell and J. Miro´ (Hospital Clinic I Provincial, Barcelona); Sweden: A. Blaxhult (Karolinska Hospital), B. Hei-demann (So¨dersjukhuset), P. Pehrson (Huddinge Sjukhus, Stockholm); Switzerland: B. Ledergerber and R. Weber (Uni-versity Hospital, Zu¨rich), P. Francioli and A. Telenti (Centre Hospitalier Universitaire Vaudois, Lausanne), B. Hirschel and V. Soravia-Dunand (Hospital Cantonal Universitaire de Ge-neve, Geneva); United Kingdom: S. Barton (St. Stephen’s Clinic, Chelsea, and Westminster Hospital), A. M. Johnson and D. Mercy (University College London Medical School), A. Phillips, C. Loveday, M. A. Johnson, A. Mocroft, D. Wilson, T. Drinkwater, A. Dykoff and D. Ross (Royal Free and Uni-versity College Medical School), A. Pinching and J. M. Parkin (Medical College of Saint Bartholomew’s Hospital), J. Weber, D. Churchill, and G. Scullard (Imperial College School of Med-icine at St. Mary’s, London), M. Fisher (Royal Sussex County Hospital, Brighton), and R. Brettle (City Hospital, Edinburgh).
Steering committee. J. Nielsen (chair), N. Clumeck, M. Dietrich, J. M. Gatell, A. Horban, A. Johnson, C. Katlama, B. Ledergerber, C. Loveday, A. Phillips, P. Reiss, and S. Vella.
Coordinating center staff. J. Lundgren (project leader), I. Gjørup, T. Benfield, O. Kirk, A. Mocroft, D. Mollerup, M. Nielsen, A. Sørensen, H. Buch, and L. Teglbjærg.
References
1. Mocroft A, Vella S, Benfield T, et al. for the EuroSIDA study group. Chang-ing patterns of mortality in patients infected with HIV. Lancet 1998; 352: 1725–30.
2. Palella FJ, Delaney KM, Moorman AC, et al. Declining morbidity and mortality among patients with advanced human immunodeficiency virus infection. N Engl J Med 1998; 338:853–60.
3. Mocroft A, Miller V, Chiesi A, et al. Virological failure among patients on HAART from across Europe: results from the EuroSIDA study. Antivir Ther 2000; 5:107–12.
4. Ledergerber B, Egger M, Opravil M, et al. Clinical progression and virological failure on highly active antiretroviral therapy in HIV-1 patients: a pro-spective cohort study. Lancet 1999; 353:863–8.
5. Mellors JW, Munoz A, Giorgi JV, et al. Plasma virus load and CD4⫹
lym-phocytes as prognostic markers of HIV-1 infection. Ann Intern Med
1997; 126:946–54.
6. O’Brien WA, Hartigan PM, Daar ES, Simberkoff MS, Hamilton JD, for the VA Cooperative Study Group on AIDS. Changes in plasma HIV RNA levels and CD4⫹lymphocyte counts predict both response to antiretroviral
therapy and therapeutic failure. Ann Intern Med 1997; 126:939–45. 7. Kaufmann D, Pantaleo G, Sudre P, Telenti A, for the Swiss HIV Cohort
Study. CD4-cell count in HIV-1–infected individuals remaining viraemic with highly active antiretroviral therapy (HAART) [letter]. Lancet 1998; 351:723–4.
8. Deeks SG, Barbour JD, Martin JN, Swanson MS, Grant RM. Sustained CD4⫹T cell response after virologic failure of protease inhibitor–based
regimens in patients with human immunodeficiency virus infection. J In-fect Dis 2000; 181:946–53.
9. Be`lec L, Piketty C, Si-Mohammed A, et al. High levels of drug resistant human immunodeficiency virus variants in patients exhibiting increasing CD4⫹T cell counts despite virologic failure of protease inhibitor–containing anti-retroviral combination therapy. J Infect Dis 2000; 181:1808–12. 10. Miller V, Sabin C, Phillips AN, et al. The impact of protease
inhibi-tor–containing HAART on progression of HIV disease and its relationship to CD4 and viral load. AIDS 2000; 14:2129–36.
11. Miller V, Sabin C, Hertogs K, et al. Virological and immunological effects of treatment interruptions in HIV-1 infected patients with treatment fail-ure. AIDS 2000; 14:2857–67.
12. Deeks SG, Wrin T, Liegler T, et al. Virologic and immunologic consequences of discontinuing combination antiretroviral drug therapy in HIV-infected patients with detectable viremia. N Engl J Med 2001; 344:472–80. 13. Deeks S, Wrin T, Harris J, et al. Evolution of phenotypic drug susceptibility,
viral replication capacity and HIV-specific immune responses among pa-tients remaining on a stable protease inhibitor–based regimen despite long-term virological failure [abstract]. Antivir Ther 2000; 5(Suppl 3):107. 14. Montaner JS, Harrigan PR, Jahnke N, et al. Multiple drug rescue therapy
for HIV-infected individuals with prior virologic failure to multiple reg-imens. AIDS 2001; 15:117–9.
15. Katlama C, Duvivier C, Mouroux M, Legrand M, Chiesa E, Schneider L. GIGAHAART: a rescue therapy for HIV patients with multiple HAART failures [abstract]. Antivir Ther 1999; 4(Suppl 1):77.
16. Miller V, Mocroft A, Reiss P, et al. Relations among CD4 count nadir, antiretroviral therapy and HIV-1 disease progression: results from the EuroSIDA study. Ann Intern Med 1999; 130:570–7.
17. Mocroft A, Katlama C, Johnson AM, et al. for the EuroSIDA study group. The changing spectrum of AIDS across Europe: 1994–1998. Results from the EuroSIDA study. Lancet 2000; 356:291–6.
18. Mocroft A, Kirk O, Barton SE, et al, for the EuroSIDA Study Group. Anaemia is an independent predictive marker for the clinical prognosis in HIV-infected patients from across Europe. AIDS 1999; 13:943–50. 19. Lundgren JD, Mocroft A, Gatell JM, et al. A clinically prognostic scoring
system for patients receiving highly active antiretroviral therapy: results from the EuroSIDA study. J Infect Dis 2002; 185:178–87.
20. Lundgren JD, Phillips AN, Vella S, et al. Regional differences in use of antiretroviral agents and primary prophylaxis in 3122 European HIV-infected patients. J Acquir Immune Defic Syndr Hum Retrovirol 1997; 16:153–60.
21. Centers for Disease Control and Prevention. 1993 revised classification system for HIV infection and expanded surveillance case definition for AIDS among adolescents and adults. MMWR Recomm Rep 1992; 41:1–19. 22. Clayton D, Hills M. Statistical models in epidemiology. Oxford, UK: Oxford
University Press, 1993.
23. Liang KY, Zeger SL. Longitudinal data-analysis using generalised linear models. Biometrika 1986; 73:13–22.
24. Cozzi Lepri A, Katzenstein TL, Ullum H, et al. The relative prognostic value of plasma HIV RNA levels and CD4 lymphocyte counts in advanced HIV infection. AIDS 1998; 12:1639–43.
Long-term survival in patients with advanced immunodeficiency. AIDS
1997; 11:209–16.
26. Hoover DR, Rinaldo C, He Y, Phair J, Fahey J, Graham NMH. Long-term survival without clinical AIDS after CD4⫹cell counts fall below 200⫻
106
/L. AIDS 1995; 9:145–52.
27. Saah AJ, Hoover DR, He Y, Kingsley LA, Phair JP. Factors influencing survival after AIDS: report from the multicentre AIDS Cohort Study (MACS). J Acquir Immune Defic Syndr 1994; 7:287–95.
28. Cassone A, De Bernardis F, Torosantucci A, Tacconelli E, Tumbarello M, Cauda R. In vitro and in vivo anticandidal activity of human immuno-deficiency virus protease inhibitors. J Infect Dis 1999; 180:448–53.
29. Atzori C, Angeli E, Manini A, Agostoni F, Micheli V, Cargnel A. In vitro activity of human immunodeficiency virus protease inhibitors against
Pneumocystis carinii. J Infect Dis 2000; 181:1629–34.
30. Phenix BN, Angel JB, Mandy F, et al. Decreased HIV-associated T cell apoptosis by HIV protease inhibitors. AIDS Res Hum Retroviruses 2000; 16:559–67. 31. USPHS/IDSA Prevention of Opportunistic Infections Working Group. 1999 USPHS/IDSA guidelines for the prevention of opportunistic infections in persons infected with human immunodeficiency virus. MMWR Recomm Rep 1999; 48:1–66.
32. Kaufmann D, Munoz M, Bleiber G, et al. Virological and immunological characteristics of HIV treatment failure. AIDS 2000; 14:1767–74.