Human Immunodeficiency Virus Type 1 p24 Concentration Measured
by Boosted ELISA of Heat-Denatured Plasma Correlates with Decline
in CD4 Cells, Progression to AIDS, and Survival: Comparison with Viral
RNA Measurement
Bruno Ledergerber,1Markus Flepp,1Ju¨rg Bo¨ni,2 Zuzana Tomasik,2Richard W. Cone,1Ruedi Lu¨thy,1,a and Jo¨rg Schu¨pbach2
1Division of Infectious Diseases, Department of Medicine, Zurich
University Hospital, and2Swiss National Center for Retroviruses,
University of Zurich, Zurich, Switzerland
Human immunodeficiency virus type 1 (HIV-1) RNA and p24 antigen concentrations were determined in plasma samples from 169 chronically infected patients (median CD4 cell count, 140 cells/mL; range, 0–1500 cells/mL). p24 quantification involved heat-mediated immune com-plex dissociation and tyramide signal amplification–boosted ELISA, which has a diagnostic sensitivity similar to that of RNA quantification by a commercial polymerase chain reaction kit. In Cox’s proportional hazard models adjusted for CD4 cell count, both RNA (P!.005) and p24 (P = .043) levels were significant predictors of progression to AIDS. Measurement of p24 was superior to measurement of RNA in the model for survival (P = .032 vs.P = ). p24 level was a significant predictor of CD4 cell decline in models adjusted for CD4 cell .19
counts and was superior or equivalent to RNA level, depending on the group analyzed. Stratification by CD4 cell counts at baseline showed that the superiority of p24 measurement was more pronounced at lower levels of CD4 cells (!200/mL). p24 level may be of interest as a simple and inexpensive predictive marker of disease progression.
Virus load measurements have become indispensable in the management of patients infected with the human immunode-ficiency virus (HIV). Most virus is produced, and resides, in lymphatic tissues, where routine assessment is difficult [1–3]. Virus markers in plasma, specifically the viral RNA concen-tration, have therefore become a regularly used surrogate for the total virus load and are predictive of decline in CD4 cells, progression to AIDS, and survival [4–11]. In contrast, there is an agreement that quantification of the HIV-1 load by p24 antigen tests with native serum or after acid-mediated immune complex dissociation is unsuitable for this purpose, because these tests are relatively insensitive and therefore have a limited utility in clinical practice [12]. However, because many
mech-Received 8 June 1999; revised 27 October 1999; electronically published 4 April 2000.
Presented in part: 4th European Conference on Experimental AIDS Re-search, Tampere, Finland, 18–21 June 1999 (abstract 23); and 1999 Inter-national Meeting of the Institute of Human Virology, Baltimore, 28 Au-gust–2 September 1999 (abstract 269).
Informed consent was obtained from all study patients, and the study was conducted according to the guidelines of the Swiss Academy of Medical Sciences.
Financial support: Swiss Federal Office of Public Health; Swiss Foun-dation for AIDS Research (CCRS); and Swiss National Science FounFoun-dation (grant 31-39043.93).
a Present affiliation: Klinik im Park, Zurich.
Reprints or correspondence: Dr. J. Schu¨pbach, Swiss National Center for Retroviruses, University of Zurich, Gloriastrasse 30, CH-8028 Zurich, Swit-zerland ([email protected]).
The Journal of Infectious Diseases 2000; 181:1280–7
q 2000 by the Infectious Diseases Society of America. All rights reserved. 0022-1899/2000/18104-0007$02.00
anisms of viral pathogenicity involve proteins as the direct or indirect mediators of disease, there is a theoretical possibility that the concentration of viral proteins in the various body compartments might be a better predictor of disease progres-sion than is the particle-associated viral RNA and that the observed inferiority of antigen testing might thus be due merely to a technical inadequacy of the procedures used.
In previous work, we have demonstrated that p24 detection, by use of an ELISA coupled with tyramide signal amplification after heat-mediated immune complex dissociation [13], detects viral protein as sensitively as polymerase chain reaction detects viral DNA or RNA [14, 15]. The high diagnostic quality of the amplification-boosted p24 assay was also confirmed by others who used the procedure in a study of African children who were vertically exposed to HIV-1 [16]. A retrospective study of adults confirmed the high sensitivity of the procedure and dem-onstrated that treatment-induced changes in the concentrations of viral protein correlate very well with those in viral RNA, as measured by the Amplicor HIV-1 monitor (version 1.0; Roche Molecular Systems, Basel, Switzerland) with a detection limit of 200–400 copies/mL [17]. A prospective study with real-time analyses over 4 years among children born to HIV-positive mothers also demonstrated a diagnostic sensitivity and speci-ficity of p24 testing equal to those of testing for RNA and demonstrated the suitability of this marker for monitoring an-tiretroviral treatment [18]. These results suggest that measure-ment of viral protein could be used as an alternative to RNA detection for the diagnosis of HIV-1 infection and treatment monitoring.
JID 2000;181 (April) Predictive Value of HIV-1 p24 and RNA 1281
In the present study, we addressed the question of whether the p24 concentration in plasma is as predictive of clinical and laboratory progression as is the viral RNA concentration. A single plasma sample from each patient among a cohort rep-resenting all stages of chronic HIV-1 infection was drawn in 1993–1994 [15]. The concentrations of viral protein and RNA in this baseline sample were batchwise determined and related to the ensuing changes in CD4 cell count, progression to clinical AIDS, and survival.
Patients and Methods
Patients and samples. The 169 patients (131 men and 38 women) were derived from a group of 245 patients from the Zurich center of the Swiss HIV Cohort Study, whose plasma was used for a comparison of various antigen test procedures between 5 January 1993 and 27 May 1994 [15]. The study design and recent results of the Swiss HIV Cohort Study have been published elsewhere [19–21]. In brief, enrollment of HIV-1–infected persons aged>16 years into the cohort is independent of disease stage or degree of immunosuppression, and information is collected prospectively ac-cording to standardized criteria on structured forms at registration and at follow-up visits, which are scheduled at 6-month intervals. Routine laboratory results from intermediate visits are included. For the present study, a single EDTA-anticoagulated plasma spec-imen from each patient was analyzed, and the sole inclusion cri-terion was whether sufficient material was available for testing. In March 1998, clinical and laboratory follow-up data from the 169 patients were extracted from the database of the Swiss HIV Cohort Study, which included information up to 9 February 1998. Clinical progression to AIDS was strictly defined on the basis of AIDS indicator diseases [22].
Among the 169 patients, the risk factors for contracting HIV-1 were homosexual contact (51%), injection drug use (31%), hetero-sexual contact (14%), or unknown (4%). Participants with a history of injection drug use who also had heterosexual contacts were clas-sified as injection drug users. Fifty-nine (35%) of the patients were in CDC disease stage A, 49 (29%) in stage B, and 61 (36%) in stage C. The median CD4 cell count at baseline was 140 cells/mL (range, 0–1500 cells/mL), with the 10th, 25th, 75th, and 90th percentiles at 10, 30, 312.5, and 510 cells/mL, respectively. Ninety (53.3%) of the patients were receiving no antiretroviral treatment, 69 (40.8%) were being treated with a single nucleoside analogue reverse-transcrip-tase inhibitor, and 10 (5.9%) were receiving a combination of 2 nucleoside analogue reverse-transcriptase inhibitors. No patient was receiving treatment with protease inhibitors (PIs) at baseline. Quantification of viral components. Viral protein p24 concen-tration in heat-denatured plasma was assessed by batch analysis of blinded samples. In brief, 100 mL of plasma was diluted with 500 mL of 0.5% Triton X-100 in 1.5-mL Eppendorf tubes, subjected to 5 min of heat denaturation at 1007C on a Techne (Cambridge, UK) dry heat block, and tested in duplicate with the NEN/Du Pont HIV-1 Core Profile ELISA in combination with the ELAST ELISA Amplification System (both from NEN Life Science Prod-ucts, Geneva, Switzerland), as described elsewhere [15]. The re-action product was quantified on a Dynatech MR5000 ELISA reader (Microtech Produkte, Embrach, Switzerland). Samples with
protein concentrations above the assay range were retested by use of kinetic analysis with the Quanti-Kinc Detection System (Tib Molbiol, Genoa, Italy). This permitted quantification in a range of∼400–6,250,000 fg/mL with a single sample dilution.
HIV-1 RNA concentrations were determined by batch analysis in plasma samples that had been frozen at2707C no later than 4 h after the sample was drawn and had not been thawed before testing. For testing, the Amplicor HIV monitor, version 1.0 (Roche Molecular Systems), with a detection limit of 200–400 copies/mL, was used.
Data analysis. The StatView 5.0 program for Macintosh (SAS Institute, Cary, NC) was used for plotting figure 1 and for calcu-lating this figure’s linear and locally weighted regression curves, by means of a locally weighted scatter plot smoother (lowess) based on a least-squares fit, with a tension of 66%.
For analysis of predictive values, data were analyzed by use of SAS software, version 6.11 (SAS Institute). Differences between groups were analyzed by x2
tests, analysis of variance (ANOVA), or t tests.
Prediction of CD4 cell slopes. Individual CD4 cell slopes were determined by use of linear regressions of CD4 cell counts ( 6L) for all patients with>2 CD4 cell measurements over
cells3 10 /
time (n = 136). To control for the possible effects of antiretroviral therapies on the evolution of CD4 cell values, several subgroups of CD4 cell values were analyzed separately: (1) all available CD4 cell values with dates greater than or equal to the baseline evalu-ation; (2) CD4 cell values restricted to dates before a therapy in-cluding a PI was started for an individual patient; (3) CD4 cell values restricted to dates before any antiretroviral therapy was started; and (4) CD4 cell values restricted to a period after baseline with unchanged antiretroviral therapy for16 months, antiretroviral therapy discontinued>2 months before baseline, or never having received antiretroviral therapy. Associations between individual CD4 cell slopes and baseline values of p24 antigen and plasma HIV RNA level were compared by use of Spearman’s rank cor-relation coefficients.
Prediction of clinical progression. Kaplan-Meier analysis and Cox’s proportional hazards regression models were used to analyze the risk of progression to a first diagnosis of AIDS or death across quartiles of baseline plasma levels for p24 antigen and HIV RNA [20, 21]. We measured times until either the attainment of the re-spective end point or the date of the most recent follow-up visit. The analyses of progression to clinical AIDS were restricted to 108 patients in clinical stage A or B. To compare the predictive values of plasma p24 protein and plasma HIV RNA levels, these were entered in separate proportional hazard models that were adjusted for disease stage, transmission category, sex, age in increments of 10 years, and CD4 cell count. CD4 cell counts (11 [added to avoid log0in patients with no detectable CD4 cells]) were log-transformed and entered as a continuous variable. In addition, beginning PI-containing therapy was entered as a time-dependent covariate. Re-sults are presented as risk ratios with 95% confidence intervals. Proportional hazard assumptions were tested on the basis of Schoenfeld residuals [23].
Results
Up to February 1998, the 169 patients (131 men and 38 women) selected for this study contributed 431 person-years of
Figure 1. Viral RNA and p24 concentrations in relation to CD4 cell count. Semilogarithmic and double-logarithmic representations are given to make changes at very low CD4 cell counts more visible. Narrow lines represent linear regression; boldface lines represent lowess regression with 66% tension. One CD4 cell count of 1500 was treated as an outlier and was excluded from analysis. Undet., undetectable.
follow-up (median, 2.7 years; range, 0.09–4.9 years). Eighty-three patients died. At baseline and during follow-up, a total of 1291 CD4 cell counts were recorded, with a median of 7 determinations (range, 1–29 determinations) per patient. Base-line viral RNA and protein concentrations were determined batchwise in a blinded fashion from 169 plasma samples (1 per patient) collected in 1993–1994. All samples had detectable viral protein, and all but 2 were positive for viral RNA. For quan-titative evaluations, the copy number of the 2 RNA-negative samples (both from patients in stage A2 with 600 and 1000 fg/ mL of viral protein, respectively) was set to 100/mL. Expressed as quartiles, median baseline RNA concentrations were 3293 copies/mL for quartile 1; 29,262 copies/mL for quartile 2; 83,389 copies/mL for quartile 3; and 204,558 copies/mL for quartile 4. The respective concentrations of p24 antigen were 1700 fg/mL for quartile 1; 15,000 fg/mL for quartile 2; 31,000 fg/mL for quartile 3; and 200,500 fg/mL for quartile 4. For the 108 patients free of clinical AIDS at baseline, the corresponding values for quartiles 1–4 were 2394, 23,766, 82,933, and 175,155
copies/mL, respectively, for RNA and 1550, 16,400, 41,500 and 149,000 fg/mL, respectively, for viral p24 antigen.
Viral protein and RNA concentrations at baseline were sig-nificantly correlated in the 169 samples (SpearmanR = .525; ). Correlations were similar for patients in stages A–C
P!.0001
(as defined by the CDC 1993 classification) [22], as well as in CD4 cell categories 1–3 (data not shown). Mean viral RNA levels, as shown by the lowess regression curve, increased little as CD4 cell counts went down to 400 but rose with an increasing angle when CD4 cell counts dropped below this mark (figure 1A). Linear regression showed a highly significant correlation with CD4 cell count (Spearman R =2.578 P; !.0001), al-though the curve did not fit well with lowess regression. A log representation of the CD4 cell counts, which gives a better resolution in the range of low counts, showed that the mean RNA concentration, as assessed by lowess regression, reached a plateau at ∼1.5 logs (CD4 cell count, 30 cells/mL) and did not increase any further at lower CD4 cell counts (figure 1B). Mean p24 levels increased very gradually from early to late
JID 2000;181 (April) Predictive Value of HIV-1 p24 and RNA 1283
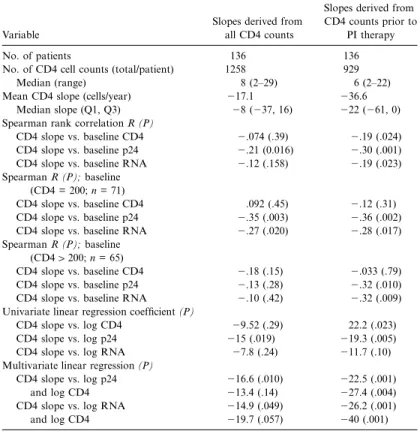
Table 1. Prediction of CD4 lymphocyte depletion by viral p24 or RNA con-centrations at baseline.
Variable
Slopes derived from all CD4 counts
Slopes derived from CD4 counts prior to
PI therapy
No. of patients 136 136
No. of CD4 cell counts (total/patient) 1258 929
Median (range) 8 (2–29) 6 (2–22)
Mean CD4 slope (cells/year) 217.1 236.6
Median slope (Q1, Q3) 28 (237, 16) 222 (261, 0) Spearman rank correlation R (P)
CD4 slope vs. baseline CD4 2.074 (.39) 2.19 (.024) CD4 slope vs. baseline p24 2.21 (0.016) 2.30 (.001) CD4 slope vs. baseline RNA 2.12 (.158) 2.19 (.023) Spearman R (P); baseline
(CD4 = 200; n = 71)
CD4 slope vs. baseline CD4 .092 (.45) 2.12 (.31) CD4 slope vs. baseline p24 2.35 (.003) 2.36 (.002) CD4 slope vs. baseline RNA 2.27 (.020) 2.28 (.017) Spearman R (P); baseline
(CD41200; n = 65)
CD4 slope vs. baseline CD4 2.18 (.15) 2.033 (.79) CD4 slope vs. baseline p24 2.13 (.28) 2.32 (.010) CD4 slope vs. baseline RNA 2.10 (.42) 2.32 (.009) Univariate linear regression coefficient (P)
CD4 slope vs. log CD4 29.52 (.29) 22.2 (.023) CD4 slope vs. log p24 215 (.019) 219.3 (.005) CD4 slope vs. log RNA 27.8 (.24) 211.7 (.10) Multivariate linear regression (P)
CD4 slope vs. log p24 216.6 (.010) 222.5 (.001)
and log CD4 213.4 (.14) 227.4 (.004)
CD4 slope vs. log RNA 214.9 (.049) 226.2 (.001)
and log CD4 219.7 (.057) 240 (.001)
stages of disease, and the lowess regression curve followed the linear regression curve very closely (linearregression =2.183; ). p24 concentrations in early immunodeficiency (CD4
P = .0178
cell count, 200–500 cells/mL), compared with the cross-sectional distributions, tended to be relatively higher than the corre-sponding RNA levels, whereas the reverse situation was ob-served at low CD4 cell counts. In consequence, the slope of the linear regression curve for p24 was less steep than that for RNA, and the lowess regression curve was without the distinct terminal increase seen with RNA at very low CD4 cell counts (figure 1C). Peak average p24 levels were achieved in patients with CD4 cell counts of 30. Remarkably, at even lower CD4 cell counts, these levels dropped again and were negatively cor-related with the CD4 cell count (ANOVA, P = .0308; figure 1D). Antiretroviral treatment with 1 or 2 nucleoside analogue reverse-transcriptase inhibitors did not significantly change these cross-sectional virus load distributions (not shown).
Predictive values. To assess the predictive values of viral protein and RNA concentrations, follow-up data, including at least 1 further CD4 cell count and assessment of clinical stage, were available for 136 of the patients from the Swiss HIV Co-hort Study database, with a median observation period of 2.7 years (range, 0.09–4.9 years). Fifty-nine patients (35%) had clin-ical AIDS at baseline, and another 35 patients (21%) developed AIDS during follow-up. Eighty-three patients (49%) died
dur-ing follow-up. The median number of CD4 cell counts available for calculation of slopes, including the baseline value, was 8 per patient (range, 2–29 CD4 cell counts).
Prediction of CD4 cell slopes. Baseline concentrations of
CD4 cells, p24, and RNA were related by various methods to the ensuing CD4 cell slopes available from 136 patients, as shown in table 1. For calculation of the CD4 cell slopes, either all available CD4 cell counts after baseline or only those before onset of treatment with a PI were included in the analyses. In both groups and by all analyses, the baseline concentrations of p24 were significantly correlated with the ensuing CD4 cell slopes, except for patients with baseline CD4 cell counts1200 when analyzed by Spearman rank correlation. When the slopes were restricted to CD4 cell counts determined during the period before PI therapy, correlations of p24 antigen and HIV RNA levels with the CD4 cell slope were markedly better in most analyses, compatible with the observation that PI-containing drug combinations are capable of reversing the depletion in CD4 cells. The slopes before PI therapy, therefore, represent the natural course of CD4 cell depletion better than do those derived from all available CD4 cell counts. In theory, the period free of any therapy would be even more suitable. However, there were only 35 patients for this analysis, and there were no significant correlations (not shown). Similarly, when CD4 cell counts in a period of unchanged treatment were analyzed for
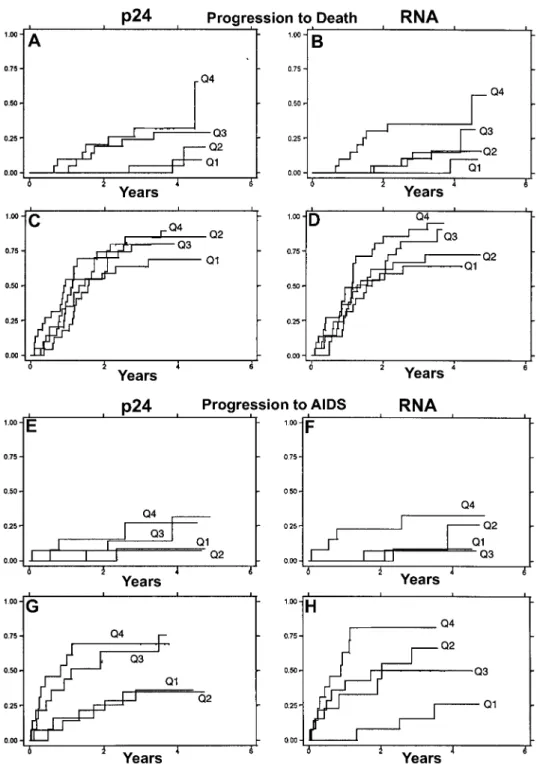
Figure 2. Kaplan-Meier analysis of quartiles of viral RNA and p24 concentrations with respect to survival and progression to clinical AIDS, stratified for baseline CD4 cell count. A–D, Fraction progressing to death among 169 patients; A and B, 83 patients with CD4 cell counts1140/ mL median; C and D, 86 patients with CD4 cell counts<140/mL. E–H, Progression to clinical AIDS among 108 patients; E and F, 54 patients with CD4 cell counts1255/mL median; G and H, 54 patients with CD4 cell counts<255/mL.
75 available patients, there were no significant correlations with p24 or RNA levels (not shown).
p24 was a better predictor of CD4 cell depletion than was RNA in all Spearman analyses, except for patients with CD4 cell counts1200, for whom the predictive values of RNA and
p24 antigen were about equal. p24 level prevailed over RNA level in univariate linear regression analyses. In multivariate analysis, which also adjusted for the baseline CD4 cell count, p24 level was superior to RNA level with the slopes derived from all CD4 cell counts and equal to RNA level for slopes
JID 2000;181 (April) Predictive Value of HIV-1 p24 and RNA 1285
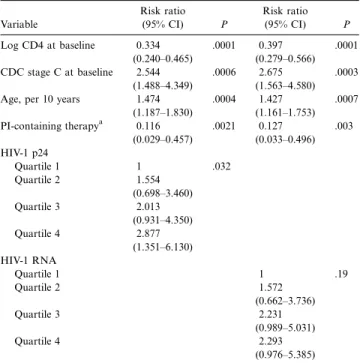
Table 2. Multivariate Cox proportional hazard regression of survival (169 patients, 83 events). Variable Risk ratio (95% CI) P Risk ratio (95% CI) P Log CD4 at baseline 0.334 (0.240–0.465) .0001 0.397 (0.279–0.566) .0001 CDC stage C at baseline 2.544 (1.488–4.349) .0006 2.675 (1.563–4.580) .0003 Age, per 10 years 1.474
(1.187–1.830) .0004 1.427 (1.161–1.753) .0007 PI-containing therapya 0.116 (0.029–0.457) .0021 0.127 (0.033–0.496) .003 HIV-1 p24 Quartile 1 1 .032 Quartile 2 1.554 (0.698–3.460) Quartile 3 2.013 (0.931–4.350) Quartile 4 2.877 (1.351–6.130) HIV-1 RNA Quartile 1 1 .19 Quartile 2 1.572 (0.662–3.736) Quartile 3 2.231 (0.989–5.031) Quartile 4 2.293 (0.976–5.385) NOTE. Model was adjusted for all variables listed. CI, confidence interval; PI, protease inhibitor; HIV-1, human immunodeficiency virus type 1.
a
Entered as time-dependent variable.
from before PI treatment. In conclusion, p24 level was a sig-nificant predictor of CD4 cell decline in models adjusted for CD4 cell counts and was superior or equivalent to RNA level when all available CD4 cell values or CD4 cell values from dates before the commencement of PI therapy were used. Strat-ification by CD4 cell counts at baseline (<200 vs.1200) showed that the superiority of p24 level was more pronounced at lower CD4 cell counts. The CD4 cell count at baseline was a signif-icant covariate in some but not all groups.
Prediction of survival. Because baseline CD4 cell counts
were likely to influence the progression rate, Kaplan-Meier curves were stratified for CD4 cell counts (figure 2). Among 83 patients with CD4 cell counts above the median of 140/mL, the curves were similar for p24 (figure 2A) and RNA levels (figure 2B). For p24 levels, the courses of quartile 1 compared with quartile 2 and of quartile 3 compared with quartile 4 were similar, whereas for RNA levels, quartile 1 and quartile 4 moved separately (although not differently from quartile 1 or, respec-tively, quartile 4 of p24), but quartile 2 ran together with quar-tile 3. Among the 86 patients with CD4 cell counts<140/mL, both markers showed little discrimination regarding progres-sion, and all quartile curves rose steeply and in 1 group during at least the first year of follow-up. For further analysis, p24 was compared with RNA level in separate multivariate Cox proportional hazard models, which were adjusted for CD4 cell count, disease stage C, age, and starting a PI-containing regi-men (table 2). Transmission category and sex did not reach
statistical significance in univariate and multivariate analyses and therefore were dropped from the final model. The results of this analysis indicated that viral protein level, but not viral RNA level, was a significant independent prognostic factor of survival (P = .032vs.P = .19).
Prediction of progression to clinical AIDS. Among the 54
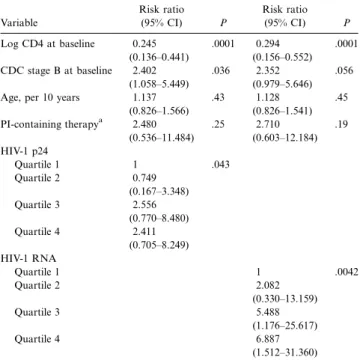
patients with baseline CD4 cell counts above the median of 255 cells/mL, the Kaplan-Meier curves of p24 and RNA levels were again similar (figure 2E and 2F). Quartile 4 of RNA was better separated from the other quartiles than was quartile 4 of p24, which was not different from quartile 3. In the 54 patients with CD4 cell counts<255/mL, p24 level again showed the pattern of quartile 1 moving with quartile 2 and quartile 4 moving with quartile 3; on the other hand, for RNA level, there was a very clear separation of quartile 1 and quartile 4 from each other and, for both of them, from quartile 2 and quartile 3 (figure 2G and 2H). Log-rank testing (not stratified for CD4 cell count) clearly showed RNA level to be superior to p24 level (table 3). Multivariate Cox proportional hazard regression analyses in-dicated that clinical progression correlated highly significantly with baseline RNA levels but only weakly with p24 levels. De-spite an overall significant correlation (P = .043), none of the individual p24 quartiles had risk ratios that excluded the value 1. In agreement with figure 2, there also appeared to be no increase in the risk ratios of quartiles 3 and 4 of p24.
Discussion
There is ample evidence that the concentration of viral RNA in serum or plasma is predictive of disease progression. A cor-relation of baseline RNA levels with clinical progression and/ or survival was found during the first 6–12 months after se-roconversion [9, 24, 25] among both patients who were asymptomatically infected [26] and patients with or without symptoms who had relatively well-preserved numbers of CD4 cells [10, 27, 28]. In more advanced disease, the predictive value of RNA was less evident, but the importance of CD4 cell count increased [29–32]. Some of these studies also assessed the pre-dictive value of p24 antigen [28, 32–34]. In all, p24 was less frequently detectable than was viral RNA. In 2 studies, p24 was never significant when included together with RNA into multivariate proportional hazards models [28, 32]. However, in 2 studies investigating patients early after seroconversion, the detectability of p24 antigen was found to be a stronger predictor of AIDS than was RNA concentration [34], even when analyzed by multivariate Cox proportional hazard models [33].
In the present study, we compared viral RNA and p24 con-centrations, as measured by a method combining heat-medi-ated immune complex dissociation with signal amplification– boosted ELISA, in a single plasma sample taken in 1993–1994, before the availability of highly active antiretroviral treatment, from patients at various stages of chronic HIV infection. The advantages of this antigen detection consist in its high analytical
Table 3. Multivariate Cox proportional hazard regression of pro-gression to AIDS (108 patients free of AIDS at baseline, 35 events).
Variable Risk ratio (95% CI) P Risk ratio (95% CI) P Log CD4 at baseline 0.245 (0.136–0.441) .0001 0.294 (0.156–0.552) .0001 CDC stage B at baseline 2.402 (1.058–5.449) .036 2.352 (0.979–5.646) .056 Age, per 10 years 1.137
(0.826–1.566) .43 1.128 (0.826–1.541) .45 PI-containing therapya 2.480 (0.536–11.484) .25 2.710 (0.603–12.184) .19 HIV-1 p24 Quartile 1 1 .043 Quartile 2 0.749 (0.167–3.348) Quartile 3 2.556 (0.770–8.480) Quartile 4 2.411 (0.705–8.249) HIV-1 RNA Quartile 1 1 .0042 Quartile 2 2.082 (0.330–13.159) Quartile 3 5.488 (1.176–25.617) Quartile 4 6.887 (1.512–31.360) NOTE. Model was adjusted for all variables listed. CI, confidence interval; PI, protease inhibitor; HIV-1, human immunodeficiency virus type 1.
a
Entered as time-dependent variable.
sensitivity and broad quantification range (0.5–6400 pg/mL) and its irreversibly releasing all antigen from immune com-plexes. This sets the procedure apart from acid- or base-me-diated immune complex dissociation, in which the pH neu-tralization that has to be achieved before the actual antigen test can be done may lead to a partial recomplexation of the antigen, resulting in individually unpredictable underdetection [13].
An important advantage of the procedure compared with quantification of viral RNA is its simplicity and its considerably lower cost. In Switzerland, p24 quantification costs only 18% of the price of viral RNA quantification. Although samples from both early and advanced disease stages were investigated in the present study, there were few patients with CD4 cell counts1500/mL, and the study cohort was representative of the moderately advanced and more advanced stages of disease. The results show that p24 level at baseline was a significant predictor of CD4 cell decline in models adjusted for CD4 cell counts and was superior or equivalent to RNA level, superior especially at CD4 cell counts <200 (table 1). We also found that p24 concentration, but not RNA concentration, was a significant independent predictor of survival in multivariate Cox regression analysis (table 2). However, RNA level was a highly significant independent predictor of progression to AIDS, whereas p24 level was only weakly significant (table 3).
The progressive loss of CD4 cells is the basis for the occur-rence of opportunistic infections or tumors (signs and
symp-toms of clinical AIDS), which finally lead to death. Because baseline p24 levels correlated well with depletion rates of CD4 cells, one would expect that p24 level would equally well predict clinical progression and survival. We are currently unable to explain conclusively why p24 level should be a better predictor of survival and RNA level a better predictor of clinical pro-gression. It is particularly puzzling that viral RNA level, which is markedly inferior to p24 level in prediction of the CD4 cell slope in patients with CD4 cell counts<200 (table 1), should in this very group be superior to p24 level in predicting pro-gression to AIDS, as suggested by the Kaplan-Meier analysis (figure 2G and 2H).
This discrepancy suggests that—independent of CD4 cell de-pletion—there could be an additional mechanism that would account for both a high viral RNA (but not p24) load in plasma and an increased progression to AIDS. Histopathologic anal-ysis has shown an almost complete destruction of the lymph node architecture and fine structure in advanced HIV infection, and it is assumed that this loss of functional structure contrib-utes significantly to the immunodeficiency [35]. One particular feature of this destruction is the loss of the follicular dendritic cell network, which is known to serve as a kind of filter that retains the particles produced in the lymphatics [1, 2, 35, 36]. Recent studies have indicated a virus half-time of only a few minutes [37]. A considerable fraction of particles should thus be eliminated while they are entangled within the follicular den-dritic cell network. When the network is destroyed, significantly more particles would reach the bloodstream, thus increasing the viral RNA load in plasma. In contrast, p24 antigen should pass freely through the network, owing to its small size and its higher resistance to degradation. The destruction of the follic-ular dendritic cell network would thus not be mirrored by a concomitant increase in plasma antigenemia. A discrepancy of p24 and viral RNA concentrations in patients with very low CD4 cell counts is indeed seen in figure 1 and is particularly manifest when only the untreated patients are compared (not shown).
The increasing RNA concentration in advanced disease could thus reflect that not only the CD4 cells but also the lymph node structure is destroyed and therefore could indicate a particularly severe status of immunodeficiency, which renders the patient highly vulnerable to AIDS-defining illnesses. The fact that the virus load, as measured by both p24 and RNA levels, appears to be of no importance during the last 1–2 years before death (i.e., in the very period during which AIDS is most likely to occur), as shown by the Kaplan-Meier analyses of figure 2C and 2D, further supports the interpretation that it is not a higher production of virus particles that is responsible for rapid clinical progression in this advanced stage.
Taken together, the present study provides preliminary evi-dence that HIV p24 concentrations, as detected by this signif-icantly improved procedure, may be a valuable predictive marker for certain aspects of disease progression. Larger studies
JID 2000;181 (April) Predictive Value of HIV-1 p24 and RNA 1287
with more homogenous patient populations at defined stages of CD4 cell deficiency are now needed to resolve the inconsis-tencies discussed above. If these results can be confirmed and perhaps even improved, this simple, inexpensive, and easily au-tomatable procedure, which does not require cumbersome sam-ple transport and pretreatment procedures, might contribute to improvements in the monitoring and treatment of HIV infec-tions worldwide.
Acknowledgments
We thank Soksimon Kaing for excellent technical assistance and Matthias Egger for statistical advice.
References
1. Pantaleo G, Graziosi C, Demarest JF, et al. HIV infection is active and progressive in lymphoid tissue during the clinically latent stage of disease. Nature 1993; 362:355–8.
2. Embretson J, Zupancic M, Ribas JL, et al. Massive covert infection of helper T lymphocytes and macrophages by HIV during the incubation period of AIDS. Nature 1993; 362:359–62.
3. Haase AT, Henry K, Zupancic M, et al. Quantitative image analysis of HIV-1 infection in lymphoid tissue. Science HIV-1996; 274:985–9.
4. Piatak M Jr, Saag MS, Yang LC, et al. High levels of HIV-1 in plasma during all stages of infection determined by competitive PCR. Science 1993; 259: 1749–54.
5. Wei X, Ghosh SK, Taylor ME, et al. Viral dynamics in human immuno-deficiency virus type 1 infection. Nature 1995; 373:117–22.
6. Ho DD, Neumann AU, Perelson AS, Chen W, Leonard JM, Markowitz M. Rapid turnover of plasma virions and CD4 lymphocytes in HIV-1 infec-tion. Nature 1995; 373:123–6.
7. Cao Y, Ho DD, Todd J, et al. Clinical evaluation of branched DNA signal amplification for quantifying HIV type 1 in human plasma. AIDS Res Hum Retroviruses 1995; 11:353–61.
8. Henrard DR, Daar E, Farzadegan H, et al. Virologic and immunologic char-acterization of symptomatic and asymptomatic primary HIV-1 infection. J Acquir Immune Defic Syndr Hum Retrovirol 1995; 9:305–10. 9. Mellors JW, Kingsley LA, Rinaldo CR Jr, et al. Quantitation of HIV-1 RNA
in plasma predicts outcome after seroconversion. Ann Intern Med
1995; 122:573–9.
10. Mellors JW, Rinaldo CR Jr, Gupta P, White RM, Todd JA, Kingsley LA. Prognosis in HIV-1 infection predicted by the quantity of virus in plasma. Science 1996; 272:1167–70.
11. Loveday C, Kaye S, Tenant-Flowers M, et al. HIV-1 RNA serum-load and resistant viral genotypes during early zidovudine therapy. Lancet 1995; 345:820–4.
12. Hammer SM. Advances in antiretroviral therapy and viral load monitoring. AIDS 1996; 10:S1–11.
13. Schupbach J, Boni J. Quantitative and sensitive detection of immune-com-plexed and free HIV antigen after boiling of serum. J Virol Methods
1993; 43:247–56 (erratum: J Virol Methods 1993; 45:245).
14. Schupbach J, Boni J, Tomasik Z, Jendis J, Seger R, Kind C. Sensitive de-tection and early prognostic significance of p24 antigen in heat-denatured plasma of human immunodeficiency virus type 1–infected infants. Swiss Neonatal HIV Study Group. J Infect Dis 1994; 170:318–24.
15. Schupbach J, Flepp M, Pontelli D, Tomasik Z, Luthy R, Boni J. Heat-mediated immune complex dissociation and enzyme-linked immunosor-bent assay signal amplification render p24 antigen detection in plasma as sensitive as HIV-1 RNA detection by polymerase chain reaction. AIDS
1996; 10:1085–90.
16. Lyamuya E, Bredberg-Raden U, Massawe A, et al. Performance of a modified HIV-1 p24 antigen assay for early diagnosis of HIV-1 infection in infants and prediction of mother-to-infant transmission of HIV-1 in Dar es Sa-laam, Tanzania. J Acquir Immune Defic Syndr Hum Retrovirol 1996; 12: 421–6.
17. Boni J, Opravil M, Tomasik Z, et al. Simple monitoring of antiretroviral therapy with a signal-amplification-boosted HIV-1 P24 antigen assay with heat-denatured plasma. AIDS 1997; 11:F47–52.
18. Nadal D, Bo¨ni J, Kind C, et al. Prospective evaluation of amplification-boosted ELISA for heat-denatured p24 antigen for diagnosis and mon-itoring of pediatric HIV-1 infection. J Infect Dis 1999; 180:1089–95. 19. Egger M, Hirschel B, Francioli P, et al. Impact of new antiretroviral
com-bination therapies in HIV infected patients in Switzerland: prospective multicentre study. Swiss HIV Cohort Study. BMJ 1997; 315:1194–9. 20. Furrer H, Egger M, Opravil M, et al. Discontinuation of primary prophylaxis
against Pneumocystis carinii pneumonia in HIV-1–infected adults treated with combination antiretroviral therapy. Swiss HIV Cohort Study. N Engl J Med 1999; 340:1301–6.
21. Ledergerber B, Egger M, Opravil M, et al. Clinical progression and virological failure on highly active antiretroviral therapy in HIV-1 patients: a pro-spective cohort study. Lancet 1999; 353:863–8.
22. Centers for Disease Control and Prevention. 1993 revised classification system for HIV infection and expanded surveillance case definition for AIDS among adolescents and adults. MMWR Morb Mortal Wkly Rep 1992; 41(RR-17):1–19.
23. Schoenfeld D. Partial residuals for the proportional hazards regression model. Biometrika 1982; 69:239–41.
24. de Wolf F, Spijkerman I, Schellekens PT, et al. AIDS prognosis based on HIV-1 RNA, CD41T-cell count and function: markers with reciprocal predictive value over time after seroconversion. AIDS 1997; 11:1799–806. 25. Craib KJ, Strathdee SA, Hogg RS, et al. Serum levels of human immuno-deficiency virus type 1 (HIV-1) RNA after seroconversion: a predictor of long-term mortality in HIV infection. J Infect Dis 1997; 176:798–800. 26. Wong MT, Dolan MJ, Kozlow E, et al. Patterns of virus burden and T cell
phenotype are established early and are correlated with the rate of disease progression in human immunodeficiency virus type 1–infected persons. J Infect Dis 1996; 173:877–87.
27. O’Brien WA, Hartigan PM, Martin D, et al. Changes in plasma HIV-1 RNA and CD41lymphocyte counts and the risk of progression to AIDS.
Vet-erans Affairs Cooperative Study Group on AIDS. N Engl J Med 1996; 334:426–31.
28. Lathey JL, Hughes MD, Fiscus SA, et al. Variability and prognostic values of virologic and CD4 cell measures in human immunodeficiency virus type 1–infected patients with 200–500 CD4 cells/mm3
(ACTG 175). AIDS Clinical Trials Group Protocol 175 Team. J Infect Dis 1998; 177:617–24. 29. Spijkerman IJ, Prins M, Goudsmit J, et al. Early and late HIV-1 RNA level and its association with other markers and disease progression in long-term AIDS-free homosexual men. AIDS 1997; 11:1383–8.
30. Coombs RW, Welles SL, Hooper C, et al. Association of plasma human immunodeficiency virus type 1 RNA level with risk of clinical progression in patients with advanced infection. AIDS Clinical Trials Group (ACTG) 116B/117 Study Team. ACTG Virology Committee Resistance and HIV-1 RNA Working Groups. J Infect Dis HIV-1996; HIV-174:704–HIV-12.
31. Galetto-Lacour A, Yerly S, Perneger TV, Baumberger C, Hirschel B, Perrin L. Prognostic value of viremia in patients with long-standing human im-munodeficiency virus infection. Swiss HIV Cohort Study Group. J Infect Dis 1996; 173:1388–93.
32. Yerly S, Perneger TV, Hirschel B, et al. A critical assessment of the prognostic value of HIV-1 RNA levels and CD41cell counts in HIV-infected patients.
Swiss HIV Cohort Study. Arch Intern Med 1998; 158:247–52. 33. Henrard DR, Phillips JF, Muenz LR, et al. Natural history of HIV-1
34. Farzadegan H, Henrard DR, Kleeberger CA, et al. Virologic and serologic markers of rapid progression to AIDS after HIV-1 seroconversion. J Ac-quir Immune Defic Syndr Hum Retrovirol 1996; 13:448–55.
35. Fauci AS. Multifactorial nature of human immunodeficiency virus disease: implications for therapy. Science 1993; 262:1011–8.
36. Pantaleo G, Cohen OJ, Schacker T, et al. Evolutionary pattern of human
immunodeficiency virus (HIV) replication and distribution in lymph nodes following primary infection—implications for antiviral therapy. Nat Med
1998; 4:341–5.
37. Zhang LQ, Dailey PJ, He T, et al. Rapid clearance of simian immunodefi-ciency virus particles from plasma of rhesus macaques. J Virol 1999; 73: 855–60.