Inequalities in access to healtli care in urban south Indïa
par
Jean-Frédéric Levesque
Département de médecine sociale et préventive faculté de médecine
Thèse présentée à la Faculté des études supérieures en vue de l’obtention du grade de Philosophie Doctor (Ph.Dj
en santé publique, organisation des soins de santé
Août 2006
tud -,
© Jean-frédéric Levesque, 2006
u5B
‘n
V,
c5
n
de Montréal
Direction des bibliothèques
AVIS
L’auteur a autorisé l’Université de Montréal à reproduire et diffuser, en totalité ou en partie, par quelque moyen que ce soit et sur quelque support que ce soit, et exclusivement à des fins non lucratives d’enseignement et de recherche, des copies de ce mémoire ou de cette thèse.
L’auteur et les coauteurs le cas échéant conservent la propriété du droit d’auteur et des droits moraux qui protègent ce document. Ni la thèse ou le mémoire, ni des extraits substantiels de ce document, ne doivent être imprimés ou autrement reproduits sans l’autorisation de l’auteur.
Afin de se conformer à la Loi canadienne sur la protection des renseignements personnels, quelques formulaires secondaires, coordonnées ou signatures intégrées au texte ont pu être enlevés de ce document. Bien que cela ait pu affecter la pagination, il n’y a aucun contenu manquant.
NOTICE
The author of this thesis or dissertation has granted a nonexciusive license allowing Université de Montréal to reproduce and publish the document, in part or in whole, and in any format, solely for noncommercial educational and research purposes.
The author and co-authors if applicable tetain copyright ownership and moral rights in this document. Neither the whole thesis or dissertation, flot substantial extracts from it, may be printed or otherwise reproduced without the author’s permission.
In compliance with the Canadian Privacy Act some supporting forms, contact information or signatures may have been removed from the document. While this may affect the document page count. it does flot represent any Ioss of content from the document.
IDENTIFICATION DU JURY
Université de Montréal
faculté des études supérieures
Cette thèse intitulée:
Inequalities in access to health care in urban south India
Présentée par: Jean-frédéric Levesque
a été évaluée par un jury composé des personnes suivantes:
[],président-rapporteur Siim Haddad, directeur de recherche
Delampady Narayana, codirecteur Pierre fournier, codirecteur
Q%2<2 membre du jury
examinateur externe *‘7’4/
//],
représentant du doyen de la fES$UMMARY
Kerala - in South India - has favourable indicators of human devetopment, a high
availability of public health services, and high levels of utilisation of health services. It is ofien cited as a mode! of good heaÏth at low cost. However, the private sector is increasingly more available than the public sector. This translates into a high recourse to private care. We know littie about social inequalities in access to health care - especially in
urban areas - in Kerala.
Our analyses suggest that the poor and casual workers have lower access to health care compared to more favourised populations. These two defavourised groups also have a higher propensity to turn to public services for care, despite indications of lower availability and lower quality compared to services offered in the private sector. Poor populations
-despite lower access and restriction in their consumption of services - are also subjected to
a higher economic burden of care, particularly in the private sector. Restriction in access is associated with deprivation in the urban context and lower density of health care providers. The public sector seems to play a particular role in facilitating access to health care for poor populations. The density of private services - which is higher in more privileged areas and
larger cities - stimulates the utilisation ofprivate services.
Despite a high level of human development, socio-economic inequalities in access to health care remain in urban areas in Kerala. These inequalities are linked to personal deprivation and to characteristics of urban environments. In a context characterised by an ageing population and increase in chronic ilinesses, the consolidation of public health sector and the development of mechanisms to protect against the costs of care seem warranted to ensure access for the urban poor.
Keywords: Access to health care; Poverty; Developing countries; India; Urban health services; Pnvate sector; Multilevel analysis
RÉSUMÉ
Le Kerala- en mdc du sud - présente des indicateurs favorables de développement humain,
une forte disponibilité de services publics, et des taux élevés de recours aux soins. II est souvent cité comme un modèle de bonne santé à faible coût. Néanmoins, on y retrouve aussi un secteur de santé privé dont la disponibilité dépasse largement celle du secteur public. Ceci se traduitpar un fort recours aux services privés. On connaît peu de chose des inégalités sociales d’accès aux soins - particulièrement dans les régions urbaines - au
Kerala.
Notre analyse suggère que les pauvres et les travailleurs du secteur informel présentent plus de barrières à l’accès, comparativement aux populations plus favorisés. Ces deux groupes défavorisés présentent aussi une plus forte propension à recourir aux services publics, malgré des indications que ces services sont moindrement disponibles et de moins bonne qualité que les services offerts dans le secteur privé. Les populations défavorisées - malgré
un moindre accès etune restriction de leur consommation de soins - subissent un plus lourd
fardeau économique lié aux soins, particulièrement dans le secteur privé. Au niveau des contextes urbains, la défavorisation urbaine et une densité moindre de l’offre de soins sont associées à une restriction de l’accès. Le secteur public semble jouer un rôle particulier dans la facilitation de l’accès aux soins des populations défavorisées. L’offre de services privés quant à elle - plus élevée dans les zones favorisées et les grandes villes
- stimule le
recours aux services privés.
Malgré un fort niveau de développement humain, des inégalités socio-économiques d’accès persistent dans les régions urbaines du Kerala. Ces inégalités sont liées à la défavorisation individuelles et à des caractéristiques des environnements urbains. Dans un contexte de vieillissement de la population et de croissance des maladies chroniques, une consolidation de l’offre publique et le développement de mécanismes de protection contre les coûts de la maladie semblent indiqués pour assurer l’accès aux soins pour les pauvres urbains.
Mots-clés: Accès aux soins de santé; Pauvreté; Pays en développement; mUe; Santé urbaine; Secteur privé; Analyse multi niveaux
TABLE 0f CONTENTS
SUMMARY ii
RÉSUMÉ iii
TABLE 0F CONTENTS ïv
LIST 0F TABLES viii
LIST 0f FIGURES x
LIST 0F ABBREVIATIONS xiii
DEDICATION xiv
ACKNOWLEDGEMENTS xv
FOREWORD xvi
I INTRODUCTION 1
Thefocus ofthe thesis 2
2 LITERATURE REVIEW
PART 1: THE CONTEXT 0F STUDY 6
2.1 THE STATE 0f KERALA 6
The urban environment 7
Human and economic deveÏopment 10
2.2 HEALTH STATUS AND MORBIDITY IN KERALA 13
Reported morbidiry 14
Chronic itinesses 16
PART 2: ACCESS 10 HEALTH CARE 17
2.3 THE HEALTU CARI SYSTEM 17
Governance andfinancing 17
Availabitity of healh care infrastructure and human resources 20
The public andprivate sector of health care 23
2.4 HEALTHCARE SEEKING AND UTILISATION 24
Health care seeking and unmet needs for care 25
2.5 THE COST 0F HEALTH CARE 2$
Household heatth care expenditure 29
Ability to payfor heatth care 32
Heatth-retated impovrishement and catasfrophic heatth expenditure 34
2.6 QUALITY AND ADEQUACY 0F HEALTH CARE 36
Quality ofservices in the public sector 36
Quality ofservice in the private sector 32
2.7 THE GAP [N KNOWLEDGE AND STUDY QUESTIONS 40
3 CONCEPTUALISII’JG ACCESS TO HEALTH CARE 42
3.1 THE DEFINITIONS 0F ACCESS TO HEALTH CARE 42
3.2 A FRAMEWORK 0F ACCESS TO HEALTH CARE 45
The dimensions ofaccess to health care 46
The determinants of access to health care 48
Our application oftheframework 50
Study hypotheses 52
4 METHODS 54
4.1 SOURCE 0f DATA 54
The National Sample Survey on health care 54
Sampting design ofthe N$$ survey on health care 55 Information availabte in the NSS survey on heatth care 57
Survey ofpublic andprivate infrastructure 59
4.2 DATA CLEANING AND CONSTRUCTION 0F ANALYTIC FILES 60
4.3 CONSTRUCTION 0f STUDY VARIABLES 62
Dependent variables 62
Demographic and social characteristics variables 62
Economic status andpoverty 64
Controllingfor severity ofilness 67
Urban level variables 67
4.4 STATISTICAL ANALYSIS 69
Descriptive statistics and bi-variate associations 69
Multilevel analysis 71
Non parametric regression 74
5 RESULIS . 76
PAPER 1 OUTPATIENT CARE UTILISATION IN URBAN KERALA, INDIA .77
ABSTRACT 78 INTRODUCTION 78 CONCEPTUAL BACKGROUND 81 METHODS $2 Data analysis 83 RESULIS 84 Sample characteristics 84
Utilisation ofoutpatient care services 87
Choice ofpublic or private provider analyses 89
DISCUSSION 92
Poverty and access to outpatient care 92
Segmented public andprivate sectors 94
Access to quality 94
Supply-sidefactors related to access 96
CONCLUSION 97
END-NOTES 9$
REFERENCES 99
ACKNOWLEDGMENTS 105
APPENDIX t URBAN-LEVEL VARIABLES UNDER STUDY 106 APPENDIX 2 INDIVIDUAL-LEVEL VARIABLES UNDER STUDY 107
PAPER 2 INSULAR PATHWAYS TO HEALTH CARE [N THE CITY: A MULTILEVEL ANALYSIS 0f ACCESS TO HOSPITAL CARE IN URBAN KERALA 10$
ABSTRACT 109
INTRODUCTION 109
METHODS 111
fINDINGS 112
Hospitalisation pathways in urban Kerala 112 Fact ors related to sector ofhospitalization 115
DISCUSSION 121
Hospitals as points ofentiy 121
Private sector as main source ofhospital care 122
Segmented markets ofcare 123
Variations acrossurbanareas 124
CONCLUSION 125
CONFLICTS 0F NTERESTS AND ETHICAL ASPECTS 126
REFERENCES 126
APPENDIX 1 URBAN-LEVEL VARAIABLES UNDER STUI)Y 130
APPENDIX 2 INDIVIDUAL-LEVEL VARiABLES UNDER STUDY 131
PAPER 3 AfFORDING WHAT’S fREE AND PAYII’JG FOR CHOIOE:
THE COST 0F HOSPITALISATION EPISODES IN URBAN KERALA 132
ABSTRACT 132
INTRODUCTION 132
METHODS 134
fINDINGS 137
DISCUSSION 142
The cost of inpatient carein urban Kerala 142
C’hronic diseases as a burden ofcarein urban Kerala 143
Affordability of care for the poor 144
Policy implications 145
CONCLUSION 147
ACKNOWLDGEMENTS 147
CONFLICT 0F INTERESTS AND ETHICAL ASPECTS 14$
FUNDING 148
REfERENCES 148
6 DISCUSSION 153
6.1 INDIVIDUAL AND HOUSEHOLD DETERMINANTS
0f ACCESS TO HEALTH CARE 157
Thefirst hypothesis: barriers to access for thepoor 157
Gender and access ta health care 161
6.2 THE ROLE 0F URBAN ENVIRONMENT ON ACCESS TO HEALTH CARE 163
The second hjpothesis: urban deprivation and access 164
The third hypothesis: the role of health system supply on access to health care 167
6.3 THE ECONOMIC BURDEN 0f HOSPITAL CARE 169
Thefourth hypothesis: economic burden of care for thepoor across sectors 170
On catastrophic expenditures and impoverishment 173
Thefourth hypothesis: economic burden ofcare for chronic itlness 176
6.4 LOOKING BACK AND LOOKING AHEAD 177
Some limits ofthe analyses 178
Some strengths of the analyses 183
An agenda for research 184
7 CONCLUSION.191
Strengthening the urban primat-y care infrastructure 19]
Ensuring availability ofpublic services 193
Engaging the private sector 194
Providingfinanciat protection against iltness 195
BIBLIOGRAPHY 198
APPENDICES
APPENDD( I NSS52ND ROUND QUESTIONNAIRE xviii
APPENDIX 2 DESCRIPTION 0f QUESTIONNAIRE ITEMS xxviii
APPENDIX 3 SOME NOTES ON MULTILEVEL ANALYSIS xxxii
LIST 0F TABLES
2 LITERATURE REVIEWTable 2.1 Composition of population, south Indianstatesand India $ Table 2.2 District ]evel indicators from the Census oflndia 2001, urban Kerala 9 Table 2.3 Human development, south Indian states and India 10 Table 2.4 Employment indicators, south Indian states and India 11 Table 2.5 Household expenditure indicators, urban areas, south Indian states and India 11 Table 2.6 Poverty indicators, urban areas, south Indian states and India 12 Table 2.7 Demographic and fertility indicators, south Indian states and India, 2001 13 Table 2.8 Mortality and morbidity indicators, south Indian states and India 14 Table 2.9 Public spending on health, south Indian states and India 19 Table 2.10 Public allopathic care infrastructure, Kerala 21 Table 2.11 Availability of hospital beds, south Indian states and India 22 Table 2.12 Private health care infrastructure growth, Kerala 24 Table 2.13 Utilisation ofhealth services, urban areas, south Indian states and India 26 Table 2.14 Hospitalisation and outpatient care, south Indian states and India, 2004 26 Table 2.15 Health care expenditure growth, Kerata 31 Table 2.16 Health care expenditure, urban areas, south Indian states and India, 2004 32
3 CONCEPTUALISING AND MEASURING ACCESS TO HEALTH CARE Table 2.1 Definitions and dimensions ofaccess to health care 43
4 DATA AND METHODS
Table 4.1 Stratification offirst-stage sampling units 55 Table 4.2 Stratification of second-stage sampling units 56 Table 4.3 Non weighted and weighted sample sizes 57
Table 4.4 Distribution ofdependent variables 63
Table 4.5 Distribution ofindependent individual level variables 63
Table 4.6 Poverty headcounts 67
Table 4.7 Distribution of independent urban level variables 69
Table 4.8 Description ofurban units’ samples 70
PAPER 1 OUTPATIENT CARE UTILISATION IN URBAN KERALA, INDIA
Table 1 Description ofurban contexts 85
Table 2 Associations (weighted) of study variables with utilization ofoutpatient care services
Table 3 Logistic regression of utilisation ofhealth care services 8$ Table 4 Reasons expressed for utilizing a private source ofcare 89 Table 5 Logistic regression ofchoice ofprivate provider 91
Table 6 Summary of findings 91
Appendix 1 Urban-level variables under study 106
Appendix 2 Individual-level variables under study 107
PAPER 2 INSULAR PATHWAYS 10 HEALTH CARE IN 111E CITY
Table 1 Associations of study variables with duration ofstay and use of diagnostic tests 113 Table 2 Associations0fstudyvariables with sector of hospitalisation 116 Table 3 MultmomiaÏ logistic regression of hospitalisation sources 11$
Table 4 Description ofurban units 119
Table 5 Classification ofurban areas across economic and health care suppty dimensions 120
Appendix I Urban-level variablesunderstudy 130
Appendix 2 Individual-level variables under study 131
PAPER 3 AFfORDING WHAT’S FREE ANDPAYTNG FOR CHOICE
Table 1 Description ofusers’ characteristics by sector of hospitalisation 138 Table 2 Average expenditure by socioeconomic characteristics and sectors 139 Table 3 Predicted values ofheaÏth expenditure (multilevel linear models) 140
DISCUSSION
Table 6.1 Overview ofstudyquestions, sub questions and hypotheses 154 Table 6.2 Study hypotheses and summary offmdings 155 Table 6.2 Studyhypotheses and summary of fmdings (suite) 156 Table 6.3 Description ofthe urban population by class size oftowns [95% C.I.] 165 Table 6.4 Health and health care outcomes by class size oftowns [95% C.I.] 166
APPENDIX
Table A2.1 Operational defmition ofhousehold level variables xxviii Table A2.2 Description of outpatient care variables xxix Table A2.3 Description ofhospital care variables xxx Table A2.4 Description ofhealth care expenditure variables xxxi Table A4. 1 Predicted values of health care expenditure from General Linear Models xxxviii Table A4.2 Health expenditure for outpatient care services xxxvix
LISI 0F FIGURES
2 LITERATURE REVIEW
Figure 2.1 India and Kerala political maps 7
Figure 2.2 Reported illnesses (per 1000), last 15 days by MPCE category in urban areas 15 Figure 2.3 Comparison ofstates by public and private health spending, 1995-96 20 Figure 2.4 figure 2.4 Out-of-pocket health care expenditure by state, NSS, 1995-96 32
3 CONCEPTUALISING AND MEASURING ACCES S TO HEALTH CARE figure 3.1 The determinants ofaccess to health care 49 figure 3.2 Pathways ofeffects of main explanatory variables 51
4 DATA AND METHODS
f igure 4.1 NSSO stratifled cluster sampling frame 56
Figure 4.2 Censoring ofepisodes 61
figure 4.3 Creation ofthe poverty variable 65
f igure 4.4 Household distribution according to MPCE 66
figure 4.5 Multilevel structure 72
f igure 4.6 MultileveL modeling stages 73
f igure 4.7 Thesis analytical components and related access dimensions 75
PAPER 1 OUTPATIENT CARE UTILISATION EN URBAN KERALA, INDIA
f igure 1 Source of data and variables 83
Figure 2 Standardised residuals departure from the mean utilization across urban units (ranked) 87 Figure 3 Standardised residuals departiire from the mean of private utilization
across urban units (ranked) 90
PAPER 2 INSULAR PATHWAYS TO HEALTH CARE IN THE CITY
f igure 1 Source of data and variables 112
f igure 2 Health care trajectories ofa virtual cohort of 100 hospitalised patients 115
Graph 1 Proportion offree public, paying public and private hospitalizations across urban areas.... 117 Graph 2 Proportion of private utilisation across urban contexts 121
PAPER 3 AFFORDING WHAT’S FREE AND PAYING FOR CHOICE
Figure 1 Breakdown of health expenditure framework 136 Graph I Breakdown of expenditure by economic groups and sector of hospitalisation 141
Graph 2 Breakdown ofexpenditure by type ofillness and sector of hospitalisation 142
DISCUSSION
Graph 6.1 Non parametric regressions of total health care expenditure, by income 171 Graph 6.2 Non parametric regressions ofthe proportion ofmonthly expenditure
spent on hospital care, by income 174
Graph 6.3 Total household expenditure and non health expenditure 176 Graph 6.4 Districts’ shares ofurban population, NSS sample and sub-samples, NSSO 1995-96 180 figure 6.1 Conceptualising access to health care 186 Figure 6.2 Access to health care through an episode ofiltness 18$
Figure 6.3 Poverty and barriers to access 190
APPENDIX
Figure A4. 1 Multilevel model output: logistic regression, outpatient care utilisation xxxv Figure A4.2 Multilevel model output: logistic regression, private outpatient care utilisation xxxv Figure A4.3 Multitevet model output: multinomial regression, source of hospitalisation xxxvi Figure A4.4 Multilevel model output: linear regression, hospital medicat expenditure xxxvii figure A4.5 Multilevel model output: linear regression, outside medical expenditure xxxvii Figure A4.6 Multilevel model output: linear regression, total hospital expenditure xxxvii
LI$T 0F ABBREVIATIONS
CDS Centre for Development Studies CI Confidence Interval
CNCD Chronic Non Communicable Diseases
f SU first-Stage Unit
GDP Gross Domestic Product GLM General Linear Model GNP Gross National Product IMR Infant Mortality Rate
INR Indian Rupees
MCMC Markov Chain Monte Carlo
MPCE Mean Per capita Consumption Expenditure MQL Marginal Quasi Likelihood
NFHS National Family Health Survey NGO Non Govemmental Organisation NSSO National Sample Survey Organization NSS National Sample Survey
OECD Organisation for Economic Co-operation and Development
OR Odds Ratio
PHC Primary Health Centre
PL Poverty Line
PQL Penalised Quasi Likelihood
RIGLS Restricted Iterative Generalized Least Square SC/ST Scheduled Caste / Scheduled Tribe
SDP State Domestic Product
for ail the energy, support and unconditional love.
It is also dedicated to the memory ofmy grand-fathers for being with me ail along, and more.
ACKNOWLEDGEMENT
I would like to express my sincere gratitude, first and foremost, to Siim Haddad for ail the
guidance and wisdom throughout my scientific journey. Thank you for giving me the desire to reach the limits and do the best that I can. My deepest regards to Delampady Narayana for enabling me to explore a distant continent and the intricate world of scientific inquiry. Your constant commitment overcame the distance to make you feel very present during my work. Thank you to Pierre fournier for your long-term mentorship after sowing the seeds of an interest in international health. This thesis would flot have been possible without such commifted and supportive directors.
Special thanks to Subrata Mukheijee, Sam Jose, C Veeramani and KK Han Kurup for providing friendship, encouragement and challenging intellectual discussions. Thank you also to faculties and students at the Centre for Development Studies, Kerala, for providing insightful comments and suggestions duning various seminars presenting the study resuits.
I would also like to express my gratitude to other mentors that I have encountered at the
University of Montreai. I cannot acknowledge ail the contributions as they have varied in intensity through places and time, but I wish to express my deepest respect for Raynald Pineault, Pierre Tousignant, Louise Potvin and Victor Piché for inspiring me along the way. Thank you to the Groupe de recherche sur l’équité d’accès aux services de première ligne (GRÉAS-l), the Chaire Gouverne et transformation des organisations de santé (GETOS), the fonds pour la Formation des Chercheurs et l’Aide à la Recherche (fCAR— Utilisation) and the International health unit of Université de Montréal for their financial and infrastructure support at various times during this study. Thank you to Diane Duchaine and Vanessa Beal for professionalism and efficiency in linguistic revision of this thesis.
Last but flot least, thank you to.my family members - in particular my brother - for shaping
my mmd with the mould of argumentative reasoning. Thank you to my friends and close collaborators for your support in every other aspect of life. One’s work is embedded in the richness of friendship and love.
FOREWORD
The idea for this thesis emerged out of readings on urban health. These readings - seen in
the light of previous personal and professional experiences in the south Indian context
-generated my initial questioning about access to health care in the cities of south India. This idea developed with my exposure to the fascinating state of Kerala. further readings and discussions with scholars from the Centre for Development Studies -a renowned institution
located in Trivandrum -helped to pinpoint the focus ofthis thesis.
Kerala is known for its high level of human development and the good health status of its population, despite being a relatively poor state. At first sight, it seemed that, along with strides towards attaining high levels of literacy and strong public action, access to health care must have played a significant role in this. Various studies developed these ideas. But, it seemed increasingly clear - as research of the literature went on - that the number of
original studies on urban Kerala was smafl and that a systematic assessment of access to health care in urban Kerala had flot been done.
In addition, some aspects of the literature on health and health care in Kerala did not seem in line with what seemed to be occurring in Kerala. Various assumptions -often cited in the
scientific literature - were contradicted by the availabie information. Among these
assumptions was the idea that the good health and high levels of utilisation of health services found in Kerala were soiely due to the development of the public health care system. More than public institutions, it is the number of private health care institutions and its utilisation by the population that was striking. Various studies seemed to overlook the utilisation and reiated expenditure in the private sector.
Another assumption was that Keraia’s population enjoys good health status. High leveis of reported morbidity and consumption of health care services quickly chaiienged this idea in my mmd. Good indicators in terms of maternai and child mortality and good coverage and utilisation with regards to chiid and maternai health services did flot seem be sufficient proxies ofuniversal access to heaith care.
f inally, a fair portion of the literature dated to the 1 970s and 1 9$Os and a reassessment was
thus relevant. Given that no such assessment had been done specifically for urban areas - on
the contrary, many studies focused solely on rural Kerala - this subject increasingly held
my interest.
The opportunity the use the National Sample Suwey on Health and Health Care came right at the time when these ideas were formulated. This survey - vastly under exploited
-represented a rich data base on which to test some of the hypotheses that were emerging. Drawn on a strong tradition of measurement of living standards and utilisation of govemment services, this database enabled complex analyses to be done. The limitations inherent in the usage of such secondary data were clearly compensated by vast possibilities.
During various stays in Kerala - some of them of only a few weeks and others lengthier
-the ideas shaping this -thesis took form. Discussions with scholars and students, seminar and conference presentations and a general curiosity for understanding life in this state of south India have helped me along the way. I hope that this study can in retum contribute to the understanding on access to health care in urban areas of south India and possible translate into health care policy discussions and further studies on access to health care in urban Kerala.
The world is becoming increasingÏy urban. Although this process varies across regions, the entire world is facing an increase in both the size of its cities and in the proportion of people living in urban areas. In developed countries this process has almost arrived at its final stage. Most of the urban growth is expected to take place in developing countries during the next decades (United Nations, 2000; Pemia, 1998; Duncan & Auer, 1995).
Generally, urban areas in developing countries present better health indicators and have more health facilities than rural areas. Their populations benefit from higher economic status, better living conditions and opportunities, and better access to health care. However, aggregate indicators mask the variability found within cities (Tanner & Harpham, 1995). The widespread socio-economic inequalities found in urban areas of developing countries create a vast range of living conditions and resuit in disparities in mortality and morbidity (Vlahov, Galea, Gibble & freudenberg, 2005; Sciar, Garau & Carolini, 2005). The urban poor are subject to higher morbidity than wealthier urban inhabitants and they are ofien subject to a worse health status than the ruralpoor (World Bank, 1999).
The distribution of health resources within cities is unequal and is flot necessarily related to heahh needs (Lorenz & Gamer, 1995). Urban health care facilities ofien benefit only an affluent minority and access to health care is restricted for the poor (Caimcross, Hardoy & Satterthwaite, 1990; WHO, 1993; Rossi-Espagnet, Goldstein & Tabibzadeh, 1991; Harpham & Tanner, 1995; fosu, 1989). Increasing urbanisation and widening inequalities, unmatched by the development of affordable services and investments in publicly financed services or insurance coverage, could lead to restrictions in access to care particularly among the poor and economically deprived (Castro-Leal, Dayton, Demery & Mebra, 2000; McDade & Adair, 200f; feachem, 2000).
l Current projections suggest that haif of the population of Ïess-developed countries wiÏl tive in cities by 2017. Asia is one of the least urbanizedareasof the won, yet, it already has moreurbandwellers (1.5 billion) than Europe, Latin America, North America and Oceania combined (1.2 billion). By 2030, Asia will account for over halfoftheurbanpopulation ofthe world (United Nations, 2004).
Recent studies have suggested that characteristics of living environments could be significant determinants of access to health care, in addition to characteristics of individuals and the availability of health care services (McDade & Adair, 2001; Ecob & Macintyre, 2000). Intra-urban disparities in access to health care have mostly been studied in large cities (Satterthwaite, 199$). However, a bigger number ofthe urban population lives in fast growing smaller cities. Much less is known about access to health care in small and medium towns (United Nations, 2000).2 Assessments about which urban characteristics influence access to health care - in the context of developing countries - are stili lacking.
This thesis bas as overail objective to assess the disparities in access to health care found in urban areas. We aim to identify individual and urban factors that facilitate or impede access to health care - especially for the poor, casual workers and members of backward social
groups - and assess the economic burden ofhealth care for the urban poor.
Thefocus of the thesis
four words can describe the focus of this thesis: inequatities; access; deprivation; and
urbanity. The first two words relate to our object of analysis, the inequalities in access to health care. We are therefore interested in better understanding disparities in opportunities to utilise health services - in instances of need for care - emerging from barriers to access.
The third word - deprivation - is central to this thesis. It relates to individual and household
conditions - such as economic poverty, casual work employment and belonging to
backward castes - of those most at risk of experiencing adverse outcomes associated to
illness episodes. The last word- urbanity - describes the context under scmtiny, namely the
urban environment, and its attributes associated with variations in access to health care. Our objective from the start was to better understand inequalities in access to health care in urban areas of developing countries by looking at the state of Kerala, in south India.
2 In 2003, 4% of the world population resided in mega-cities- cfties of 10 million inhabitants or more. By
2015 this share is expected to risc to 5%. About 25% of the world population was living in cities with fewer than 500,000 inhabitants in 2003. In south Asia, around 14% ofpeople live in cities of more than 10 million inhabitants, 7% in cities offive to ten million, 16% in cities ofone to five millions compared to 55% in towns offewer than 500,000 inhabitants (United Nations, 2004).
The thesis addresses three broad sets of questions. The first focuses on the role of deprivation on access to health care and the barriers to health care experienced by the urban poor. What are the individual and household characteristics associated with barriers to access to health care in urban Kerala? What are the specific barriers for deprived people?
The second set of questions focuses on assessing variations in access to health care across urban environments and identifying the role of urban attributes and health care sectors on these variations. Does access to health care vary across urban contexts? What are the urban characteristics associated with restrictions in access? What is the role of urban size and other urban attributes? What is the role of public and private urban health systems?
The third set of questions relates to the economic burden of hospital care across social groups and health care sectors. What is the economic burden of hospital care? Row much is it a burden for the poor? Ihe combination of available information about urban environments -in addition to individual and household characteristics
- to assess disparities
in access to health care and its related economic burden - in a joint analysis - is a
contribution ofthis thesis.
The reasons for taking urban Kerala as a case are numerous. first, this state is often described as a model of good health at tow cost with regards to public investments. We believe that lessons learned ftom this context could be applicable to other low-resource seffings. Second, Kerala is already at an advanced stage of health transition and to this regard, provides a window into the future of other developing countries which have flot yet reached this level of transition, but are evolving in this direction. Third, the widespread utilisation of health services in Kerala permits assessment of differentials related to the complete spectrum of determinants of access to health care. Such settings, with a strong culture of health care consumption - where poor and non poor seek health care when they
experience health problems - and where many options for care are available, offer the
possibility to assess the economic barriers and burden related to access to health care. Finally, although the public sector is well-developed, the size of the private sector and the prices of medical goods and services - under the impetus of liberalisation of the economy
Thus Kerala provides an array of situations by which to assess cumulative barriers in access to health care (from identification of need for care, physical access, available options and related economic burden). In addition - with three principal urban aggiomerations with
populations ranging between 800 000 and 1.3 millions inhabitants - this context can
provide insights into the situation for medium sized and small towns. Kerala has been a mode! for other Indian states and developing countries with regards to its human development and primary health care approach. Insights from this state could again prove useful for other Indian states or other less-developed countries confronted with similar changes in the future.
This thesis intends to address some aspects that have been relatively overlooked by other studies. Access to health care in urban areas, the role of the private sector, the urban characteristics facilitating or impeding access to heaÏth care, and the costs of health care, are among the aspects that we tackie in this study. We aim to better understand disparities in access to health care in urban areas in Kerala and assess the role of poverty - as well as
occupational status and caste membership - and of urban environment on these disparities
in access to health care. few studies have looked at the interactions between individual, household, and community level characteristics to explain inequalities in access to health care in urban areas. It is the aim of this thesis to contribute to the knowledge about urban health systems by studying the state ofKerala, in south India.
We present and discuss the resuits from two analytical perspectives. The first perspective focuses on disparities in utilisation of health care services across social groups and utilisation pattems in various urban contexts. The first paper focuses on utilisation of outpatient care services in response to perceived need, and the share of public and private outpatient care utilisation. This perspective further entails an analysis of social disparities in pathways to hospitalisation and sources of hospital care. This is the focus of the second paper. We thus use these disparities in utilisation - controlling for need for care - to reveal
problems of access to health care. Our assumptions were that - controlling for the severity
and nature of illness- the poor, members of backward castes and casual worker households
would face restricted access to care and differential access to public and private sector services. In addition, we expected poorer urban areas, and those with lower avaiÏability of
availabiiity of services are also expected to determine choices between the public and private sectors in health care seeking processes.
The second perspective deals with financiai access to heaith care services. In the third paper, we assessed the cost of hospitalisation in public and private institutions across income groups. Our assumptions were that deprived groups - mostiy the poor and casuai
worker groups - would report high levels of health expenditure in the private sector
compared with expenditure in the public sector. The resuits presented in this third paper are complemented with an analysis of the economic burden of care across income groups. These will be presented in the iast section.
This thesis will proceed in three parts. The first part begins with a description ofthe context of study in tenns of demographic composition, human and economic development and health status indicators. We then review the existing literature on access to health care. It is followed by a review of the conceptualisation of access to health care and the proposai of a conceptuai ftamework. The second part consists of a description of the methodoiogy used in this study and the presentation and discussion of analytic resuits through the three aforementioned scientific papers. The third part discusses the presented resuits - linking
knowledge generated from each paper and complementary analyses - and concludes with
policy and research implications for urban health systems ofdevelopïng countries.
We feel that this thesis - the first to address the question of access to heaith care in urban
Kerala- contributes to a better understanding of disparities in urban areas. We have tried to
make the best use of the most extensive population survey on health care available - a
database too ofien under utilised - to provide insights for decision-makers and social
science researchers. We hope that it translates into policy discussions and further research on urban Kerala. This is our modest attempt at understanding a less explored subject in south India.
In this section, we will review the scientific literature on access to health care in urban Kerala. The first part consists in a description of the context of Kerala. We start with a portrait of its demographic, social, and economic characteristics, a summary of the extent of present knowledge on health status and morbidity. The second part provides an overview of Kerala’s health care system and reviews the knowledge on health care utilisation and access to health care in the context of Kerala and in developing countries in general. We finally conclude by identifying some gaps in scientific knowledge about access to health care in urban areas. Throughout this review, an effort is made to systematically position Kerala in relation to India and other south Indian states -namely Tamil Nadu, Kamataka and Andbra
Pradesh - and to highlight the extent of knowledge specific to urban areas of developing
countries.
PART 1:
THE CONTEXT 0f
STUDY
2.1 The state ofKerala
The state of Kerala lies on the southem tip of India between the Arabian Sea and the Western Ghats mountain range. It is a small state by size - amounting to only 1.2% of
India’ s territory - and is divided into 14 districts (Figure 2.1). With a population of about 32
million people (3.2% of India’s population), it has the highest population density in south India - at 819 persons per square kilometre - and the third highest among major Indian
states.
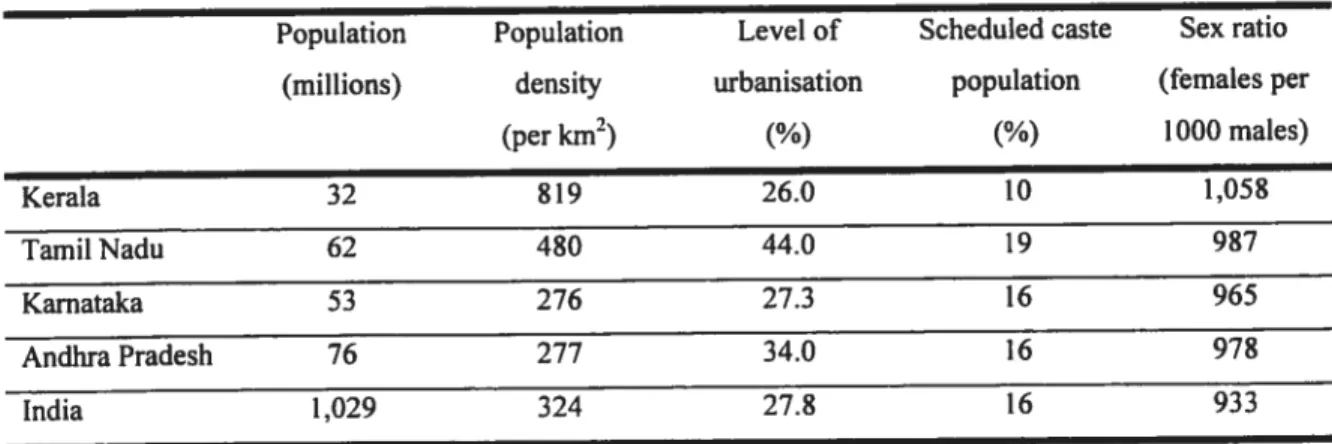
Its population is composed of a majority of Hindus (56.2%) but has an large proportion of Muslims (24.7%) - concentrated in northem districts - and of Christians (19.0%)
-concentrated in southem districts. It has lower proportions of people from scheduled
-groups identified as being socially and economically backward - castes (9.8%) and tribes
(1.1%) and is the only state with a sex ratio favouring females (Table 2.1) (Census of India, 2001).
The urban environrnent
Kerala is characterised by a pattem of urbanisation where medium and small towns have a
prominent position3 (Ramachandran, 1996). Only one urban aggiomeration
-Kocbi/Emakulam - has more than one million inhabitants. Its three main urban
agglomerations are distributed across the state and none represent more than 10% of the states urban population. Its level of urbanisation is of 26% and stands at the level of the Indian average, lower compared to other south Indian states. Its high population density and its scafiered model of settlement result in a close proximity between rural and urban areas (Sreekumar, 1993).
Districts vary with regards to their level of urbanisation. The six districts with a major urban agglomeration have from 28% to 50% oftheir populations living in urban areas compared to 3% to 19% for the other districts. These highly urbanised districts comprise together nearly
There are 17 urbanaggiomerations-consisting oftowns and their outgrowths -32 class I towns (>100,000 inhabitants), 32 class II towns (between 50,000and99,999 inhabitants)and 184 other towns (Census of India, 2001).
Figure 2.1 India and Kerala polit ical maps
78% of the urban population of the state (Table 2.2). With the exception of Allapuzha, this parallels the ciustering of unfavourable social and economic indicators. The least urbanised districts present worse urban indicators compared to highly urbanised districts. In particular, the districts of Emakulam, Kozhikode and Kannur present favourabie indicators - indicated
with a [+] in table 2.2. In contrast, the districts of Wayanad, Allapuzha, Kollam and Kasaragod show a clustering of unfavourable indicators. These areas tend to have high levels of scheduled castes, dilapidated houses, houses made of temporary materials, absence of drainage system and a large share of its population with no high value assets.
In addition, only 0.8% of the urban population (around 45,000 people) lives in slums in Kerala, which is the lowest proportion of ail Indian states (Census of India, 2001). These settiements usually consist of marginal clusters of habitations built on inhospitable land such as the side of railway tracks, rivers and canais. Kerala’s pattern of urbanisation thus differs from other Indian states, where metropolitan cities tend to be larger and account for a bigger share of the urban population and - in addition to the presence of small clusters of
informai habitation-comprise large sium areas, concentrating many thousand inhabitants.
Table 2.1 Composition of the population, south indian states and India
Population Population Level of Scheduled caste Sex ratio (millions) density urbanisation population (females per
(per km2) (%) (%) 1000 maIes) Kerala 32 819 26.0 10 1,058 Tamil Nadu 62 480 44.0 19 987 Karnataka 53 276 27.3 16 965 AndhraPradesh 76 277 34.0 16 978 India 1,029 324 27.$ 16 933
D
D
D
9 Table 2.2 District level indicators from the Census of India 2001, urban Kerala Districts Population Urbanisation Schedu]ed Condition ofhouses Drinking fuel Having Houses Type of Type tevet (%) caste water used for bathroom made of drainage of population source cooking facilities temporary latrine value Urban % of (%) Good Di]apidated Tap (%) Wood within material No No assets (l000s) urban (%) (%) (%) the bouse (%) Kerala drainage latrine (%) (%) (%) Emakulam 1,477 18 48 6.8 72 11 4I] 70 1+1 381J 881+1 21+1 60 11 SI-i-1 141+J Kannur 1,213 15 50 3.8 1+j 69 1+1 311 9 73 83 21+1 67 7 16 Kozhikode 1,101 13 38 5.4 +J 69 t+J 5 24 73 $4 1+] 5 73 51-9 Thiruvananthapuram 1,092 13 34 9.7 61 $ 59 1-1 51 73 20 69 9 Thrissur $39 10 28 8.9 57 6 28 60 89 I1 7 69 5+J 16 Allapuzha 621 $ 30 5.4 63 9 36 67 57 11 84 12 Kotlam 466 6 18 8.3 60 9 30 59 67 15 83 9 Kottayam 300 4 15 5.8 60 5 41 53 78 4II 60 1+1 8 Palakkad 356 4 14 11.9 58 5 58 1±1 501+1 74 8 60 t+J 17 Malappuram 356 4 9 7.1 66 4[‘1 25 74 7$ 6 78 $ Kasaragod 234 3 19 3.8 tJ 63 6 19 62 82 5 77 14 Pathanamthitta 124 2 10 9.2 67 5 32 54 71 4t+J 68 13 Idukki 58 < 1 5 6.3 63 7 41 5$ 60 7 70 9 Wayanad 30 < 1 4 7.6 60 10 32 49 11 73 15 64 13 [+] Favourable indicatorHuman and economic development
Kerala presents less inequality in various indicators - such as economic status and literacy
-between rural and urban areas, males and females, and across socio-economic groups than other Indian states (Drèze & Sen, 2002). Observers have suggested that this is the resuit of the socialistic orientation of former governments and rulers resulting in land reforms and the establishment of public programs (Panikar & Soman, 1975; Caldwell, Reddy & Caldwell, 1983). The emphasis on primary education bas resulted in the achievement of high levels of literacy (Kumar, 1993; Ramachandran, 1996). It is 90% - 94.2% among
males and 87.7% among females (Census of India, 2001) within the population aged 7 years or above and specifically reaches 93.2% in urban areas. Kerala also has the highest proportion of 7 to 10 year olds attending school and of persons with a secondary level education or more (Table 2.3). Kerala bas a highly literate - and health literate population
-playing an active role in public affairs and adopting hygienic practices (Shah & Rani, 2003; Kannan, 1999).
Table 2.3 Human development, south Indian states and India
Literacy rate(%) School aflendance of Secondary education and Male Female 7-10 years old(%) above (per 1000)
Kerala 94 8$ 97.5 335
TamiiNadu 82 64 87.1 307
Kamataka 76 57 85.1 282
Andhra Pradesh 70 50 $5.3 279
India 75.3 54.3 75.4 285
Source: Census oflndia, 2001
Kerala’s economy now mostly relies on the services sector (63.8% of GDP) and agricultural and fishing industries (together 17.2% of GDP) (Government of Kerala, 2004). Its work participation rate of 32% is among the lowest in India: 7% of workers are labourers, 15.8% are agricultural labourers and 3.6% are workers in household industries (Census of India, 2001). Nearly haif of the population is dependent on agriculture alone for its income. In
urban
areas, the proportion of casual workersis
high and the proportion of salaried individuals is low (Table 2.4). Unemployment is higher than other states.Table 2.4 Employment indicators, south Indian states and India.
Participation Casual Regular Usual principal activity2 rate (%)‘ worker wage (per 1000 households)
households households
Not in Workers Unemployed (per 1000 (per 1000 labour households)2 households)2 force Kerala 32.3 223 340 639 331 30 TamiiNadu 44.7 160 411 600 383 17 Kamataka 44.5 204 359 626 362 12 Andhra Pradesh 45.8 144 423 625 353 22 India 39.1 122 406 646 335 19
Source: 1Census of India 2001; 2NSSO 2005 for urban areas
This Iast observation of unemployment and higher casual work employment structure is in une with the portrayal of Kerala as a relatively poor state. Such observations provide the basis for the oflen cited good health at low cost of Kerala (Panikar & Soman, 1975; Franke & Chasin, 1992; Caldwell, Reddy & Caldwell, 1983; Ramachandran, 1996). Per capita net state domestic product figures positioned Kerata below the Indian average in the mid 1 990s (Table 2.5). However, Kerala has experienced high economic growth during the last decade (Government ofKerala, 2004). Combined with a low population growth, this translated into a better growth per capita than the Indian average (Chakraborty, 2005).
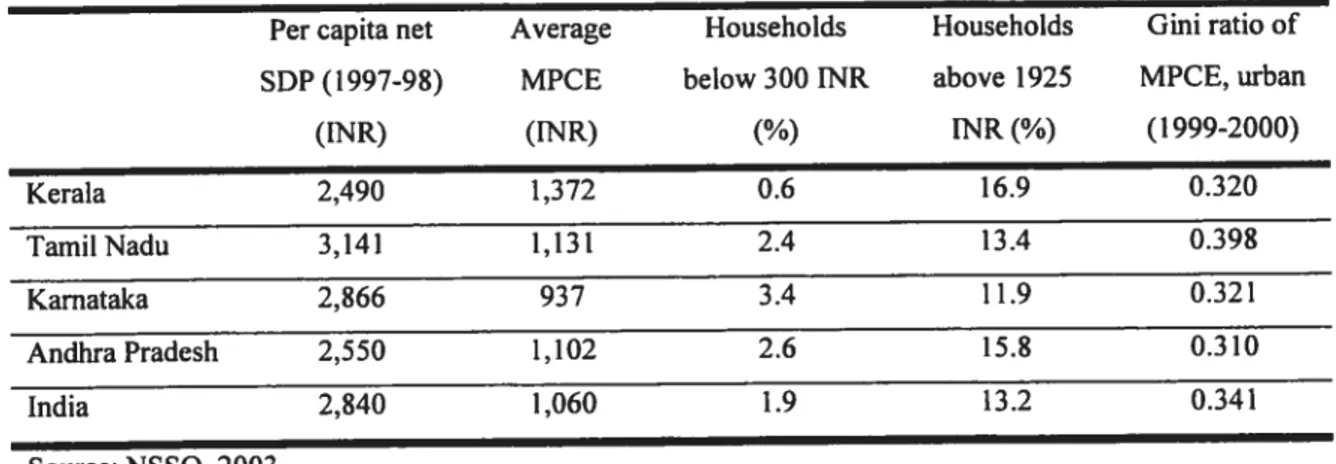
Table 2.5 Household expenditure indicators, urban areas, south Indian states and India.
Per capita net Average Households Households Gini ratio of SDP (1997-9$) MPCE below 300 1NR above 1925 MPCE, urban
(INR) (INR) (%) INR(%) (1999-2000)
Kerala 2,490 1,372 0.6 16.9 0.320 TamiiNadu 3,141 1,131 2.4 13.4 0.398 Karnataka 2,866 937 3.4 11.9 0.32 1 AndliraPradesh 2,550 1,102 2.6 15.8 0.310 India 2,840 1,060 1.9 13.2 0.341 Source: NSSO, 2003
The last assessments of average monthly per capita consumption expenditure (MPCE) position Kerala on top of Indian states. This translates into a lower proportion of households with very low levels of expenditure and a higher proportion of households with high per capita monthly expenditure (Table 2.5). It is also among the states with the lowest measure of inequality - expressed by the Gini coefficient- in MPCE.
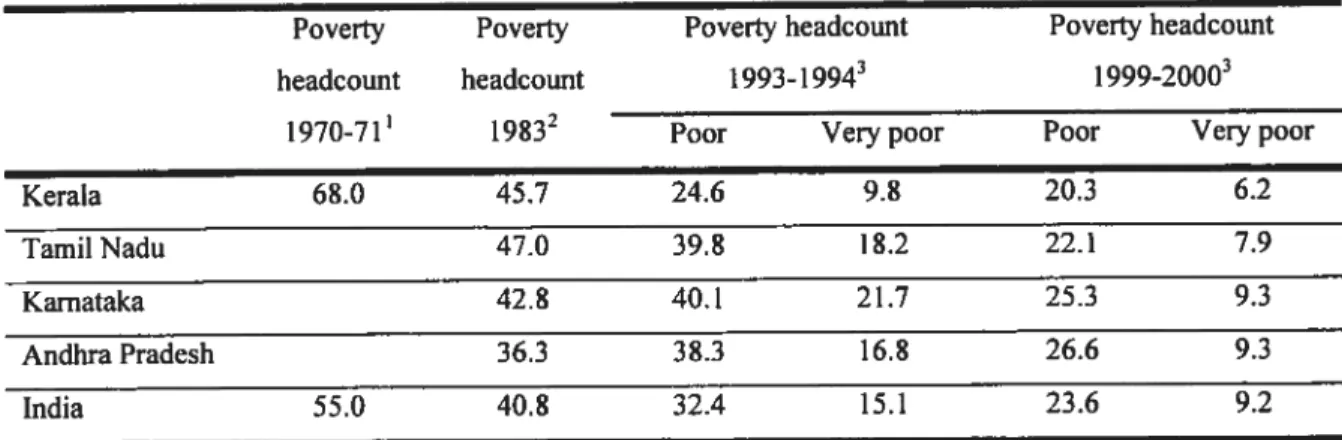
Kerala also experienced a significant reduction in poverty during the last three decades. from estimated poverty headcounts of 68% in 1970 - a level at the time much higher than
the Indian average- poverty was recently estimated at 20%. With only 6.2% ofvery poor, it
is among the lowest levels of south Indian states, now below the Indian average. This is flot to say that poverty is absent in Kerala, one person out of five is stili below an already low poverty tbreshold around 1999-2000 (Table 2.6). According to the latest information, the headcount index is now as low as 13% in Kerala-the third lowest rate among major states
-compared to 26% for India (NSSO, 2003).
Table 2.6 Poverty indicators, urban areas, south Indian states and India
Poverty Poverty Poverty headcount Poverty headcount headcount headcount 1993-1994g 1999-2000
1970-71’ 19832 Poor Verypoor Poor Veiypoor
Kerala 68.0 45.7 24.6 9.8 20.3 6.2
Tamil Nadu 47.0 39.8 18.2 22.1 7.9
Kamataka 42.8 40.1 21.7 25.3 9.3
Andhra Pradesh 36.3 38.3 16.8 26.6 9.3
India 55.0 40.8 32.4 15.1 23.6 9.2
Source: ‘EPW foimdation (1993) cited in Ramachandran, 1996; 2Government oflndia, 2002 (1); Radakrishna, Hanumantha, Rao, Ravi % Reddy, 2004 from NSS data50th1and 55e” round Consumer expenditure
2.2 Health status and morbidity in Kerala
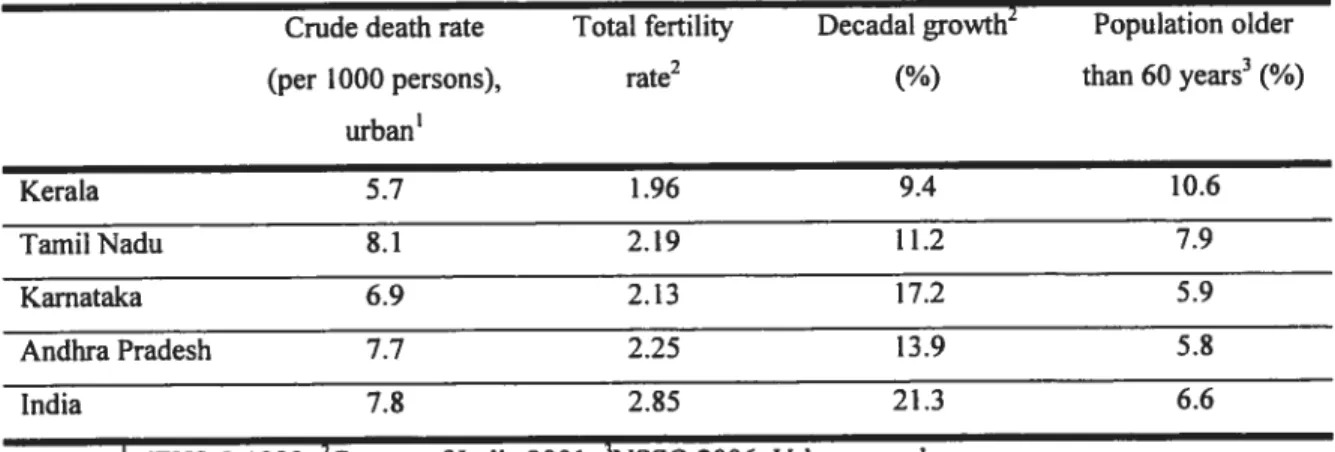
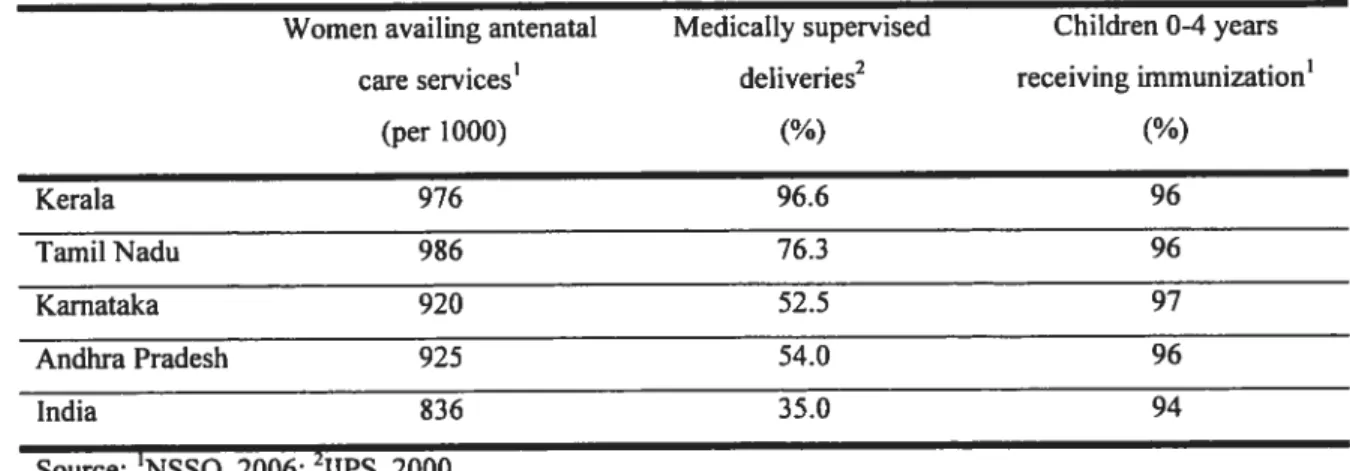
The state of Kerala is known for its high achievements in health. Over a few decades, its levels of fertility and mortality have been reduced to lower levels than other Indian states (franke & Chasin, 1992; Thankappan & Valiathan, 1998; Saradamma, Higginbotham & Nichter, 2000). It has a low crude death rate, and low total fertility rate (1FR) — 1.96 live births expected per woman in her reproductive years, a life expectancy above 73 years (Govemment of India, 2002 (2)) and an infant mortality rate (IMR) as low as 8 per thousand live births in urban areas (NSSO, 2006). As seen in table 2.7 and 2.8, Kerala also bas much lower levels of crude death rate and IMR, which translates into higher life expectancy at birth among both males and females4 compared to other south Indian states and the Indian average.
In fact, most mortality indicators suggest a better health status in Kerala. It is comparable to many upper middle income countries - such as Argentina and Mauritius (World Bank,
2001). This situation of low mortality and low fertility resuits in the ageing of Kerala’s society. It now has a higher proportion of elderly above 60 years of age - reaching nearly
11% of the urban population - and experiences lower population growth than other states
(Table 2.7).
Table 2.7 Demographic and fertility indicators, south Indian states and India.
Crude death rate Total fertility Decadal growth2 Population older
(per 1000 persons), rate2 (%) than 60 years3(%)
urban’ Kerala 5.7 1.96 9.4 10.6 TamilNadu 8.1 2.19 11.2 7.9 Kamataka 6.9 2.13 17.2 5.9 Andhra Pradesh 7.7 2.25 13.9 5.8 India 7.8 2.85 21.3 6.6
Source: ‘NFHS-2 1999; 2Census of India 2001; 3NSSO 2006, Urban sampie
A similar favorable position is seen for maternai mortality rate which was 19$ per 100 000 live bfrths, in 1998, compared to an ali-India average of 407 (Govemment oflndia, 2002 (2)).
Reported morbidity
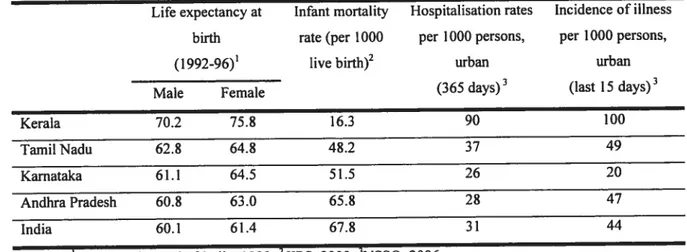
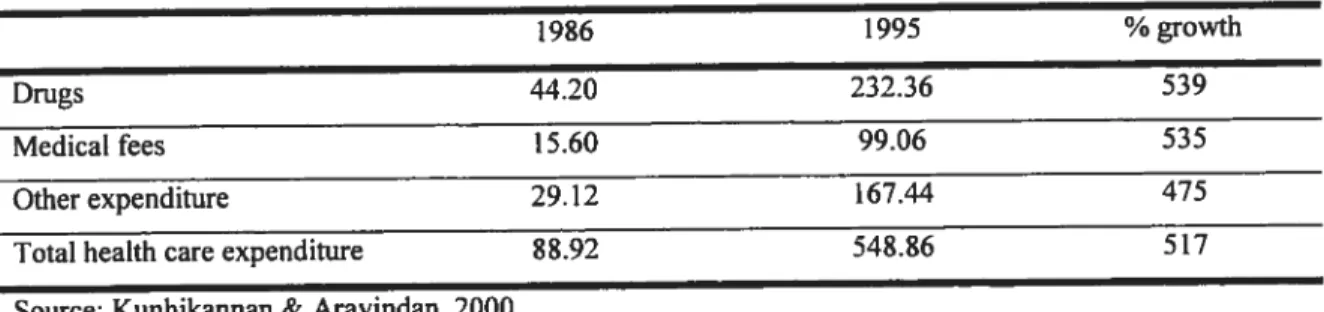
Paradoxically, morbidity indicators tend to give a contradictory picture of the health status in Kerala. There are high levels of perceived morbidity and high levels of utilisation of health services and hospitalisations (Panikar, 1998; Kannan, Thankappan, Ramankutty & Aravindan, 1991; Kunhikannan & Aravindan, 2000; Soman, Damodaran, Rai asree, Kutty & Vijayakumar, 1991). Kerala bas the highest level of ailments reported over a period of two weeks in India. Its reported rate of 100 commencing ailment per 1000 persons in urban areas is twice the incidence reported for the next highest state (NSSO, 2006). Similar resuits can be seen for hospitalisations, with Kerala presenting much higher rates than other states (Table 2.8).
Table 2.8 Mortality and morbidity indicators, south Indian states and India
Life expectancy at Infant mortality Hospitalisation rates Incidence of illness birth rate (per 1000 per 1000 persons, per 1000 persons,
(1992-96)’ live birth)2 urban urban
Male female (365 days)3 (last 15 days)
Kerala 70.2 75.8 16.3 90 100
Tamil Nadu 62.8 64.8 48.2 37 49
Karnataka 61.1 64.5 51.5 26 20
Andhra Pradesh 60.8 63.0 65.8 2$ 47
India 60.1 61.4 67.8 31 44
Source: ‘Registrar General oflndia, 1999; 2IIPS, 2000; 3NSSO, 2006
figure 2.2 shows the rate of reported ilinesses among different economic classes. Mthough
ah states and India, in general, show a gradient increase in reported morbidity with increasing economic status, it is in Kerala that the highest differential of reporting between richer and poorer individuals is found. Individuals from the highest economic status category report almost twice the morbidity of the poorest category. The levels of reported
-or perceived - morbidity are higher in Kerala at every economic level. These are lower in
Figure 2.2 Reported ilinesses (per 1000), last 15 days by MPCE category in urban areas. Q w Q G) -Q E D
-Andhra Pradesh Kamataka Kerala —.——TamiI Nadu India
Source: NSSO, 2006
Analyses of secondary population surveys have consistently suggested hïgh levels of reported morbidity in Kerala (Dilip, 2002; Michael & Singh, 2003; Kutty, Soman, Joseph, Pisharody & Vijayakumar, 2000). The extent with which this translates into real morbidity and ilinesses remains unclear. Reported morbidity and hospitalisation are influenced by cultural and health system factors - such as supply of hospital beds - and these resuits
should be analysed with caution. Kerala has a health literate population - with high
expectations regarding their health - and a strong culture of consumption of health care.
High levels of reported morbidity and hospitalisations could be more the resuit of biases in reporting ailment and high availability of health care services than real excesses in morbidity (Kumar, 1993; Ramachandran, 1996). In a state where mortality is low, availability of care is high, and hygienic practices are good, one would expect morbidity to be lower and the exact level of morbidity in the population thus remains difficult to assess from the existing literature.
0-300 300-350 350-425 425-500 500-575 575-665 665-775 775-915 915-120 120-1500 1500-1925 25+
Chronic ilinesses
Another potential reason for the high reported morbidity lies in the emergence of chronic ilinesses. In the wake of its success in reducing mortality, Kerala faces the coexistence of diseases of poverty and diseases of affluence, a situation which may be triggered by the ageing of the population and the fact that large numbers of Keralites stili belong to lower socio-economic groups (Ramachandran, 1996; Micheal & Singh, 2003; Zacharia, Thankappan, Alex, $arma & Vasan, 2003; Joseph, Kutty & Soman, 2000; Dilip, 2002). A recent population survey shows that hypertension and heart diseases, diabetes and disorders of joints and bones are four of the five most reported morbidities among the elderly in Kerala - heart diseases and diabetes also being among the main reasons for hospitalisations
(Mukherjee & Levesque, 2006). Infectious diseases and trauma stili represent the main morbidities among the non-elderly.
Chronic conditions, such as type II diabetes, hypertension and coronary heart diseases are rising in urban areas, alongside risk factors such as obesity, a sedentary lifestyle, elevated serum lipids, and smoking (Kutty, Soman, Joseph, Pisharody & Vijayakumar, 2000; Zacharia, Thankappan, Alex, Sarma & Vasan, 2003; Joseph, Kutty & Soman, 2000). The reported burden of chronic conditions in Kerala is higher among people who are economically well-off than the poor. These groups may be more aware of health issues and therefore be relatively less likely to underreport minor health problems or acute ailments than their counterparts in a poorer economic situation (Dilip, 2002). However, these chronic diseases are not restricted to the richer segments of the population and the poor show high prevalence rates and high rates of complications for many of these conditions (Ramachandran, Snehalatha, Vijay & King, 2002). Chronic illness in Kerala is a less studied area.
The previous section highlighted the main characteristics of the State of Kerala. In this part, we will review the literature on access to care and utilisation of health care services in Kerala, with a special focus on urban areas. We will first provide an overview of Kerala’s health care system. We will then review the extent of knowledge about seeking and utilisation ofhealth care, and about the impact of availability, costs and quality on access to heatth care in the context of Kerala and developing countries.
2.3 The health care system
Various factors have been put forward to explain the rapid decline in mortality and fertility seen in the state of Kerala highlighted in the previous section. Among these is the development ofa health care system that provides the majority ofthe population with ready access to medical centres, focusing on pregnancy, birth, and the very young (Kumar, 1993; Caldwell, Reddy & Caldwell, 1983). In this section, we briefly review the available literature on the health care system in Kerala with regards to governance, financing, resources and infrastructure. The information is going to be compared to evidence from the literature on urban health systems in developing countries.
Governance andfinancing
In India, health is a state responsibility. The provision of health care in the public sector is a shared responsibility between the state, central, and local govemments (Purohit, 2001). The central govemment is mostly responsible for the development and monitoring of national standards and regulations, for the coordination between state governments and international donors, and for the financing and implementation of various programs (Narayana, 2006). State-level govemments mostly finance primay health care facilities - such as primary
health centres and hospitals. State and local governments account for about three-quarters and the Central government for about a quarter of public spending on health. Local govemments have no significant financial authority in India except in some large cities where they administer hospitals (World Bank, 1999).
Total health expenditure in India amounts to 6% of gross domestic product. The public part of this expenditure - state and central level combined - has been comparatively low. The
States’ resources allocated to the health sector have been declining since the 1990s (Govemment of India, 2002 (1)). These have declined from 7.0% to 5.5% as a proportion of governmental spending and from 1.3 % to 0.9% as a proportion of GDP from 1990 to 1999 (Garg & Karan, 2005). Compared to an average of 2.2% of GDP for developing countries, this is among the lowest level of health expenditures by any govemment in the world (Bhat & Jain, 2004). India is among the boftom 20 percent of countries with regards to the level of public spending in health (World Bank, 2001; Bhat & Jain, 2004). Only about 17% of the aggregate expenditure is provided by the public sector. This level of public contribution to health is low compared to other Asian countries such as Sri Lanka (49%), Bengladesh (44%) Thailand (57%) (Bhat & Jain, 2004).
The current annual per capita public health expenditure in the country is no more than 200
INR - approximately 4.3 US $ (Government of India, 2002 (1)). About one-third of this
expenditure is spent on secondary and tertiary in-patient care, the rest allocated to the curative needs at the primary care level (Bhat, 1999). Most of the health expenditure - 82% - is out-of-pocket (Deogaonkar, 2004). Insurance coverage mechanisms are negligible and
most of the private health expenditure is out-of-pocket (Bhat, 1999). Currently, only about 10% ofthe population is protected under any health insurance coverage5, and most ofthose insured belong to the organized sector (Gumber, 2001; World Bank, 1999; Varkey, 2003). Out-of-pocket expenditures represent approximately 97% of private health expenditure, only 3% is covered by some form ofinsurance (Garg & Karan, 2005).
In Kerala, the per capita govemment health expenditure has been among the highest of any Indian state (Garg, 1998). The annual growth rate of government health expenditure was outstripping the growth of state domestic product during the three decades aller the
Four types of insurance scheme are present in India: mandatory insurance (Empioyees State Insurance Scheme (ESIS); Central Government Health Scheme (CGHS)); voluntary insurance (for individuals and corporations: General Insurance Corporation (GIC) a govemment owned monopoty); employer-based
insurance (offered by both the public and private sector, workers buy insurance in lieu of wages); NGO
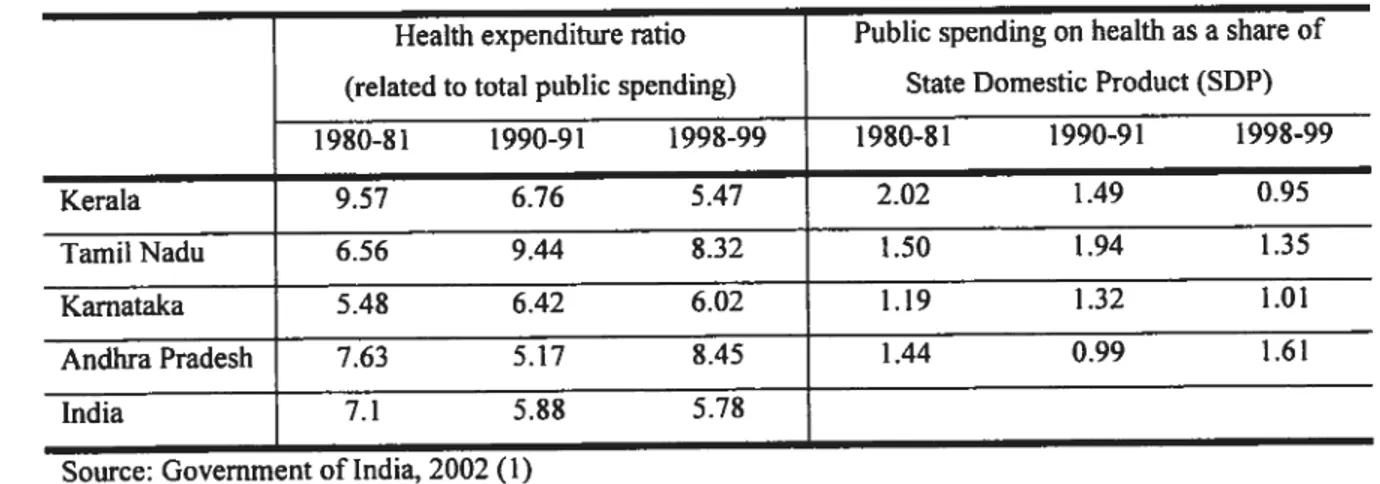
inception ofthe public health system (Kuffy, 2000). Although it spends more on health care per capita than other states, Kerala’s contribution lias diminished. Health expenditure feu from 9.6% to 5.5% as a share of government expenditure from 1980 to 1999. As a proportion of SDP, public spending decreased by 50% during the same period and by 35% in the 1990s alone (Table 2.9). Other south Indian states have tended to increase the proportion of public spending on health relative to total spending and have seen lower reductions in spending on health as a share of SDP. This places Kerala - along with other
south Indian states - among those with the highest reduction in public contribution and the
highest rise in private funding for health care (Bhat & Jain, 2004). This is happening at a time when the cost of hospital care is increasing at a higher rate than the index of general commodities due to application of more expensive technologies to medical care (Varatharajan, Sadanandan, Thankappan & Mohan Nair, 2002). This suggests that the current public contribution to health in Kerala is lower than in other south Indian states.
Table 2.9 Public spending on health, south Indian states and India
Health expenditure ratio Public spending on health as a share of (related to totaL public spending) State Domestic Product (SDP)
1980-81 1990-91 1998-99 1980-$1 1990-91 1998-99 Kerala 9.57 6.76 5.47 2.02 1.49 0.95 TamiiNadu 6.56 9.44 8.32 1.50 1.94 1.35 Kamataka 5.48 6.42 6.02 1.19 1.32 1.01 AndhraPradesh 7.63 5.17 8.45 1.44 0.99 1.61 India 7.1 5.88 5.78
Source: Government oflndia, 2002 (1)
Despite this, Kerala was stili the state with the highest per capita expenditure on health both in terms of public and private contributions in 1995-96 (World Bank, 2001). This is shown in figure 2.3 where Indian states are ranked according to their level of per capita expenditure. from this grapli we can also see that, in terms of the share in public expenditure on health, Kerala is in une with Indian levels, its private health spending per capita being roughly 4 times higher than its public health spending per capita.
20 Figure 2.3 Comparison of states by public and private health spending, 1995-96
140 KE w > PJ h. W lIN D Q. 120 Q. W o h. Ri DK.1 MH g 100 D
D AP: Andhra Pradesh WB BI: Bihar D AP GJ: Gujarat OR D HA: Haryana 80 D (P KA: Karnataka o. D KE: Kerala w MH: Maharastra D MP: Madhya Pradesh 60 BI OR: Crissa D PJ: Punjab R]: Rajasthan .2 TN:TamilNadu
UP: Uttar Pradesh
0. 40 WB: West Bengal
100 200 300 400 500
Privatehealthcare spending (rupees per capita per year)
In the context of such low levels of health insurance described above, most private health expenditure happens in the form of out-of-pocket expenditure. This is the most common form of health financing in the poorest of developing countries (Sekhri & Savedoff, 2005). These countries ofien face difficulties in mobilizing resources and in using existing resources efficiently and equitably. However, financing health care through out-of-pocket payments can create barriers to access to health care or a significant economic burden for the poor and other vuinerable groups (Xu, Evans, Kawabata, Zeramdini, Kiavus & Murray, 2003; James, Hanson, McPake, Balabanova, Gwatkin, Hopwood et al., 2006).
Availability ofhealh care infrastructure and human resources
Kerala has a long history of organized health services. Some of the government hospitals in the state are about 150 years old (Varatharajan, Sadanandan, Thankappan & Mohan Nair, 2002). The foundation for a medical care system was already well established by the time of the state formation in 1956. The period that followed was characterized by the expansion of govemment heaÏth services up until the early 1 9$Os and by a stabilisation of investments
in government infrastructure thereafler (Kutty, 2000). Kerala’s highly developed public health system now includes over 6000 heaÏth care institutions - defined as an establishment
where patients are examined or diagnosed for diseases and where medical treatment is prescribed and provided. These include institutions from allopathie, ayurvedic and homeopathic systems ofmedicine.6
The allopathie sector comprises Medical Colleges, District and local hospitals and Primary Health Centres (PUC) and sub centers (Varatharajan, Sadanandan, Thankappan & Mohan Nair, 2002). Medical Colleges are dispersed over the state and each district has a District Hospital - where specialized curative care is provided - and numerous sub district hospitals.
In rural areas, the Primary Health Centre is the basic medical institution - a type of
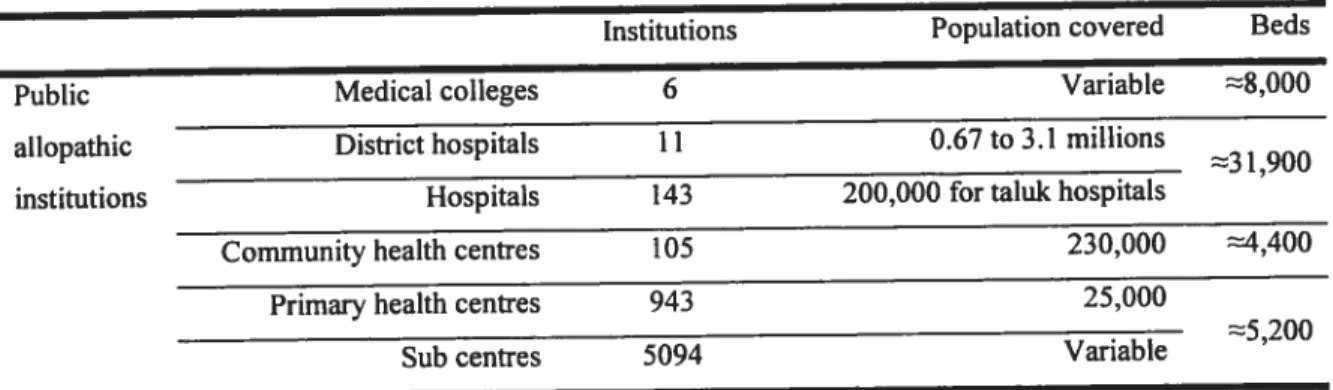
institution which is virtually absent in urban areas (Ramachandran, 1996). Institutions dedicated to the care for women and children, and others for infectious diseases, such as tuberculosis and leprosy, complete the health infrastructure. Around 20% of institutions and 40% of hospital beds are found in urban areas (Narayana & Han Kurup, 2000). About 40% of the govemment allopathie doctors work in the Medical Colleges (Varatharajan, Sadanandan, Thankappan & Mohan Nair, 2002). Kerala has the highest density of medical facilities in India. Table 2.10 describes the composition ofthe public health care system and population coverage in Kerala.
Table 2.10 Public allopathie care infrastructure, Kerala
Institutions Population covered Beds
Public Medical colleges 6 Variable $,000
allopathic District hospitals 11 0.67 to 3.1 millions
3l,900 institutions Hospitals 143 200,000 for taluic hospitals
Community health centres 105 230,000 4,400
Primary health centres 943 25,000
. 5200
Sub centres 094 Variable
Source: Varatharajan, Sadanandan, Thankappan & Mohan Nair, 2002
6 Ayurvedic and homeopathy are traditional systems of medicine. They are highly developed with their own systems of education and provision of health services. There are 690 ayurvedic and 415 homeopathic institutions. 0f the doctors in the government sector, 22% work in the Ayurvedic and Homeopathic systems.
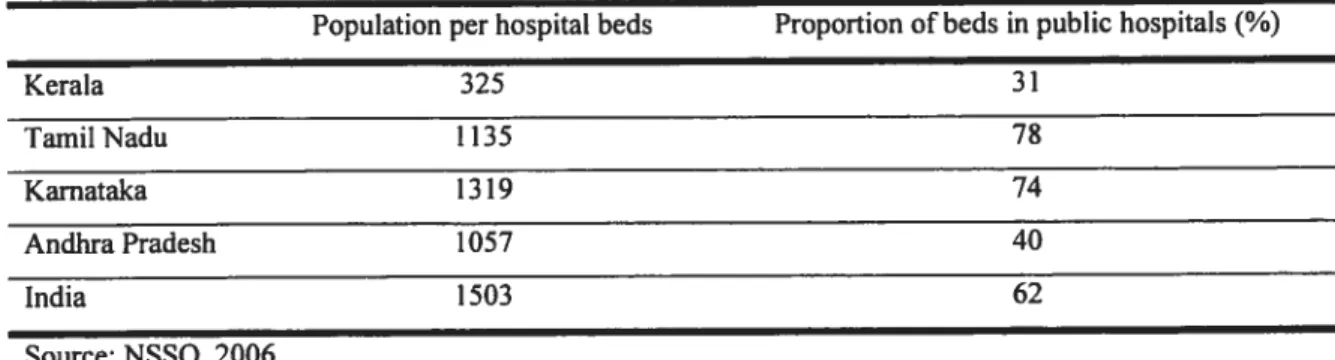
There are more than 300 hospital beds per 100 000 population in Kerala, which is probably one of the highest ratios in the developing world (Kutty, 2000; Bhat, 1999; Govemment of India, 2002 (1)). This translates into a ratio of 325 persons per hospital beds, a much lower ratio than any other states (Table 2.11). However, there is heterogeneity in the density of
medical institutions and beds across districts. The total density of institutions - and of
government institutions - is higher in southem districts (Narayana, 2006).
Table 2.11 Availability ofhospital beds, south Indian states and India, 2004.
Population per hospital beds Proportion ofbeds in public hospitals (%)
Kerata 325 31 TamiiNadu 1135 7$ Karnataka 1319 74 Andhra Pradesh 1057 40 India 1503 62 Source: NSSO, 2006
As stated in introduction, urban areas of developing countries tend to concentrate health care infrastructure, especiaiiy hospitals. But the distribution of these resources within cities is ofien unequal and their location not necessarily related to the level of health care needs of communities (Lorenz & Gamer, 1995; Harpham & Tanner, 1995; Viahov, Galea, Gibble & freudenberg, 2005). A previous study in south India suggested that the centralization of public and private heaith services generated a diminishing accessibiiity of health infrastructure in peripheral iess formaiised living areas of cities (Kumaran & Suseela,
1989). Poor populations ofien live in such informai settiements at the margin of the urban
core and couid thus face barriers to access heaith care services (Caimcross, Hardoy & Satterthwaite, 1990; Mahal, Yazbeck, Peters & Ramana, 2001).
Aithough density of infrastrusture is high in Kerala, variations in avaiiabiiity of beds and institutions are present between districts and the actuai distribution inside cities has flot been documented. Specific urban areas might show a relative lack of public or private health care infrastructure.
The public andprivate sector ofheaÏth care
Over the past four decades, the health system bas become a complex infrastructure in Kerala. It is now a mix of public and privately-owned facilities (Narayana, 2001). There are marked differences in provider qualifications with the coexistence of not-for-profit (e.g. voluntary health programmes, charitable institutions, missions, and trusts) and for-profit institutions (e.g. general practitioners, private hospitals and dispensaries, and registered medicai practitioners), as welI as a large informai sector (e.g. practitioners without formai training, faith healers, herbalists) (Bhat, 1993). The private sector’ s models of practice range from solo practices, nursing homes, to larger corporate hospitais (World Bank, 2001).
The public sector has not kept up with the growing demand for health care in recent years (Kumar, 1993; Nabae, 2003). Concems over its capacity to address the needs of the ageing population have been raised (Sureshkumar & Rai agopal, 1996; Bollini, Venkateshwara & Sureshkumar, 2004; Purohit, 2001). Concurrently, there was a considerable growth in private facilities, private beds and in the number of doctors working in the private sector, to the extent that these now outstrip govemment facilities in number.7 The proportion of beds in the private sector is by far the highest in Kerala (Table 2.11). With regards to hospital beds, the private sector grew by 37.7% compared to 5.5% in the public sector (Table 2.12). Many factors could have faciiitated this growth of the private sector. These include changes in social and economic factors- such as increasing per capita income and literacy - within a
context of minimal barriers and regulations to opening of private hospitals (Kutty, 2000).
This growth of the private sector along with difficulties of the public system to meet the needs of populations echoes the situation in other developing countries (Russell, 1996; Mehrotra & Jarret, 2002). Public institutions are ofien minor providers of health care (Thaver, Harpham, McPake & Garner, 1998; Mills, Brugha, Hanson & McPake, 2002). This is also mie in India, where the govemment lias neyer been a major source of outpatient care, despite its role in providing preventive and public health services (Berman, 2000).
The public sector now represents only 17.4% of institutions, 40.1% of beds and 13.6% of doctors. The private sector is prominent as it concentrates the large majority of the State’s doctors (86%), hospitals (82%) and hospital beds (58%) (Kufty, 2000; Varatharajan, Thankappan & Mohan Nair, 2002; Nabae 2003).