HAL Id: inserm-01408002
https://www.hal.inserm.fr/inserm-01408002
Submitted on 2 Dec 2016
HAL is a multi-disciplinary open access
archive for the deposit and dissemination of
sci-entific research documents, whether they are
pub-lished or not. The documents may come from
teaching and research institutions in France or
abroad, or from public or private research centers.
L’archive ouverte pluridisciplinaire HAL, est
destinée au dépôt et à la diffusion de documents
scientifiques de niveau recherche, publiés ou non,
émanant des établissements d’enseignement et de
recherche français ou étrangers, des laboratoires
publics ou privés.
First-line cART regimen impacts the course of CD8+
T-cell counts in HIV-infected patients that achieve
sustained undetectable viral load.
Isabelle Poizot-Martin, Clotilde Allavena, Cyrille Delpierre, Claudine
Duvivier, Véronique Obry-Roguet, Carla E Cano, Francine Guillouet de
Salvador, David Rey, Pierre Dellamonica, Antoine Cheret, et al.
To cite this version:
Isabelle Poizot-Martin, Clotilde Allavena, Cyrille Delpierre, Claudine Duvivier, Véronique
Obry-Roguet, et al.. First-line cART regimen impacts the course of CD8+ T-cell counts in HIV-infected
patients that achieve sustained undetectable viral load.. Medicine, Lippincott, Williams & Wilkins,
2016, 95, �10.1097/MD.0000000000005087�. �inserm-01408002�
First-line cART regimen impacts the course
of CD8
+
T-cell counts in HIV-infected patients
that achieve sustained undetectable viral load.
Isabelle Poizot-Martin, MD
a,b,∗, Clotilde Allavena, MD
c, Cyrille Delpierre, PhD
d,e, Claudine Duvivier, MD
f,g,h,
Véronique Obry-Roguet, BS
a, Carla E. Cano, PhD
a, Francine Guillouet de Salvador, MD
i, David Rey, MD
j,
Pierre Dellamonica, MD PhD
i, Antoine Cheret, MD
h,k, Lise Cuzin, MD
l, Christine Katlama, MD
m,n,o,
André Cabié, MD
p, Bruno Hoen, MD
q, for the Dat
’AIDS Study Group
Abstract
The aim of the study was to investigate the impact offirst-line combined antiretroviral therapy (cART) regimen on the course of CD8+ T-cell counts in human immunodeficiency virus (HIV)-infected patients.
A retrospective observational study conducted on the French DAT’AIDS Cohort of HIV-infected patients.
We selected 605 patients initiating afirst-line cART between 2002 and 2009, and which achieved a sustained undetectable HIV plasma viral load (pVL) for at least 12 months without cART modification. The evolution of CD8+T-cell counts according to cART regimen was assessed.
CD8+T-cell counts were assessed in 572 patients treated with 2NRTIs+1PI/r (n= 297), 2NRTIs+1NNRTI (n= 207) and 3NRTIs (n= 68). In multivariate analysis, after 12 months of follow-up, the 3NRTIs regimen was associated with a significantly smaller decrease of CD8+ T-cell count compared with NNRTI-containing regimens (–10.2cells/mL in 3NRTIs vs –105.1cells/mL; P=0.02) but not compared with PI-containing regimens (10.2 vs–60.9cells/mL; P=0.21). After 24 months, the 3NRTIs regimen was associated with a smaller decrease of CD8+T-cell count and % compared with PI/r- and NNRTI-containing regimens (0.2 in 3NRTIs vs–9.9 with
PI/r-regimens, P=0.001, and vs –11.1 with NNRTI-regimens, p<0.0001). A focus analysis on 11 patients treated with an INSTI-containing cART regimen during the study period showed after 12 months of follow-up, a median decrease of CD8+T-cell count of
–155 [inter quartile range: –302; –22] cells/mL.
Our data highlight the fact that cART regimens have differential effects on CD8 pool down regulation.
Abbreviations: cART= combined antiretroviral therapy, HIV = human immunodeficiency virus, INSTI = integrase strand transfer inhibitor, NNRTI= non-nucleotide reverse transcriptase inhibitor, NRTI = nucleotide reverse transcriptase inhibitor, PI/r = Ritonavir-boosted protease inhibitor, pVL= plasma viral load.
Keywords:CD4:CD8 ratio, CD8,first-line cart, non nucleotide reverse transcriptase inhibitors
1. Introduction
HIV infection leads to perturbations of peripheral T-cell homeostasis with a gradual depletion of CD4+ T-cells combined with an expansion of the CD8+ T-cell compartment. After
initiating combined antiretroviral therapy (cART), most HIV1-infected patients achieve sustained undetectable HIV plasma viral load (HIV-pVL) and restoration of the CD4+ T-cell compart-ment,[1]with an extent that depends on the level of CD4+ T-cell counts at the time of cART initiation.[2–6] In contrast, most
Editor: Ramon Teira Cobo.
The authors have no funding and conflicts of interest to disclose. Supplemental Digital Content is available for this article.
a
Aix-Marseille University, APHM Hôpital Sainte-Marguerite, Immuno-Hematology Clinic,b
Inserm U912 (SESSTIM), Marseille,c
CHU Hotel Dieu, Infectious Diseases Unit, Nantes,dInserm,eUniversité de Toulouse III, UMR1027, Toulouse,fAPHP- Necker Hospital, Infectious Diseases Department, Necker-Pasteur Infectious Diseases Center, IHU Imagine,g
Pasteur Institut, Medical Care Center, Necker-Pasteur Infectious Diseases Center France,h
Université Paris Descartes, Sorbonne Paris Cité, Paris,iInfectious Diseases Department, CHU of Nice, University Nice Sophia-Antipolis,jHôpitaux Universitaires Strasbourg, Center for HIV care, Strasbourg,kHospital Tourcoing, Infectious Disease Unit, Tourcoing,l
INSERM, UMR 1027, Toulouse III University, Toulouse, F-31000, France; CHU Toulouse, COREVIH Toulouse, F-31000,
m
AP-HP, Hospital Pitie-Salpetriere, Department of Infectious Diseases,n
UPMC Univ Paris,o
UMRS 943, Paris,p
CHU de Fort de France, Service de maladies infectieuses et tropicales, Martinique,q
Université des Antilles, Faculté de Médecine Hyacinthe Bastaraud, EA 4537; Centre Hospitalier Universitaire de Pointe-à-Pitre, Inserm CIC1424, Service de Maladies Infectieuses et Tropicales, Dermatologie, Médecine Interne, Pointe-à-Pitre, France.
∗
Correspondence: Isabelle Poizot-Martin, Aix-Marseille University, APHM- Sainte-Marguerite Hospital, Marseille, France (e-mail: isabelle.poizot@mail.ap-hm.fr). Copyright© 2016 the Author(s). Published by Wolters Kluwer Health, Inc. All rights reserved.
This is an open access article distributed under the terms of the Creative Commons Attribution-Non Commercial-No Derivatives License 4.0 (CCBY-NC-ND), where it is permissible to download and share the work provided it is properly cited. The work cannot be changed in any way or used commercially without permission from the journal.
Medicine (2016) 95:41(e5087)
Received: 1 June 2016 / Received infinal form: 1 September 2016 / Accepted: 14 September 2016 http://dx.doi.org/10.1097/MD.0000000000005087
Observational Study
Medicine
patients fail to normalize CD8+ T-cell count despite long term cART, and this resilience of high CD8+T-cell counts was recently linked to increased non-AIDS-related mortality.[7] Previous
studies have reported that the nature of antiretroviral drugs chosen for cART regimen affected CD4 recovery,[8,9]while the
impact of cART choice on the dynamics of CD8+T-cells remains elusive.
The aim of this study was to determine the impact of cART regimen on the course of CD8+ T-cell counts in HIV-infected patients who achieved sustained undetectable HIV-pVL on first-line cART.
2. Methods
2.1. Patient & Data collection
“The Dat’AIDS Cohort” is a multicenter cohort of 26959 HIV infected patients followed in fifteen major French HIV care centers using the NADIS® electronic medical record (Fedialis Medica, Marly le Roi, France).[10,11]In this cohort, patients’ data are recorded during medical visits, and quality control is performed by automated checks during data capture, regular controls by clinical research associates, annual assessments and ad hoc processes prior to analysis.[10,11]
For this study, we selected HIV-1 infected and treatment-naive patients who initiated afirst-line triple cART between Jan 2002 and Dec 2009 and who maintained an undetectable HIV plasma viral load (HIV-pVL) for at least 12 months without modification of cART regimen. Among them, we selected patients treated with a backbone of 2NRTIs combined with a ritonavir-boosted protease inhibitor (PI/r), or a non-nucleoside reverse transcriptase inhibitor (NNRTI), or a third NRTI. In addition, we analyzed separately patients treated with Integrase Strand Transfer Inhibitor (INSTI)-containing regimens, whatever the drug combination. All of these latter patients received raltegravir. 2.2. Outcome variables
Data on T-cell immunophenotyping (CD4+, CD8+T-cell counts
and CD4:CD8 ratio) were collected at the time of cART initiation (baseline), at the time of thefirst undetectable HIV-pVL (D0), and then after 12 (M12) and 24 months (M24) of follow-up with a sustained undetectable HIV-pVL without modification of cART regimen.
For T-cell immunophenotyping, a standardized procedure was performed on each site, briefly, fresh EDTA-whole blood (100m L) was incubated with combinations offluorochrome-conjugated monoclonal antibodies specific for CD3, CD4 and CD8 (Beck-man Coulter) and analyzed using a FC500 cytometer (Beck(Beck-man Coulter). Normal range of CD4+and CD8+T-cell counts were
established at 500 to 1200 cells/mL and 300 to 830cells/mL, respectively according to Reichert et al.[12]Plasma HIV-RNA was
quantified by successive standardized assays including Roche Cobas HIV-1 monitor, Roche Cobas Ampliprep/Cobas Taqman HIV-1 v.2 test, and Abbott RealTime HIV-1. Since the threshold value of HIV-RNA was not the same through the study period depending on the techniques available at each site (<20copies/ mL,<50copies/mL or <40copies/mL), the corresponding threshold for each period was considered.
2.3. Covariates
At baseline were collected the following potential confounders: sex, age, duration of HIV exposure since diagnosis, transmission
risk group, CDC stage, cytomegalovirus (Anti-cytomegalovirus IgG positive) and hepatitis C (hepatitis C virus (HCV)-RNA positive) co-infections, CD4 nadir, HIV-pVL at baseline, duration of treatment and delay to HIV suppression on cART. 2.4. Ethic statement
All subjects provided written informed consent for the use of their medical records on NADIS. This electronic medical record was approved by the French Commission Nationale Informatique et Liberté (Registration number: 2001/762876/nadiscnil.doc). This study was carried out in compliance with the International guidelines for human research protection as Declaration of Helsinki and International Conference on Harmonization in Good Clinical Practice (ICH-GCP).
2.5. Statistical Analysis
All analyses were performed on SPSS Advanced Statistics 20 (IBM Corp) and SAS 9.4. Patients’ characteristics were described at baseline according to CD8+T-cell counts and cART regimen.
Categories of patients according to CD8+T-cell counts (low< 300 cells/mL; normal 300–830cells/mL and high >830cells/mL) were defined after Reichert et al.[12]Median absolute counts and
percentage of CD4+, CD8+T-cells and CD4:CD8 ratio as well as
their variations (Delta,D) were compared between baseline and D0, and then between D0 and M12, D0 and M24, according to cART regimen (2NRTIs+IPI/r vs 2NRTIs+1NNRTI vs 3NRTIs). Factors associated with CD8+T-cell count and CD4:CD8 ratio were identified at each time in bivariate analysis using Kruskal–-Wallis tests for qualitative variables, and Chi-2 test or simple linear regression for quantitative variables. Evolution of CD8+
T-cell count and CD4:CD8 ratio at M12 and M24 by cART regimen were then studied using multiple linear regression models including the potential confounders known. The value at D0 of each outcome tested was forced in the models. Missing data were considered as such and thus, were not included in the analyses, were not replaced or extrapolated.
3. Results
Among the 5688 HIV-infected patients who initiated afirst-line triple antiretroviral treatment during the study period, 2074 had cART regimen unchanged for at least 12 months, of whom 830 patients had an undetectable HIV-pVL at all assessments, and 605 patients had data on HIV-pVL, CD4+and CD8+T-cell
counts available at the time of cART initiation (Supplementary Figure 1:flowchart, http://links.lww.com/MD/B358). Hence, 605 patients composed the study cohort, which had a median time of cART exposure of 32.3 (23.8–43.7) months.
3.1. Patients’ characteristics at baseline according to CD8+T-cell count
At baseline, CD8+T-cell counts were high (>830cells/mL) in 268
(44.3%) patients and low (< 300cells/mL) in 38 (6%) patients. After cART initiation, they were respectively 47.7% and 3.1% at D0 (viral suppression), 39.8% and 3.7% after 12 months, 43.7% and 4% after 24 months under cART and the difference for each categories was not significant. Table 1 shows the characteristics of patients distributed by ranges of CD8+T-cell count at the time of cART initiation. According to this classification, patients did not differ in age, sex, HIV transmission risk group, HCV
co-infection or prevalence of cytomegalovirus-positive serology. However, patients with CD8+T-cell count< 300cells/mL had significantly higher HIV-pVL, lower CD4+ T-cell values and
lower CD4 nadir. In contrast, median duration of HIV follow-up was significantly higher in patients with CD8+T-cell count>830
cells/mL. Median CD4:CD8 ratio was significantly higher in patients with CD8+T-cell counts within the normal range, but the fraction of patients with CD4:CD8 ratio≥ 1 was significantly higher in patients with CD8+T-cell counts< 300cells/mL.
3.2. Patients’ characteristics at baseline according to cART regimen
Overall, the impact of cART regimen on CD8+T-cell counts was
assessed on patients receiving 1 of these 3 cART regimens: 2NRTIs+1PI/r (n= 297), 2NRTIs+1NNRTI (n= 207) and 3NRTIs (n= 68). Characteristics of patients by cART regimens are reported in Table 2 and detailed antiretroviral regimens for each group are described in supplementary Table 1, http://links. lww.com/MD/B358. Eleven patients receiving an INSTI-containing cART regimen were analyzed separately. Twenty-two patients receiving other cART combinations were excluded. At baseline, patients receiving 3NRTIs differed significantly from those receiving 2NRTIs+1PI/r or 2NRTIs+1NNRTI by their longer median duration of HIV infection follow-up, shorter delay to HIV suppression after cART initiation, lower HIV-pVL, higher CD4 nadir and median CD4:CD8 ratio. Median CD4+
and CD8+ T-cell counts, and CD4:CD8 ratio significantly differed between the 3 groups but the proportion of patients with a CD4:CD8 ratio≥1 was similar at baseline. At the time of thefirst undetectable HIV-pVL (D0), median CD4+T-cell count was significantly higher in the 2NRTIs+1NNRTI group, while median CD8+T-cell count was no different between groups either in absolute value or in percentage. Median CD4:CD8 ratio was
similar between the groups, but the proportion of patients with a CD4:CD8 ratio≥1 was significantly lower in the 3NRTIs group. 3.3. Evolution of CD8+T-cell counts according to cART regimen after viral suppression
3.3.1. At M12.Twelve months after thefirst undetectable HIV-pVL, CD8+T-cell counts were available for 505 patients (2NRTIs
+1PI/r group: n= 262; 2NRTIs+1NNRTI group: n= 183; 3NRTIs group: n=60). Median CD8+T-cell counts were similar
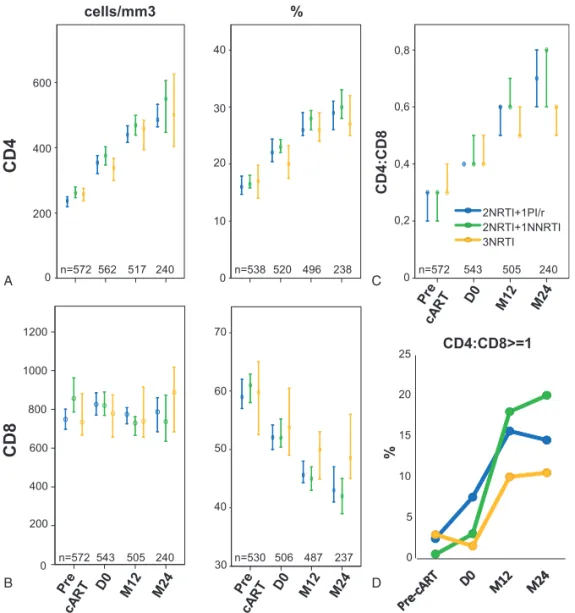
in all groups after 12 months in absolute value and percentage, as were CD4+T-cell counts (Fig. 1A and B). No significant differences
were observed between the groups regarding the distribution of patients by CD8+T-cell count (<300; 300–830 or >830cells/mL, Fig. 2A–C), or the median CD4:CD8 ratio (Fig. 1C).
Regarding the variations between D0 and M12, patients receiving 3NRTIs displayed the smaller decrease of absolute CD8+T-cell count (median variation (DCD8): –15 [inter quartile range (IQR): –173; 172] vs –43 [–212; 123] cells/mL in the 2NRTIs+1PI/r group and–128 [–275; 53] cells/mL in the 2NRTIs +1NNRTI group; P= 0.011). Median variation of CD4:CD8 ratio (DCD4:CD8) was significantly smaller in the 3NRTIs group (0.12 [0.04; 0.26]) compared to 2NRTIs+1NNRTI (0.16 [0.09; 0.31]; P=0.05), but this difference was not significant when compared to 2NRTIs+1PI/r (0.14 [0.07; 0.26]).
In multivariate analysis (Table 3), the 3NRTIs regimen was associated with a smaller decrease of CD8+ T-cell counts (DCD8) compared to 2NRTIs+1NNRTI regimens (P=0.02). No such significant difference was found between 3NRTIs and 2NRTIs +1PI/r regimens (P=0.21). Regarding DCD8%, the 3NRTIs regimen was associated with a smaller decrease of CD8% compared to PI/r- and NNRTI-containing regimens (P=0.007 and P=0.001, respectively). No significant difference of the variations of CD4:CD8 ratios were observed between the groups at M12 (Fig. 1C).
Table 1
Patients’ characteristics according to CD8+ T-cell count at baseline.
CD8 (cells/mL)
< 300 (n=38) 300–830 (n=299) >830 (n=268) P Males 26 (68.4%) 213 (71.2%) 202 (75.4%) 0.442 Age, y 45.5 (38.5; 54.2) 42.0 (36.0; 51.0) 45.0 (38.0; 51.0) 0.065 Transmission risk group
Heterosexual 19 (50.0%) 137 (45.8%) 126 (47.0%) 0.196 MSM 11 (28.9%) 128 (42.8%) 103 (38.4%)
IV drug user 2 (5.3%) 7 (2.3%) 16 (6.0%) Others 3 (7.9%) 8 (2.7%) 7 (2.6%) Unknown 3 (7.9%) 19 (6.4%) 16 (6.0%)
Follow-up of HIV infection, y 0.3 (0.1; 3.5) 0.9 (0.1; 3.1) 1.6 (0.3; 5.5) <0.001 CDC stage C 19 (50.0%) 41 (13.7%) 28 (10.5%) <0.001 CMV IgG+ 27 (79.4%) 223 (89.2%) 194 (88.6%) 0.244 HCV-RNA+ 3 (7.9%) 15 (5.1%) 16 (6.1%) 0.629 CD4 nadir, cells/mL 30 (12; 103) 210 (121; 269) 239 (177; 303) <0.001 HIV-pVL, log cp/mL 5.2 (4.4; 5.6) 4.7 (4.3; 5.3) 4.7 (4.2; 5.2) 0.016 CD4+T-cells: (cells/mL) 46 (12; 108) 236 (133; 287) 279 (215; 350) <0.001 (%) 10.2 (4.0; 20.7) 19.7 (12.7; 24.0) 14.4 (11.0; 18.9) <0.001 CD8+ T-cells: (cells/mL) 217 (135; 277) 616 (477; 722) 1169 (990; 1497) <0.001 (%) 48.5 (30.7; 57.0) 52.6 (46.0; 62.0) 66.0 (59.8; 73.3) <0.001 CD4:CD8 ratio 0.20 (0.07; 0.58) 0.38 (0.21; 0.51) 0.22 (0.15; 0.29) <0.001 CD4:CD8 ratio≥1 5 (13%) 7 (2.3%) 2 (0.7%) 0.001
Data are n (%) or median (IQR).
cART = combined antiretroviral therapy, CDC=centers for disease control and prevention (CDC) classification system, CMV =cytomegalovirus, HCV =hepatitis C virus, HIV-pVL =HIV plasma viral load, IQR=inter quartile range, IV=intravenous, MSM=men who have sex with men.
3.3.2. At M24. In total 240 patients achieved 24 months of follow-up without modification of cART regimens, of which 117, 85 and 38 patients received 2NRTIs+1PI/r, 2NRTIs+1NNRTI, and 3NRTIs regimens, respectively.
Median CD4+and CD8+T-cell counts were similar between the groups at M24 (Figs. 1A and Fig. 2B). Patients receiving 3NRTIs had significantly higher CD8% (48.4 [44.1; 58.8] % vs 43.0 [36.6; 52.7] % in 2NRTIs+1PI/r group and 42 [34.5; 50.3] % in the 2NRTIs+1NNRTI group; P=0.003). Median CD4:CD8 ratio was significantly lower in patients receiving 3NRTIs (P= 0.028, Fig. 1C) but the proportion of patients with a CD4:CD8 ratio≥1 did not differ significantly between the groups (Fig. 1D).
MedianDCD8% was significantly smaller in patients receiving 3NRTIs (–2.0 [–8.4; 5.3] %) compared to those receiving 2NRTIs+1PI/r and 2NRTIs+1NNRTI (-8.4 [–16.2; –3.9] % and 10.5 [–16.1; –6] %, respectively; P<0.001) and median DCD4: CD8 was significantly smaller in patients receiving 3NRTIs (0.1 [0.1; 0.3] %) compared to 2NRTIs+1PI/r and 2NRTIs+1NNRTI (0.3 [0.2; 0.4]% and 0.3 [0.2; 0.5]%; P < 0.01).
In multivariate analysis (Table 3, bottom), the 3NRTIs regimen was associated with a smaller decrease of CD8% compared to PI/ r- and NNRTI-containing regimens (P = 0.001 and P < 0.0001, respectively), and to a smaller increase of CD4:CD8 ratio (P = 0.10 and P = 0.01, respectively, Table 3).
Table 2
Patients’ characteristics by the cART regimen.
2NRTIs+1PI/r 2NRTIs+1NNRTI 3NRTIs
P n=297 n=207 n=68
Male 211 (71.0%) 153 (73.9%) 53 (77.9%) 0.472 Age, y 43 (36; 50) 43 (36; 52) 42 (39; 51) 0.791 Transmission risk group:
Heterosexual 145 (48.8%) 93 (44.9%) 33 (48.5%) 0.329 Homo/bisexual 115 (38.7%) 86 (41.5%) 23 (33.8%) IV drug use 13 (4.4%) 6 (2.9%) 6 (8.8%) Other 6 (2.2%) 8 (3.9%) 2 (2.9%) Unknown 18 (6.1%) 14 (6.8%) 4 (5.9%) CDC stage: A 201 (67.7%) 152 (73.4%) 49 (72.1%) 0.549 B 45 (15.2%) 29 (14.0%) 10 (14.7%) C 51 (17.2%) 25 (12.1%) 9 (13.2%) HCV-RNA + 18 (6.1%) 10 (4.8%) 6 (8.8%) 0.438 Anti-CMV IgG+ 223 (75.1%) 150 (72.5%) 54 (79.4%) 0.505 CD4 Nadir (cells/mL) 209 (92; 275) 226 (163; 296) 239 (155; 274) 0.012 Duration of HIV follow-up, y 0.8 (0.1; 3.4) 1.1 (0.2; 4.3) 1.9 (0.2; 6.5) 0.014 Duration of cART, mo 31.2 (23.2; 41.0) 32.2 (24.1; 41.1) 48.5 (30.4; 64.1) <0.001 Delay to HIV suppression, mo 3.2 (2.0; 5.4) 3.7 (2.0; 5.5) 2.0 (1.2; 4.4) 0.001 Pre-cART HIV-pVL (Log cp/mL) 4.9 (4.3; 5.4) 4.8 (4.4; 5.3) 4.4 (4.1; 4.8) <0.001 Pre-cART CD4 T-cells: cells/mL 238 (105; 311) 261 (173; 324) 257 (191; 300) 0.015 % 16.0 (8.5; 22.3) 16.5 (12.0; 20.7) 17.0 (13.0; 21.5) 0.430 <200 117 (39.4%) 61 (29.5%) 21 (30.9%) 0.233 200–350 133 (44.8%) 116 (56.0%) 37 (54.4%) 350–500 38 (12.8%) 26 (12.6%) 8 (11.8%) >500 9 (3.0%) 4 (1.9%) 2 (2.9%) Pre-cART CD8+T-cells: cells/mL 748 (505; 1070) 856 (590; 1204) 733 (557; 1035) 0.014 % 59.0 (49.1; 70.0) 61.0 (52.0; 68.0) 59.7 (49.9; 67.5) 0.747 <300 23 (7.7%) 8 (3.9%) 4 (5.9%) 0.034 300–830 157 (52.9%) 90 (43.5%) 36 (52.9%) >830 117 (39.4%) 109 (52.7%) 28 (41.2%) Pre-cART CD4:CD8 ratio 0.26 (0.12; 0.41) 0.28 (0.18; 0.38) 0.32 (0.20; 0.45) 0.027 Pre-cART CD4:CD8≥1 8 (1.9%) 1 (0.5%) 2 (3%) 0.103 D0- CD4+T-cells: cells/mL 354 (193; 484) 376 (285; 484) 338 (236; 412) 0.033 (%) 22.0 (13.0; 29.1) 23.0 (18.0; 28.8) 20.0 (16.3; 25.3) 0.074 D0- CD8+T-cells: cells/mL 826 (561; 1158) 820 (622; 1133) 779 (574; 1005) 0.332 % 52.1 (43.0; 63.0) 52.0 (42.1; 61.0) 53.8 (46.7; 62.2) 0.665 D0-CD4:CD8 ratio 0.40 (0.22; 0.63) 0.44 (0.29; 0.62) 0.44 (0.28; 0.62) 0.147 D0-CD4:CD8≥1 12.7% 8.2% 5.8% 0.05
Data are n (%) or median (IQR). IQR= inter quartile range.
D0 correspond to the time of thefirst undetectable HIV plasma viral load.
cART = combined antiretroviral therapy, CMV=cytomegalovirus, HCV =hepatitis C Virus, HIV-pVL =HIV plasma viral load, IV=intravenous, NNRTI =non-nucleoside reverse transcriptase inhibitors, NRTI= nucleoside reverse transcriptase inhibitors, PI/r=ritonavir-boosted protease inhibitors.
3.4. Focus on patients receiving an Integrase Strand Transfer Inhibitor (INSTI)-containing regimen infirst-line cART
Eleven patients of the study cohort received an INSTI-containing cART regimen. Most of patients were males (82%) with a median age of 43 [38; 53] year old and median time of HIV infection follow-up of 1.9 [1.2; 7.2] years. INSTI was combined to 2NRTIs for 8 patients and to 2NRTIs+1NNRTI in 3 cases. At baseline, median CD4+and CD8+T-cell counts were 340 [266; 397] cells/ mL and 646 [520; 1161] cells/mL, respectively, and 36.4% of patients had CD8+ T-cell count >830cells/mL. Median CD4: CD8 ratio was 0.48[0.27; 0.69] and<1 in 90% of patients at baseline. At D0, median CD4+ and CD8+ T-cell counts had
increased to reach 484 [366; 577] cells/mL and 835 [531; 1130] cells/mL, respectively. The proportion of patients with a CD8+
T-cell count>830cells/mL dropped to 18.2%. Median CD4:CD8 ratio was 0.5 [0.41; 0.78], and CD4:CD8 ratio was< 1 in 82% of cases. All patients had their INSTI-containing first-line cART regimen unchanged after 12 months; they were only 2 patients after 24 months. After 12 months of viral suppression, median CD4+T-cell count was 541[409; 797] cells/mL with a median DCD4 of 133 [-26; 206] cells/ml, whereas median CD8+T-cell
count decreased to 683 [539; 797] cells/mL with a median variation of –155 [–302; –22] cells/mL. The proportion of patients with CD8+ T-cell count >830cells/mL was 20%
(Fig. 2D). Conversely, median CD4:CD8 ratio improved to 0.7 [0.63; 1.02] and was≥1 in 36.4% of patients after 12 months of viral suppression.
4. Discussion
This study performed on a large cohort of HIV-1-infected patients achieving sustained HIV suppression for at least 12 months without modification of cART regimen showed that: (i) the proportion of patients presenting with a high CD8+T-cell
count remained stable despite a sustained HIV suppression for 24 months; (ii) compared to 2NRTIs+1PI/r and 2NRTIs+1NNRTI regimens, the combination of 3NRTIs was associated with the smaller decrease of CD8+T-cell counts after 24 months of viral suppression.
Our data are consistent with recent observations reporting the persistence of elevated CD8+ T-cell counts after 10 years of
cART.[7] In our cohort, 44% of patients presented with high CD8+ T-cell counts (>830cells/mL) at the time of cART
200 0 400 600 10 20 30 40 0
CD4
cells/mm3 % CD4:CD8 0 200 400 600 800 1000 1200CD8
50 60 70 40 30 0 0,2 0,4 0,6 0,8 2NRTI+1PI/r 2NRTI+1NNRTI 3NRTI 0 5 10 15 20 25 % CD4:CD8>=1 n=572 n=538 n=572 n=530 n=572 562 520 543 506 543 517 496 505 487 505 240 240 238 240 237 A B C DFigure 1. Comparative analysis of the impact of first-line cART regimen on T-cell compartments and CD4:CD8 ratio in HIV-infected patients. Graphs illustrate median [IQR] CD4+(A) and CD8+(B) T-cell counts (cells/mL) and percentages (%), and CD4:CD8 ratio (C) prior to cART initiation (Pre-cART), at the first undetectable HIV-pVL (D0) and after 12 (M12) or 24 (M24) months of HIV suppression, in patients receiving 2NRTIs+1PI/r, 2NRTIs+1NNRTI, or 3NRTIs asfirst-line cART. (D) Graph shows the fraction of patients (%) achieving normalization of CD4:CD8 ratio (≥ 1) according to first-line cART regimens. cART = combined antiretroviral therapy, HIV= human immunodeficiency virus, n=number of observations, INSTI = integrase strand transfer inhibitor, NNRTI = non-nucleotide reverse transcriptase inhibitor, NRTI= nucleotide reverse transcriptase inhibitor, PI/r = Ritonavir-boosted protease inhibitor, pVL = plasma viral load.
initiation. These patients had significantly longer HIV follow-up, higher CD4 nadir and higher CD4+T-cell counts, but their HIV-pVL did not differ from patients with normal or low CD8+T-cell counts. Hence, a high HIV-pVL does not seem to be a pivotal factor for CD8 hyperlymphocytosis. The association between the duration of HIV follow-up and CD8+T-cell count was no longer
significant after 6 months of HIV suppression regardless of cART regimens (data not shown). However, other factors such viral coinfections may affect the down regulation of the CD8 compartment upon viral suppression. Indeed, we have previously shown that HCV coinfection is associated with high CD8+T-cell counts in long-term HIV suppressors on cART.[13]Nevertheless, in this cohort the number of HCV coinfected patients was too small for being a confounder.
The persistence of high CD8+T-cell counts despite a durable
control of HIV replication might be explained by a premature immune senescence of CD8+T-cells, as described for naïve
HIV-infected patients.[14]Indeed, senescent CD8+T-cells accumulate over time, which is likely to counter the normalization of CD4: CD8 ratio.[15]Unfortunately, immune senescence could not be evaluated in our study. However, evidences of the association between expanded CD8 immunosenescent and/or activated subpopulations and accelerated progression of HIV disease keep on accumulating.[16,17,18–21]
Up to date, the impact of cART regimen on immune recovery during clinical trials and observational cohorts was mostly evaluated in terms of CD4+T-cell recovery, while data on CD8+
T-cells are scarce. Risk of non-AIDS related events and death was reported to correlate to high CD8+T-cell counts (>1500cells/mL) in patients achieving sustained undetectable HIV-pVL.[7] Al-though CD4:CD8 ratio was shown to be a reliable predictor of the evolution of HIV-disease,[22–24] its improvement does not always correlate with recovery of the CD4 compartment. Altogether, these data and ours stress the need to consider not only the evolution of CD4:CD8 ratio but also CD8+T-cell count,
in absolute value and percentage, for the evaluation of immune restoration under cART.
Interestingly, we did not observe a significant difference of the variation of the CD8 compartment between patients receiving PI/ r and NNRTI-containing regimens. The small number of patients receiving an INSTI-containing cART regimen in our cohort did not allow us to compare this group to other. However, after 12 months of viral suppression, this subpopulation of patients receiving INSTI displayed the most important decrease of CD8+
T-cell counts observed in this study and, moreover, the highest CD8+T-cell count at baseline (>830cells/mL), the biggest drop
after 12 months of HIV suppression. A recent study performed in 39 naive patients receiving a combination of raltegravir and TDF/ FTC showed that CD4 recovery was associated with an early and transient increase of CD8+T-cell count, but was not different from baseline after 12 months of follow-up.[25]
In our study, 38 patients displayed low CD8+T-cell counts (<300cells/mL) at cART initiation, which has previously been associated with bad prognosis.[7]According to Helleberg’s study,
3.9 2.5 5.4 4.4 43.5 48.2 49.4 56.3 52.7 49.2 45.2 39.3 0% 10% 20% 30% 40% 50% 60% 70% 80% 90% 100% Pre-cART n=207 n=197D0 M6 n=168 M12 n=183 >830 cells/µl 300-830 cells/µl <300 cells/µl 7.7 2.8 3.3 8.0 52.9 48.4 52.9 55.7 39.4 48.8 43.8 41.2 0% 10% 20% 30% 40% 50% 60% 70% 80% 90% 100% Pre-cART D0 n=281 n=242M6 n=262M12 n=297 0% 5.9 6.2 3.2 3.3 52.9 52.3 66.1 53.3 41.2 41.5 30.6 43.3 10% 20% 30% 40% 50% 60% 70% 80% 90% 100% Pre-cART n=68 n=65D0 M6 n=62 M12 n=60 63.6 72.7 54.5 80 36.4 18.2 45.4 20 0% 10% 20% 30% 40% 50% 60% 70% 80% 90% 100% Pre-cART n=11 n= 11D0 n= 11M6 n= 10M12 2N R T I+1 P I/r 2NRTI+1NNRTI 3NRTI s IN ST I-containing regimens A B C D
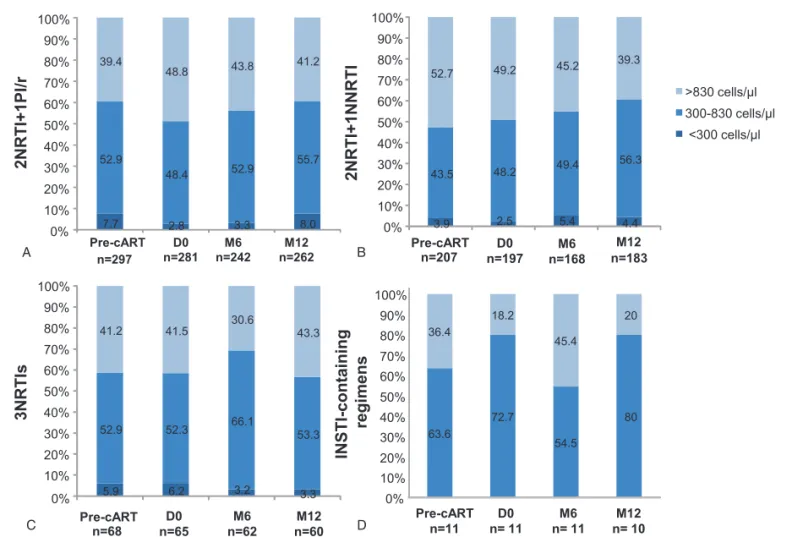
Figure 2. Distribution of patients by ranges of CD8+ T-cell counts according to first-line cART regimen. Stacked bars represent the proportions of patients with high (>830cells/mL), normal (300–830cells/mL), and low (< 300cells/mL) CD8+T-cell counts among patients receiving 2NRTI+1PI/r (A), 2NRTI+1NNRTI (B),
3NRTIs (C), or in patients receiving an INSTI-containing regimen (D). cART= combined antiretroviral therapy, HIV = human immunodeficiency virus, n=number of observations, INSTI= integrase strand transfer inhibitor, NNRTI = non-nucleotide reverse transcriptase inhibitor, NRTI = nucleotide reverse transcriptase inhibitor. Poizot-Martin et al. Medicine (2016) 95:41 Medicine
patients that display a CD8+T-cell count< 500cells/mL a year after cART initiation, are at higher risk of mortality due to AIDS-related conditions. In our study, patients with low CD8+ T-cell count had higher HIV-pVL, lower CD4+T-cell values and lower CD4 nadir, which was also observed after 10 years of cART treatment in Helleberg’s study. During the study period, the proportion of these patients remained stable, whatever the cART regimens. Unfortunately, this retrospective study did not allow us to evaluate morbidities and mortality rate.
One limitation of this study is that, despite the large number of patients of the Dat’AIDS cohort, the fraction of patients receiving an unchangedfirst-line cART regimen that could be analyzed after 24 months of viral suppression is rather small. Nevertheless, it should be considered that the rate of cART regimen modification and interruption is particularly high during the first year of cART, as observed in our study and other contemporary studies.[26]Secondly, due to the period of patient selection, the potential impact of last generation antiretroviral drugs currently recommended for cART initiation, like INSTI, was investigated in a very small number of patients. Finally, regarding the retrospective design of the study, only the potential confounders available in our database could be used in the multiple linear regression models. Thus, we cannot rule out the role of others factors than cART regimen, such as comorbidities, to explain the differences observed between the different drug combinations.
In conclusion, our study showed that the number of CD8+ T-cells remains high despite a sustained control of HIV replication onfirst-line cART, and that cART regimen has an impact on the course of CD8+T-cells. NRTI-only regimens in naive patients
may be associated with poor immune restoration, as reflected by a poor down regulation of the CD8 compartment, while patients receiving INSTI-containing regimens displayed encouraging
results regarding CD8 down regulation. Hence, the immune balance leading to CD4:CD8 recovery does not only depend on the time of cART initiation but might also be conditioned by the effect of drug regimen on the evolution of CD8+T-cell count.
Acknowledgments
The authors would like to thank Hervé Bismut for editorial assistance in the preparation of the manuscript, and the members of the Dat’Aids group: S. Brégigeon, O. Faucher, V. Obry-Roguet, M. Orticoni, M.J. Soavi, I. Luquet-Besson, E. Ressiot, I. Pinot, M.J. Ducassou, H. Bertone, S. Galie, S. Trijau, A.S. Ritleng, A. Ivanova, C Lions, C.E. Cano, I. Poizot-Martin (Marseille); B. Marchou, P. Massip, E. Bonnet, M. Obadia, M. Alvarez, L. Porte, L. Cuzin, P. Delobel, G. Martin-Blondel, A. Debard, M. Chauveau, N. Biedzunski, D. Garipuy, M. Mularczyk, J. Bernard, I. Lepain, M. Marcel, E. Puntis, K. Sauné (Toulouse); P. Pugliese, C. Ceppi, E. Cua, J. Cottalorda, P. Dellamonica, E. Demonchy, B. Dunais, J. Durant, C. Etienne, S. Ferrando, JG Fuzibet, R. Garraffo, K. Risso, V. Mondain, A. Naqvi, N. Oran, I. Perbost, S. Pillet, B. Prouvost-Keller, C. Pradier, S. Wehrlen-Pugliese, E. Rosenthal, S. Sausse, P.-M. Roger (Nice); F. Raffi, C. Allavena, E. Billaud, C. Biron, B. Bonnet, S. Bouchez, D. Boutoille, C. Brunet, T. Jovelin, N. Hall, C. Bernaud, P. Morineau, V. Reliquet, O. Aubry, P. Point, M. Besnier, L. Larmet, H. Hüe, S. Pineau, M. Cavellec, F. Vivrel, O. Grossi, M. Lefebvre (Nantes); A. Cheret, F. Ajana, I. Alcaraz,.V Baclet, Ph. Choisy, S. Dassonneville, H. Gueroumi, M. Marien, H. Melliez, B. Riff, X. de la Tribonnière, M. Valette, N. Viguet, Y. Yazdanpanah, (Tourcoing); R. Agher, C. Katlama, M.-A. Valantin, C. Aguilar, P. Bossi, G. Cessot, C. Charlier, P.H. Consigny, F. Durand, C. Duvivier, A. Gergely, B. Henry, F. Lanternier, O. Lortholary, C. Louisin, P. Parize, C. Rouzaud, F. Touam (Paris); J. Beytout, H. Laurichesse, O Lesens, M. Vidal, N Mrozek, O. Baud, S. Dydymski, C. Aumeran, V. Corbin, D. Coban, S. Casanova (Clermont-Ferrand). Ph. Choisy, S.Van-dame, Th. Huleux, F.Ajana, I. Alcaraz, V. Baclet, TH. Huleux, H. Melliez, N. Viget, M. Valette, E. Aissi, Ch. Allienne, A. Meybeck, B. Riff, (Tourcoing). E. Ebel, P. Fischer, M.L. Partisani, D Rey, M. Priester, C. Bernard-Henry, C Cheneau, M.L. Batard, E. de Mautort (Strasbourg). L. Cotte, D. Peyramond, C. Chidiac, T. Ferry, F. Ader, F. Biron, A. Boibieux, P. Miailhes, T. Perpoint, I. Schlienger, F. Dahoud, J. Lippmann, E. Braun, J. Koffi, C. Longuet, V. Guéripel, C. Augustin-Normand, S. Degroodt (Lyon). Potential conflict of interest: I.P-M. has had associations with Gilead, BMS, AbbVie and MSD. C.A. has had associations with BMS, MSD, Gilead, Janssen, ViiV Healthcare and Mylan. C.D. Has had associations with ViiV Healthcare, BMS, MSD and Janssen. D.R. has had associations with Gilead and MSD. L.C. had associations with BMS and ViiV Healthcare. C.K. has had associations with Gilead, Roche, GlaxoSmithKline, Tibotec, Bristol Myers Squibb and Boehringer Ingelheim.
References
[1] Battegay M, Nuesch R, Hirschel B, et al. Immunological recovery and antiretroviral therapy in HIV-1 infection. Lancet Infect Dis 2006; 6:280–7.
[2] Kaufmann GR, Perrin L, Pantaleo G, et al. CD4 T-lymphocyte recovery in individuals with advanced HIV-1 infection receiving potent antiretroviral therapy for 4 years: the Swiss HIV Cohort Study. Arch Intern Med 2003;163:2187–95.
[3] Moore RD, Keruly JC. CD4+ cell count 6 years after commencement of highly active antiretroviral therapy in persons with sustained virologic suppression. Clin Infect Dis 2007;44:441–6.
Table 3
Evolution at M12 and M24 of CD8 according to the cART regimen. Multivariate linear regression.
2NRTI+1PI/r 2NRTI+1NNRTIs 3NRTIs At M12 N=250 N=177 N=58 D CD8-M12-D0 Cells/mm3(SE)† –60.9 (17.1) –105.1 (20.3)∗ –10.2 (36.1) % (SE)‡ –6.8 (0.5)∗∗ –7.6 (0.7)∗∗ –2.7 (1.4) DCD4:CD8ratioM12-D0 (SE)x 0.19 (0.01) 0.22 (0.02) 0.15 (0.03) At M24 N=117 N=85 N=38 D CD8-M24-D0 Cells/mm3(SE)jj –99.7 (31.5) –121.0 (36.2) –15.3 (55.8) % (SE)¶ –9.9 (1.1)∗∗∗ –11.1 (1.3)∗∗∗ 0.2 (2.3) DCD4:CD8 ratio M24-D0 (SE)# 0.28 (0.02) 0.33 (0.03)∗∗ 0.20 (0.04)
NNRTI=non-nucleoside reverse transcriptase inhibitors, NRTI =nucleoside reverse transcriptase inhibitors, PI/r=ritonavir-boosted protease inhibitors, SE = standard error.
†Model adjusted for confounders: duration of HIV at treatment initiation, CD4 nadir, pre-cART HIV-pVL,
CD8 at D0.
‡Model adjusted for confounders: duration of HIV at treatment initiation, duration of treatment, delay to
HIV suppression, CD8% at D0.
xModel adjusted for confounders: CD4 nadir, pre-cART HIV-pVL, CD4/CD8 ratio at D0. jjModel adjusted for confounders: CD4 nadir, duration of HIV at treatment initiation, duration of
treatment, CD8 at D0.
¶Model adjusted for confounders: duration of treatment, CD8% at D0.
#Model adjusted for confounders: CD4 nadir, duration of treatment, delay to HIV suppression, CD4/
CD8 ratio at D0. ∗ P-value <0.05. ∗∗ P-value <0.01. ∗∗∗ P-value <0.001; ref=3NRTIs.
[4] Gras L, Kesselring AM, Griffin JT, et al. CD4 cell counts of 800cells/mm3
or greater after 7 years of highly active antiretroviral therapy are feasible in most patients starting with 350 cells/mm3or greater. J Acquir Immune
Defic Syndr 2007;45:183–92.
[5] Mocroft A, Phillips AN, Gatell J, et al. Normalisation of CD4 counts in patients with HIV-1 infection and maximum virological suppression who are taking combination antiretroviral therapy: an observational cohort study. Lancet 2007;370:407–13.
[6] Le Moing V, Thiebaut R, Chene G, et al. Long-term evolution of CD4 count in patients with a plasma HIV RNA persistently<500copies/mL during treatment with antiretroviral drugs. HIV Med 2007;8:156–63. [7] Helleberg M, Kronborg G, Ullum H, et al. Course and clinical
significance of CD8+ T-cell counts in a large cohort of HIV-infected individuals. J Infect Dis 2015;211:1726–34.
[8] Mocroft A, Phillips AN, Ledergerber B, et al. Relationship between antiretrovirals used as part of a cART regimen and CD4 cell count increases in patients with suppressed viremia. AIDS 2006;20: 1141–50.
[9] Wolbers M, Battegay M, Hirschel B, et al. CD4+ T-cell count increase in HIV-1-infected patients with suppressed viral load within 1 year after start of antiretroviral therapy. Antivir Ther 2007;12:889–97. [10] Pugliese P, Cuzin L, Cabie A, et al. A large French prospective cohort of
HIV-infected patients: the Nadis Cohort. HIV Med 2009;10:504–11. [11] Pugliese P, Cuzin L, Enel P, et al. [NADIS 2000, development of an
electronic medical record for patients infected by HIV, HBV and HCV]. Presse Med 2003;32:299–303.
[12] Reichert T, DeBruyere M, Deneys V, et al. Lymphocyte subset reference ranges in adult Caucasians. Clin Immunol Immunopathol 1991;60: 190–208.
[13] Zaegel-Faucher O, Bregigeon S, Cano CE, et al. Impact of hepatitis C virus coinfection on T-cell dynamics in long-term HIV-suppressors under combined antiretroviral therapy. AIDS 2015;29:1505–10.
[14] Tassiopoulos K, Landay A, Collier AC, et al. CD28-negative CD4+ and CD8+ T cells in antiretroviral therapy-naive HIV-infected adults enrolled in adult clinical trials group studies. J Infect Dis 2012;205:1730–8. [15] Effros RB, Dagarag M, Spaulding C, et al. The role of CD8+ T-cell
replicative senescence in human aging. Immunol Rev 2005;205:147–57.
[16] Giorgi JV, Detels R. T-cell subset alterations in HIV-infected homosexual men: NIAID Multicenter AIDS cohort study. Clin Immunol Immuno-pathol 1989;52:10–8.
[17] Sousa AE, Carneiro J, Meier-Schellersheim M, et al. CD4 T cell depletion is linked directly to immune activation in the pathogenesis of HIV-1 and HIV-2 but only indirectly to the viral load. J Immunol 2002;169:3400–6. [18] Deeks SG, Kitchen CM, Liu L, et al. Immune activation set point during early HIV infection predicts subsequent CD4+ T-cell changes indepen-dent of viral load. Blood 2004;104:942–7.
[19] Liu Z, Cumberland WG, Hultin LE, et al. CD8+ T-lymphocyte activation in HIV-1 disease reflects an aspect of pathogenesis distinct from viral burden and immunodeficiency. J Acquir Immune Defic Syndr Hum Retrovirol 1998;18:332–40.
[20] Effros RB, Allsopp R, Chiu CP, et al. Shortened telomeres in the expanded CD28-CD8+ cell subset in HIV disease implicate replicative senescence in HIV pathogenesis. AIDS 1996;10:F17–22.
[21] Unemori P, Leslie KS, Hunt PW, et al. Immunosenescence is associated with presence of Kaposi’s sarcoma in antiretroviral treated HIV infection. AIDS 2013;27:1735–42.
[22] Margolick JB, Gange SJ, Detels R, et al. Impact of inversion of the CD4/ CD8 ratio on the natural history of HIV-1 infection. J Acquir Immune Defic Syndr 2006;42:620–6.
[23] Buggert M, Frederiksen J, Noyan K, et al. Multiparametric bioinformat-ics distinguish the CD4/CD8 ratio as a suitable laboratory predictor of combined T cell pathogenesis in HIV infection. J Immunol 2014;192: 2099–108.
[24] Sainz T, Serrano-Villar S, Diaz L, et al. The CD4/CD8 ratio as a marker T-cell activation, senescence and activation/exhaustion in treated HIV-infected children and young adults. AIDS 2013;27:1513–6.
[25] Funderburg NT, Andrade A, Chan ES, et al. Dynamics of immune reconstitution and activation markers in HIV+ treatment-naive patients treated with raltegravir, tenofovir disoproxil fumarate and emtricitabine. PLoS One 2013;8:e83514.
[26] Abgrall S, Ingle SM, May MT, et al. Durability offirst ART regimen and risk factors for modification, interruption or death in HIV-positive patients starting ART in Europe and North America 2002–2009. AIDS 2013;27:803–13.