arXiv:1106.6308v1 [hep-ex] 30 Jun 2011
Measurement of the anomalous like-sign dimuon charge asymmetry with 9 fb
−1of
p¯
p
collisions
V.M. Abazov,35 B. Abbott,73 B.S. Acharya,29M. Adams,49 T. Adams,47 G.D. Alexeev,35 G. Alkhazov,39
A. Altona,61 G. Alverson,60G.A. Alves,2 M. Aoki,48 M. Arov,58A. Askew,47 B. ˚Asman,41 O. Atramentov,65
C. Avila,8 J. BackusMayes,80F. Badaud,13 L. Bagby,48B. Baldin,48 D.V. Bandurin,47 S. Banerjee,29 E. Barberis,60
P. Baringer,56 J. Barreto,3J.F. Bartlett,48 U. Bassler,18 V. Bazterra,49 S. Beale,6A. Bean,56 M. Begalli,3
M. Begel,71 C. Belanger-Champagne,41 L. Bellantoni,48 S.B. Beri,27 G. Bernardi,17 R. Bernhard,22
I. Bertram,42 M. Besan¸con,18 R. Beuselinck,43V.A. Bezzubov,38 P.C. Bhat,48 V. Bhatnagar,27 G. Blazey,50
S. Blessing,47 K. Bloom,64 A. Boehnlein,48 D. Boline,70 E.E. Boos,37 G. Borissov,42 T. Bose,59 A. Brandt,76
O. Brandt,23 R. Brock,62 G. Brooijmans,68 A. Bross,48D. Brown,17 J. Brown,17 X.B. Bu,48 M. Buehler,79
V. Buescher,24V. Bunichev,37 S. Burdinb,42 T.H. Burnett,80 C.P. Buszello,41 B. Calpas,15E. Camacho-P´erez,32
M.A. Carrasco-Lizarraga,56B.C.K. Casey,48 H. Castilla-Valdez,32 S. Chakrabarti,70D. Chakraborty,50
K.M. Chan,54A. Chandra,78G. Chen,56 S. Chevalier-Th´ery,18D.K. Cho,75S.W. Cho,31S. Choi,31B. Choudhary,28
S. Cihangir,48 D. Claes,64 J. Clutter,56 M. Cooke,48 W.E. Cooper,48 M. Corcoran,78 F. Couderc,18
M.-C. Cousinou,15A. Croc,18 D. Cutts,75 A. Das,45 G. Davies,43 K. De,76S.J. de Jong,34E. De La Cruz-Burelo,32
F. D´eliot,18M. Demarteau,48R. Demina,69D. Denisov,48 S.P. Denisov,38 S. Desai,48C. Deterre,18K. DeVaughan,64
H.T. Diehl,48 M. Diesburg,48 P.F. Ding,44A. Dominguez,64T. Dorland,80 A. Dubey,28 L.V. Dudko,37 D. Duggan,65
A. Duperrin,15 S. Dutt,27 A. Dyshkant,50 M. Eads,64 D. Edmunds,62 J. Ellison,46V.D. Elvira,48Y. Enari,17
H. Evans,52A. Evdokimov,71 V.N. Evdokimov,38G. Facini,60T. Ferbel,69 F. Fiedler,24 F. Filthaut,34W. Fisher,62
H.E. Fisk,48 M. Fortner,50H. Fox,42S. Fuess,48 A. Garcia-Bellido,69 V. Gavrilov,36P. Gay,13 W. Geng,15, 62
D. Gerbaudo,66C.E. Gerber,49 Y. Gershtein,65 G. Ginther,48, 69 G. Golovanov,35 A. Goussiou,80P.D. Grannis,70
S. Greder,19 H. Greenlee,48 Z.D. Greenwood,58E.M. Gregores,4 G. Grenier,20 Ph. Gris,13 J.-F. Grivaz,16
A. Grohsjean,18S. Gr¨unendahl,48M.W. Gr¨unewald,30 T. Guillemin,16 F. Guo,70 G. Gutierrez,48 P. Gutierrez,73
A. Haasc,68 S. Hagopian,47 J. Haley,60 L. Han,7 K. Harder,44A. Harel,69 J.M. Hauptman,55 J. Hays,43 T. Head,44
T. Hebbeker,21D. Hedin,50 H. Hegab,74 A.P. Heinson,46U. Heintz,75 C. Hensel,23 I. Heredia-De La Cruz,32
K. Herner,61 G. Heskethd,44 M.D. Hildreth,54 R. Hirosky,79 T. Hoang,47 J.D. Hobbs,70 B. Hoeneisen,12
M. Hohlfeld,24 Z. Hubacek,10, 18 N. Huske,17 V. Hynek,10 I. Iashvili,67 Y. Ilchenko,77 R. Illingworth,48A.S. Ito,48
S. Jabeen,75M. Jaffr´e,16 D. Jamin,15 A. Jayasinghe,73R. Jesik,43 K. Johns,45 M. Johnson,48 D. Johnston,64
A. Jonckheere,48 P. Jonsson,43 J. Joshi,27 A.W. Jung,48 A. Juste,40 K. Kaadze,57 E. Kajfasz,15D. Karmanov,37
P.A. Kasper,48I. Katsanos,64R. Kehoe,77 S. Kermiche,15 N. Khalatyan,48A. Khanov,74 A. Kharchilava,67
Y.N. Kharzheev,35M.H. Kirby,51J.M. Kohli,27A.V. Kozelov,38J. Kraus,62S. Kulikov,38 A. Kumar,67 A. Kupco,11
T. Kurˇca,20V.A. Kuzmin,37 J. Kvita,9 S. Lammers,52 G. Landsberg,75 P. Lebrun,20 H.S. Lee,31 S.W. Lee,55
W.M. Lee,48 J. Lellouch,17 L. Li,46 Q.Z. Li,48 S.M. Lietti,5 J.K. Lim,31 D. Lincoln,48 J. Linnemann,62
V.V. Lipaev,38 R. Lipton,48 Y. Liu,7Z. Liu,6 A. Lobodenko,39 M. Lokajicek,11R. Lopes de Sa,70 H.J. Lubatti,80
R. Luna-Garciae,32 A.L. Lyon,48 A.K.A. Maciel,2 D. Mackin,78R. Madar,18 R. Maga˜na-Villalba,32 S. Malik,64
V.L. Malyshev,35Y. Maravin,57 J. Mart´ınez-Ortega,32 R. McCarthy,70 C.L. McGivern,56 M.M. Meijer,34
A. Melnitchouk,63 D. Menezes,50 P.G. Mercadante,4 M. Merkin,37 A. Meyer,21 J. Meyer,23 F. Miconi,19
N.K. Mondal,29 G.S. Muanza,15 M. Mulhearn,79 E. Nagy,15 M. Naimuddin,28 M. Narain,75 R. Nayyar,28
H.A. Neal,61 J.P. Negret,8P. Neustroev,39 S.F. Novaes,5T. Nunnemann,25G. Obrant‡,39 J. Orduna,78N. Osman,15
J. Osta,54 G.J. Otero y Garz´on,1 M. Padilla,46 A. Pal,76 N. Parashar,53V. Parihar,75S.K. Park,31 J. Parsons,68
R. Partridgec,75 N. Parua,52 A. Patwa,71 B. Penning,48 M. Perfilov,37K. Peters,44Y. Peters,44K. Petridis,44
G. Petrillo,69P. P´etroff,16 R. Piegaia,1M.-A. Pleier,71 P.L.M. Podesta-Lermaf,32V.M. Podstavkov,48P. Polozov,36
A.V. Popov,38 M. Prewitt,78 D. Price,52 N. Prokopenko,38S. Protopopescu,71 J. Qian,61 A. Quadt,23 B. Quinn,63
M.S. Rangel,2 K. Ranjan,28 P.N. Ratoff,42 I. Razumov,38 P. Renkel,77 M. Rijssenbeek,70 I. Ripp-Baudot,19
F. Rizatdinova,74 M. Rominsky,48 A. Ross,42 C. Royon,18 P. Rubinov,48 R. Ruchti,54G. Safronov,36G. Sajot,14
P. Salcido,50 A. S´anchez-Hern´andez,32 M.P. Sanders,25 B. Sanghi,48 A.S. Santos,5 G. Savage,48L. Sawyer,58
T. Scanlon,43 R.D. Schamberger,70 Y. Scheglov,39 H. Schellman,51 T. Schliephake,26 S. Schlobohm,80
C. Schwanenberger,44R. Schwienhorst,62J. Sekaric,56 H. Severini,73 E. Shabalina,23 V. Shary,18 A.A. Shchukin,38
R.K. Shivpuri,28 V. Simak,10 V. Sirotenko,48P. Skubic,73 P. Slattery,69 D. Smirnov,54K.J. Smith,67 G.R. Snow,64
D.A. Stoyanova,38M. Strauss,73D. Strom,49L. Stutte,48 L. Suter,44 P. Svoisky,73M. Takahashi,44 A. Tanasijczuk,1
W. Taylor,6 M. Titov,18 V.V. Tokmenin,35 Y.-T. Tsai,69 D. Tsybychev,70 B. Tuchming,18C. Tully,66 L. Uvarov,39
S. Uvarov,39 S. Uzunyan,50R. Van Kooten,52W.M. van Leeuwen,33N. Varelas,49 E.W. Varnes,45 I.A. Vasilyev,38
P. Verdier,20 L.S. Vertogradov,35M. Verzocchi,48 M. Vesterinen,44 D. Vilanova,18 P. Vokac,10 H.D. Wahl,47
M.H.L.S. Wang,48J. Warchol,54G. Watts,80M. Wayne,54 M. Weberg,48 L. Welty-Rieger,51A. White,76 D. Wicke,26
M.R.J. Williams,42 G.W. Wilson,56 M. Wobisch,58 D.R. Wood,60 T.R. Wyatt,44 Y. Xie,48C. Xu,61 S. Yacoob,51
R. Yamada,48 W.-C. Yang,44 T. Yasuda,48 Y.A. Yatsunenko,35 Z. Ye,48 H. Yin,48 K. Yip,71 S.W. Youn,48
J. Yu,76 S. Zelitch,79 T. Zhao,80 B. Zhou,61 J. Zhu,61 M. Zielinski,69 D. Zieminska,52 and L. Zivkovic75
(The D0 Collaboration∗)
1Universidad de Buenos Aires, Buenos Aires, Argentina
2LAFEX, Centro Brasileiro de Pesquisas F´ısicas, Rio de Janeiro, Brazil
3Universidade do Estado do Rio de Janeiro, Rio de Janeiro, Brazil
4Universidade Federal do ABC, Santo Andr´e, Brazil
5Instituto de F´ısica Te´orica, Universidade Estadual Paulista, S˜ao Paulo, Brazil
6Simon Fraser University, Vancouver, British Columbia, and York University, Toronto, Ontario, Canada
7University of Science and Technology of China, Hefei, People’s Republic of China
8Universidad de los Andes, Bogot´a, Colombia
9Charles University, Faculty of Mathematics and Physics,
Center for Particle Physics, Prague, Czech Republic
10Czech Technical University in Prague, Prague, Czech Republic
11Center for Particle Physics, Institute of Physics,
Academy of Sciences of the Czech Republic, Prague, Czech Republic
12Universidad San Francisco de Quito, Quito, Ecuador
13LPC, Universit´e Blaise Pascal, CNRS/IN2P3, Clermont, France
14LPSC, Universit´e Joseph Fourier Grenoble 1, CNRS/IN2P3,
Institut National Polytechnique de Grenoble, Grenoble, France
15CPPM, Aix-Marseille Universit´e, CNRS/IN2P3, Marseille, France
16LAL, Universit´e Paris-Sud, CNRS/IN2P3, Orsay, France
17LPNHE, Universit´es Paris VI and VII, CNRS/IN2P3, Paris, France
18CEA, Irfu, SPP, Saclay, France
19IPHC, Universit´e de Strasbourg, CNRS/IN2P3, Strasbourg, France
20IPNL, Universit´e Lyon 1, CNRS/IN2P3, Villeurbanne, France and Universit´e de Lyon, Lyon, France
21III. Physikalisches Institut A, RWTH Aachen University, Aachen, Germany
22Physikalisches Institut, Universit¨at Freiburg, Freiburg, Germany
23II. Physikalisches Institut, Georg-August-Universit¨at G¨ottingen, G¨ottingen, Germany
24Institut f¨ur Physik, Universit¨at Mainz, Mainz, Germany
25Ludwig-Maximilians-Universit¨at M¨unchen, M¨unchen, Germany
26Fachbereich Physik, Bergische Universit¨at Wuppertal, Wuppertal, Germany
27Panjab University, Chandigarh, India
28Delhi University, Delhi, India
29Tata Institute of Fundamental Research, Mumbai, India
30University College Dublin, Dublin, Ireland
31Korea Detector Laboratory, Korea University, Seoul, Korea
32CINVESTAV, Mexico City, Mexico
33Nikhef, Science Park, Amsterdam, the Netherlands
34Radboud University Nijmegen, Nijmegen, the Netherlands and Nikhef, Science Park, Amsterdam, the Netherlands
35Joint Institute for Nuclear Research, Dubna, Russia
36Institute for Theoretical and Experimental Physics, Moscow, Russia
37Moscow State University, Moscow, Russia
38Institute for High Energy Physics, Protvino, Russia
39Petersburg Nuclear Physics Institute, St. Petersburg, Russia
40Instituci´o Catalana de Recerca i Estudis Avan¸cats (ICREA) and Institut de F´ısica d’Altes Energies (IFAE), Barcelona, Spain
41Stockholm University, Stockholm and Uppsala University, Uppsala, Sweden
42Lancaster University, Lancaster LA1 4YB, United Kingdom
43Imperial College London, London SW7 2AZ, United Kingdom
44The University of Manchester, Manchester M13 9PL, United Kingdom
45University of Arizona, Tucson, Arizona 85721, USA
46University of California Riverside, Riverside, California 92521, USA
47Florida State University, Tallahassee, Florida 32306, USA
48Fermi National Accelerator Laboratory, Batavia, Illinois 60510, USA
49University of Illinois at Chicago, Chicago, Illinois 60607, USA
51Northwestern University, Evanston, Illinois 60208, USA
52Indiana University, Bloomington, Indiana 47405, USA
53Purdue University Calumet, Hammond, Indiana 46323, USA
54University of Notre Dame, Notre Dame, Indiana 46556, USA
55Iowa State University, Ames, Iowa 50011, USA
56University of Kansas, Lawrence, Kansas 66045, USA
57Kansas State University, Manhattan, Kansas 66506, USA
58Louisiana Tech University, Ruston, Louisiana 71272, USA
59Boston University, Boston, Massachusetts 02215, USA
60Northeastern University, Boston, Massachusetts 02115, USA
61University of Michigan, Ann Arbor, Michigan 48109, USA
62Michigan State University, East Lansing, Michigan 48824, USA
63University of Mississippi, University, Mississippi 38677, USA
64University of Nebraska, Lincoln, Nebraska 68588, USA
65Rutgers University, Piscataway, New Jersey 08855, USA
66Princeton University, Princeton, New Jersey 08544, USA
67State University of New York, Buffalo, New York 14260, USA
68Columbia University, New York, New York 10027, USA
69University of Rochester, Rochester, New York 14627, USA
70State University of New York, Stony Brook, New York 11794, USA
71Brookhaven National Laboratory, Upton, New York 11973, USA
72Langston University, Langston, Oklahoma 73050, USA
73University of Oklahoma, Norman, Oklahoma 73019, USA
74Oklahoma State University, Stillwater, Oklahoma 74078, USA
75Brown University, Providence, Rhode Island 02912, USA
76University of Texas, Arlington, Texas 76019, USA
77Southern Methodist University, Dallas, Texas 75275, USA
78Rice University, Houston, Texas 77005, USA
79University of Virginia, Charlottesville, Virginia 22901, USA
80University of Washington, Seattle, Washington 98195, USA
(Dated: June 30, 2011)
We present an updated measurement of the anomalous like-sign dimuon charge asymmetry Ab
sl
for semi-leptonic b-hadron decays in 9.0 fb−1 of pp collisions recorded with the D0 detector at
a center-of-mass energy of √s = 1.96 TeV at the Fermilab Tevatron collider. We obtain Ab
sl =
(−0.787 ± 0.172 (stat) ± 0.093 (syst))%. This result differs by 3.9 standard deviations from the prediction of the standard model and provides evidence for anomalously large CP violation in semi-leptonic neutral B decay. The dependence of the asymmetry on the muon impact parameter is consistent with the hypothesis that it originates from semi-leptonic b-hadron decays.
PACS numbers: 13.25.Hw; 14.40.Nd; 11.30.Er
I. INTRODUCTION
We measure the like-sign dimuon charge asymmetry of semi-leptonic decays of b hadrons,
Ab sl≡ Nb++− N−− b N++ b + N −− b , (1)
in 9.0 fb−1 of p¯p collisions recorded with the D0 detector
at a center-of-mass energy√s = 1.96 TeV at the Fermi-lab Tevatron collider. Here N++
b and N −−
b are the
num-ber of events containing two positively charged or two
∗with visitors from aAugustana College, Sioux Falls, SD, USA, bThe University of Liverpool, Liverpool, UK,cSLAC, Menlo Park,
CA, USA, dUniversity College London, London, UK, eCentro
de Investigacion en Computacion - IPN, Mexico City, Mexico,
fECFM, Universidad Autonoma de Sinaloa, Culiac´an, Mexico, and gUniversit¨at Bern, Bern, Switzerland.‡Deceased.
negatively charged muons, respectively, both of which are produced in prompt semi-leptonic b-hadron decays. At the Fermilab Tevatron p¯p collider, b quarks are produced mainly in b¯b pairs. Hence, to observe an event with two like-sign muons from semi-leptonic b-hadron decay, one of the hadrons must be a B0or B0
s meson that oscillates
and decays to a muon of charge opposite of that expected from the original b quark [1]. The oscillation B0
q ↔ ¯B0q
(q = d or s) is described by higher order loop diagrams that are sensitive to hypothetical particles that may not be directly accessible at the Tevatron.
The asymmetry Ab
sl has contributions from the
semi-leptonic charge asymmetries ad
sl and assl of B 0 and B0 s mesons [2], respectively: Ab sl = Cdadsl+ Csassl, (2) with aqsl = ∆Γq ∆Mq tan φq, (3)
the mass and width differences between the eigenstates of the propagation matrices of the neutral B0
q mesons. The
coefficients Cdand Csdepend on the mean mixing
proba-bility, χ0, and the production rates of B0and B0smesons.
We use the values of these quantities measured at LEP as averaged by the Heavy Flavor Averaging Group (HFAG) [3] and obtain
Cd = 0.594± 0.022,
Cs = 0.406± 0.022. (4)
The value of χ0 measured by the CDF Collaboration
re-cently [4] is consistent with the LEP value, which sup-ports this choice of parameters. Using the standard model (SM) prediction for ad
sland assl [5], we find
Ab
sl(SM) = (−0.028+0.005−0.006)%, (5)
which is negligible compared to present experimental sen-sitivity. Additional contributions to CP violation via loop diagrams appear in some extensions of the SM and can result in an asymmetry Ab
slwithin experimental reach
[6–10].
This Article is an update to Ref. [11] that reported ev-idence for an anomalous like-sign dimuon charge asym-metry with 6.1 fb−1 of data, at the 3.2 standard
devia-tion level. All notadevia-tions used here are given in Ref. [11]. This new measurement is based on a larger dataset and further improvements in the measurement technique. In addition, the asymmetry’s dependence on the muon im-pact parameter (IP) [12] is studied. The D0 detector is described in Ref. [13]. We include a brief overview of the analysis in Sec. II. Improvements made to muon selections are presented in Sec. III; the measurement of all quantities required to determine the asymmetry Ab
sl
is described in Secs. IV–X, and the result is given in Sec. XI. Sections XII–XIII present consistency checks of the measurement; Sec. XIV describes the study of the asymmetry’s IP dependence. Conclusions are given in Sec. XV.
II. METHOD
The elements of our analysis are described in detail in Ref. [11]. Here, we summarize briefly the method, em-phasizing the improvements to our previous procedure. We use two sets of data: (i) inclusive muon data collected with inclusive muon triggers that provide n+ positively
charged muons and n− negatively charged muons, and
(ii) like-sign dimuon data, collected with dimuon trig-gers that provide N++events with two positively charged
muons and N−− events with two negatively charged
muons. If an event contains more than one muon, each muon is included in the inclusive muon sample. Such events constitute about 0.5% of the total inclusive muon sample. If an event contains more than two muons, the two muons with the highest transverse momentum (pT)
are selected for inclusion in the dimuon sample. Such
events comprise about 0.7% of the total like-sign dimuon sample.
From these data we obtain the inclusive muon charge asymmetry a and the like-sign dimuon charge asymmetry A, defined as a = n + − n− n++ n−, A = N ++ − N−− N+++ N−−. (6)
In addition to a possible signal asymmetry Ab sl, these
asymmetries have contributions from muons produced in kaon and pion decay, or from hadrons that punch through the calorimeter and iron toroids to penetrate the outer muon detector. The charge asymmetry related to muon detection and identification also contributes to a and A. These contributions are measured with data, with only minimal input from simulation. The largest contribution by far is from kaon decays. Positively charged kaons have smaller cross sections in the detector material than nega-tively charged kaons [14], giving them more time to decay. This difference produces a positive charge asymmetry.
We consider muon candidates with pT in the range 1.5
to 25 GeV. This range is divided into six bins as shown in Table I. The inclusive muon charge asymmetry a can be expressed [11] as a = 6 X i=1 fµi{fSi(aS+ δi) + fKi aiK+ fπiaiπ+ fpiaip}, (7)
where the fraction of reconstructed muons, fi
µ, in a given
pT interval i in the inclusive muon sample is given in
Ta-ble I. The fractions of these muons produced by kaons, pions, and protons in a given pT interval i are fKi , fπi,
and fi
p, and their charge asymmetries are aiK, aiπ, and
ai
p, respectively. We refer to these muons as “long” or
“L” muons since they are produced by particles travel-ing long distances before decaytravel-ing within the detector material. The track of a L muon in the central tracker is dominantly produced by the parent hadron. The charge asymmetry of L muons results from the difference in the interactions of positively and negatively charged parti-cles with the detector material, and is not related to CP violation. The background fraction is defined as fi
bkg= fKi + fπi + fpi. The quantity fSi = 1− fbkgi is the
fraction of muons from weak decays of b and c quarks and τ leptons, and from decays of short-lived mesons (φ, ω, η, ρ0). We refer to these muons as “short” or “S”
muons, since they arise from the decay of particles at small distances from the p¯p interaction point. These par-ticles are not affected by interactions in the detector ma-terial, and once muon detection and identification imbal-ances are removed, the muon charge asymmetry aS must
therefore be produced only through CP violation in the underlying physical processes. The quantity δiin Eq. (7)
is the charge asymmetry related to muon detection and identification. The background charge asymmetries ai
ai
π, and aip are measured in the inclusive muon data, and
include any detector asymmetry. The δi therefore
ac-counts only for S muons and is multiplied by the factor fi
S.
The like-sign dimuon charge asymmetry A can be ex-pressed [11] as A = FSSAS+ FSLaS+ 6 X i=1 Fi µ{(2 − Fbkgi )δi +Fi KaiK+ Fπiaπi + Fpiaip}. (8)
The quantity AS is the charge asymmetry of the events
with two like-sign S muons. The quantity FSS is the
fraction of like-sign dimuon events with two S muons, FSL is the fraction of like-sign dimuon events with one
S and one L muon. We also define the quantity FLL
as the fraction of like-sign dimuon events with two L muons. The quantity Fi
µ is the fraction of muons in the
pT interval i in the like-sign dimuon data. The quantities
Fi
x(x = K, π, p) are defined as Fxi≡ 2Nxi/Nµi, where Nxi
is the number of muons produced by kaons, pions, and protons, respectively, in a pT interval i, with Nµi being the
number of muons in this interval, with the factor of two taking into account the normalization of these quantities per like-sign dimuon event. The quantity Fi
bkg is a sum
over muons produced by hadrons:
Fbkgi ≡ FKi + Fπi+ Fpi. (9) We also define Fbkg as Fbkg ≡ 6 X i=1 (FµiFbkgi ) (10) = FSL+ 2FLL = 1 + FLL− FSS. (11)
The estimated contribution from the neglected quadratic terms in Eq. (8) is approximately 2× 10⁻⁵, which
cor-responds to about 5% of the statistical uncertainty on A.
The asymmetries aS and AS in Eqs. (7) and (8) are
the only asymmetries due to CP violation in the pro-cesses producing S muons, and are proportional to the asymmetry Ab
sl:
aS = cbAbsl,
AS = CbAbsl. (12)
The dilution coefficients cb and Cb are discussed in
Ref. [11] and in Sec. X below.
Equations (7) – (12) are used to measure the asym-metry Ab
sl. The major contributions to the uncertainties
on Ab
sl are from the statistical uncertainty on A and the
total uncertainty on Fi
K, fKi and δi. To reduce the latter
contributions, we measure the asymmetry Ab
sl using the
asymmetry A′, which is defined as
A′
≡ A − αa. (13)
TABLE I: Fractions of muon candidates in the inclusive muon
sample (fi
µ) and in the like-sign dimuon sample (Fµi, with two
entries per event).
Bin Muon pT range (GeV) fµi F
i µ 1 1.5 − 2.5 0.0077 0.0774 2 2.5 − 4.2 0.2300 0.3227 3 4.2 − 5.6 0.4390 0.3074 4 5.6 − 7.0 0.1702 0.1419 5 7.0 − 10.0 0.1047 0.1057 6 10.0 − 25.0 0.0484 0.0449
Since the same physical processes contribute to both Fi K
and fi
K, their uncertainties are strongly correlated, and
therefore partially cancel in Eq. (13) for an appropriate choice of the coefficient α. The contribution from the asymmetry Ab
sl, however, does not cancel in Eq. (13)
be-cause cb ≪ Cb [11]. Full details of the measurements of
different quantities entering in Eqs. (7) – (12) are given in Ref. [11]. The main improvements in the present anal-ysis are related to muon selection and the measurement of Fi
K and fKi . These modifications are described in
Sec-tions III, IV and V.
III. MUON SELECTION
The muon selection is similar to that described in Ref. [11]. The inclusive muon and like-sign dimuon sam-ples are obtained from data collected with single and dimuon triggers, respectively. Charged particles with transverse momentum in the range 1.5 < pT < 25 GeV
and with pseudorapidity|η| < 2.2 [15] are considered as muon candidates. The upper limit on pT is applied to
suppress the contribution of muons from W and Z bo-son decays. To ensure that the muon candidate passes through the detector, including all three layers of the muon system, we require either pT > 4.2 GeV or a
lon-gitudinal momentum component|pz| > 5.4 GeV. Muon
candidates are selected by matching central tracks with a segment reconstructed in the muon system and by ap-plying tight quality requirements aimed at reducing false matching and background from cosmic rays and beam halo. The transverse impact parameter of the muon track relative to the reconstructed p¯p interaction vertex must be smaller than 0.3 cm, with the longitudinal distance from the point of closest approach to this vertex smaller than 0.5 cm. Strict quality requirements are also applied to the tracks and to the reconstructed p¯p interaction ver-tex. The inclusive muon sample contains all muons pass-ing the selection requirements. If an event contains more than one muon, each muon is included in the inclusive muon sample. The like-sign dimuon sample contains all events with at least two muon candidates with the same charge. These two muons are required to have an invari-ant mass greater than 2.8 GeV to minimize the number of events in which both muons originate from the same b
quark (e.g., b→ µ, b → c → µ). Compared to Ref. [11], the following modifications to the muon selection are ap-plied:
• To reduce background from a mismatch of tracks in the central detector with segments in the outer muon system, we require that the sign of the cur-vature of the track measured in the central tracker be the same as in the muon system. This selec-tion was not applied in Ref. [11], and removes only about 1% of the dimuon events.
• To ensure that the muon candidate can penetrate all three layers of the muon detector, we require either a transverse momentum pT > 4.2 GeV,
or a longitudinal momentum component |pz| >
5.4 GeV, instead of pT > 4.2 GeV or |pz| > 6.4
GeV in Ref. [11]. With this change, the number of like-sign dimuon events increases by 25%, with-out impacting the condition that the muon must penetrate the calorimeter and toroids, as can be deduced from Fig. 1.
• To reduce background from kaon and pion decays in flight, we require that the χ2calculated from the
difference between the track parameters measured in the central tracker and in the muon system be χ2< 12 (for 4 d.o.f.) instead of 40 used in Ref. [11].
With this tighter selection, the number of like-sign dimuon events is decreased by 12%.
Compared to the selections applied in Ref. [11], the total number of like-sign dimuon events after applying all these modifications is increased by 13% in addition to the increase due to the larger integrated luminosity of this analysis.
The muon charge is determined by the central tracker. The probability of charge mis-measurement is obtained by comparing the charge measured by the central tracker and by the muon system and is found to be less than 0.1%.
The polarities of the toroidal and solenoidal magnetic fields are reversed on average every two weeks so that the four solenoid-toroid polarity combinations are exposed to approximately the same integrated luminosity. This al-lows for a cancellation of first-order effects related to the instrumental asymmetry [16]. To ensure such cancella-tion, the events are weighted according to the number of events for each data sample corresponding to a dif-ferent configuration of the magnets’ polarities. These weights are given in Table II. During the data taking of the last part of the sample, corresponding to approx-imately 2.9 fb−1 of p¯p collisions, the magnet polarities
were specially chosen to equalize the number of dimuon events with different polarities in the entire sample. The weights in Table II are therefore closer to unity compared to those used in Ref. [11].
FIG. 1: (color online). Smallest muon momentum required to penetrate the calorimeter and toroids at different pseudo-rapidities, |η| (solid line), and the momentum selection used in this analysis (dashed line).
TABLE II: Weights assigned to the events recorded with dif-ferent solenoid and toroid polarities in the inclusive muon and like-sign dimuon samples.
Solenoid Toroid Weight Weight
polarity polarity inclusive muon like-sign dimuon
−1 −1 0.994 0.964 −1 +1 1.000 1.000 +1 −1 0.985 0.958 +1 +1 0.989 0.978 IV. MEASUREMENT OFfK, fπ, fp The fraction fi
K in the inclusive muon sample is
mea-sured using K∗0→ K+π− decays, with the kaon
identi-fied as a muon (see Ref. [11] for details). The transverse momentum of the K+meson is required to be in the p
T
interval i. Since the momentum of a particle is measured by the central tracking detector, a muon produced by a kaon is assigned the momentum of this kaon (a small cor-rection for kaons decaying within the tracker volume is introduced later). The fraction fi
K∗0 of these decays is converted to the fraction fi
K using the relation
fi K= ni(KS0) ni(K∗+→ KS0π+) fi K∗0, (14)
where ni(KS0) and ni(K∗+→ KS0π+) are the number of
reconstructed K0 S → π
+π− and K∗+ → K0 Sπ
+ decays,
respectively. The transverse momentum of the K0 S
0
2500
5000
7500
10000
x 10
0.4
0.45
0.5
0.55
0.6
M(
π
+π
-)
[
GeV
]
Entries
DØ, 9.0 fb
-1χ
2/dof = 78/37
FIG. 2: (color online). The π+π− invariant mass
distribu-tion for K0
Scandidates in the inclusive muon sample with at
least one pion identified as a muon with 4.2 < pT(K0S) < 5.6
GeV. The solid line represents the result of the fit to the K0
S
content, and the dashed line represents the fitted background contribution.
addition that one of the pions from the K0
S → π
+π−
decay be identified as a muon. In the previous analy-sis [11] the production of K∗+ mesons was studied in a
sample of events with an additional reconstructed muon, but we did not require that this muon be associated with a pion from K0
S → π
+π− decay. The fraction of events
containing b and/or c quarks was therefore enhanced in the sample, which could result in a bias of the measured fraction fK. This bias does not exceed the systematic
un-certainty of fKand its impact on the Abslvalue is less than
0.03%. The application of the new requirement ensures that the flavor composition in the selected K∗+→ K0
Sπ +
and K∗0 → K+π− samples is the same and this bias is
eliminated.
The selection criteria and fitting procedures used to select and determine the number of K0
S, K∗+ and K∗0
events are given in Ref. [11]. As an example, Fig. 2 displays the π+π− invariant mass distribution and the
fitted K0
S → π
+π− candidates in the inclusive muon
sample, with at least one pion identified as a muon, for 4.2 < pT(KS0) < 5.6 GeV. Figure 3 shows the KS0π+
mass distribution and fit to K∗+ → K0
Sπ+ candidates
for all K0
S candidates with 4.2 < pT(KS0) < 5.6 GeV and
480 < M (π+π−) < 515 MeV. Figure 4 shows the K+π−
mass distribution and the fit result for K∗0 → K+π−
candidates for all kaons with 4.2 < pT(K+) < 5.6 GeV.
The K+π−mass distribution contains contributions from
light meson resonances decaying to π+π−. The most
important contribution comes from the ρ0
→ π+π−
de-cay with π → µ. It produces a broad peak in the mass region close to the K∗0 mass. The distortions in the
background distribution due to other light resonances, which are not identified explicitly, can also be seen in Fig. 4. Our background model therefore includes the contribution of ρ0
→ π+π− and two additional
Gaus-sian terms to take into account the distortions around 1.1 GeV. More details of the background description are given in Ref. [11].
5000
10000
15000
0.8
0.9
1
1.1
1.2
1.3
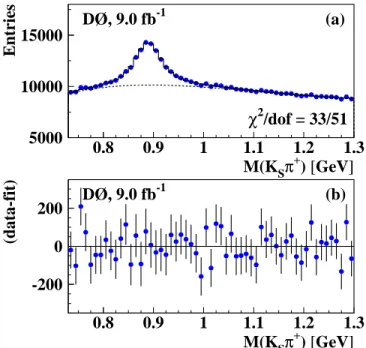
M(K
Sπ
+)
[
GeV
]
Entries
(a)
DØ, 9.0 fb
-1χ
2/dof = 33/51
-200
0
200
0.8
0.9
1
1.1
1.2
1.3
M(K
Sπ
+)
[
GeV
]
(data-fit)
(b)
DØ, 9.0 fb
-1FIG. 3: (color online). (a) The K0
Sπ+ invariant mass
dis-tribution for K∗+ candidates in the inclusive muon sample.
The KS0 candidate is required to have 480 < M (π+π−) < 515
MeV and 4.2 < pT(KS0) < 5.6 GeV. The solid line represents
the result of the fit to the K∗+ content, and the dashed line
shows the background contribution. (b) Difference between data and the result of the fit.
The measurement of the fractions fπ and fp is also
performed using the method of Ref. [11]. The values of fK and fπare divided by the factors CK and Cπ,
respec-tively, which take into account the fraction of kaons and pions reconstructed by the tracking system before they decay. These factors are discussed in Ref. [11], and are determined through simulation. Contrary to Ref. [11], this analysis determines these factors separately for kaons and pions. We find the values:
CK = 0.920± 0.006,
Cπ = 0.932± 0.006. (15)
The uncertainties include contributions from the num-ber of simulated events and from the uncertainties in the momentum spectrum of the generated particles.
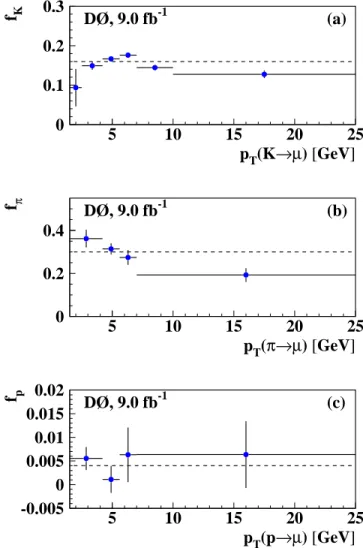
The values of fK, fπ and fp in different muon pT bins
are shown in Fig. 5 and in Table III. The changes in the muon candidates selection adopted here is the main source of differences relative to the corresponding values in Ref. [11]. The fractions fπand fpare poorly measured
in bins 1 and 2, and bins 5 and 6 due to the small num-ber of events, and their contents are therefore combined through their weighted average.
800
1000
1200
1400
x 10
40.8
0.9
1
1.1
1.2
1.3
M(K
+π
-)
[
GeV
]
Entries
(a)
DØ, 9.0 fb
-1χ
2/dof = 70/46
-10000
-5000
0
5000
10000
x 10
0.8
0.9
1
1.1
1.2
1.3
M(K
+π
-)
[
GeV
]
(data-fit)
(b)
DØ, 9.0 fb
-1FIG. 4: (color online). (a) The K+π− invariant mass
dis-tribution for K∗0 candidates in the inclusive muon sample
for all kaons with 4.2 < pT(K+) < 5.6 GeV. The solid line
corresponds to the result of the fit to the K∗0 content, and
the dashed line shows the contribution from combinatorial background. The shaded histogram is the contribution from
ρ0 → π+π− events. (b) Difference between data and the
re-sult of the fit.
TABLE III: Fractions fK, fπ, and fp for different pT bins.
The bottom row shows the weighted average of these quan-tities obtained with weights given by the fraction of muons
in a given pT interval, fµi, in the inclusive muon sample, see
Table I. Only statistical uncertainties are given.
Bin fK× 102 fπ× 102 fp× 102 1 9.35 ± 4.77 36.20 ± 4.12 0.55 ± 0.24 2 14.91 ± 1.00 3 16.65 ± 0.41 31.42 ± 2.57 0.11 ± 0.29 4 17.60 ± 0.49 27.41 ± 3.46 0.63 ± 0.58 5 14.43 ± 0.45 19.25 ± 3.19 0.64 ± 0.71 6 12.75 ± 0.97 All 15.96 ± 0.24 30.01 ± 1.60 0.38 ± 0.17 V. MEASUREMENT OF FK,Fπ,Fp
The quantity FK is expressed as
FK = RKfK, (16)
where RKis the ratio of the fractions of muons produced
by kaons in like-sign dimuon and in inclusive muon data.
0
0.1
0.2
0.3
5
10
15
20
25
p
T(K
→µ
)
[
GeV
]
f
K(a)
DØ, 9.0 fb
-10
0.2
0.4
5
10
15
20
25
p
T(
π→µ
)
[
GeV
]
f
πDØ, 9.0 fb
-1(b)
-0.005
0
0.005
0.01
0.015
0.02
5
10
15
20
25
p
T(p
→µ
)
[
GeV
]
f
p(c)
DØ, 9.0 fb
-1FIG. 5: (color online). The fraction of (a) K → µ tracks, (b) π → µ tracks and (c) p → µ tracks in the inclusive muon
sam-ple as a function of the kaon, pion and proton pT, respectively.
The horizontal dashed lines show the mean values.
For the pT interval i, RK is defined as
RK,i= 2 Ni(K → µ) ni(K → µ) ni(µ) Ni(µ) , (17)
where Ni(K→ µ) and ni(K → µ) are the number of
re-constructed K mesons identified as muons in the like-sign dimuon and in the inclusive muon samples, respectively. The transverse momentum of the K meson is required to be in the pT interval i. The quantities Ni(µ) and ni(µ)
are the number of muons in the pT interval i. A
mul-tiplicative factor of two is included in Eq. (17) because there are two muons in a like-sign dimuon event, and FK
is normalized to the number of like-sign dimuon events. In the previous analysis [11], the quantity FK was
ob-tained from a measurement of the K∗0 production rate.
Presenting it in the form of Eq. (16) also allows the de-termination of FK through an independent measurement
of the fraction of K0
S mesons in dimuon and in inclusive
muon data where one of the pions from K0
S → π+π −
decay is identified as a muon. This measurement is dis-cussed below. In addition, Eq. (16) offers an explicit sep-aration of systematic uncertainties associated with FK.
The systematic uncertainty on the fraction fK affects
the two determinations of Ab
sl based on Eqs. (7) and (8)
in a fully correlated way; therefore, its impact on the measurement obtained using Eq. (13) is significantly re-duced. The systematic uncertainty on the ratio RK does
not cancel in Eq. (13). It is estimated directly from a comparison of the values of RK obtained in two
indepen-dent channels.
One way to measure RKis from the fraction of K∗0→
K+π−events in the inclusive muon and like-sign dimuon
data, RK,i(K∗0) = 2 Ni(K∗0→ µ) ni(K∗0→ µ) ni(µ) Ni(µ) , (18)
where Ni(K∗0 → µ) and ni(K∗0 → µ) are the number
of reconstructed K∗0
→ K+π− decays, with the kaon
identified as a muon in the like-sign dimuon and in the inclusive muon samples, respectively. The transverse mo-mentum of the K meson is required to be in the pT
in-terval i. The measurement using Eq. (18) is based on the assumption Ni(K∗0→ µ) ni(K∗0→ µ) = Ni(K → µ) ni(K → µ) , (19)
which was validated through simulations in Ref. [11]. The corresponding systematic uncertainty is discussed below. In Ref. [11], the fractions FK∗0and fK∗0were obtained independently from a fit of the K+π− invariant mass
distribution in the like-sign dimuon and inclusive muon sample, respectively. Figure 6 shows the same mass stud-ies as in Fig. 4, but for the like-sign dimuon sample. The fit in both cases is complicated by the contribution from light meson resonances that decay to π+π−, producing
a reflection in the K+π− invariant mass distribution. In
addition, the detector resolution is not known a priori and has to be included in the fit. All these complica-tions are reduced significantly or eliminated in the “null-fit” method introduced in Ref. [11], which is used in this analysis to measure the ratio RK(K∗0).
In this method, for each pT interval i, we define a set of
distributions Pi(MKπ; ξ) that depend on a parameter ξ:
Pi(MKπ; ξ) = Ni(MKπ)− ξ
Ni(µ)
2ni(µ)
ni(MKπ), (20)
where Ni(MKπ) and ni(MKπ) are the number of
en-tries in the pT bin i of the K+π− invariant mass
dis-tributions in the like-sign dimuon and inclusive muon samples, respectively. For each value of ξ the number of K∗0 → K+π− decays,
N (K∗0), and its uncertainty,
∆N (K∗0), are measured from the P
i(MKπ; ξ)
distribu-tion. The value of ξ for which N (K∗0) = 0 defines
35000
40000
45000
50000
55000
60000
0.8
0.9
1
1.1
1.2
1.3
M(K
+π
-)
[
GeV
]
Entries
(a)
DØ, 9.0 fb
-1χ
2/dof = 62/50
-500
0
500
1000
0.8
0.9
1
1.1
1.2
1.3
M(K
+π
-)
[
GeV
]
(data-fit)
(b)
DØ, 9.0 fb
-1FIG. 6: (color online). (a) The K+π− invariant mass
dis-tribution of K∗0 candidates in the like-sign dimuon sample
for all kaons with 4.2 < pT(K+) < 5.6 GeV. The solid line
corresponds to the result of the fit to the K∗0 content, and
the dashed line shows the contribution from combinatorial background. The shaded histogram is the contribution from
ρ0→ π+π−events. (b) Difference between data and the
re-sult of the fit.
RK,i(K∗0). The uncertainty σ(RK,i) is determined from
the condition thatN (K∗0) =±∆N (K∗0) corresponding
to ξ = RK,i(K∗0)± σ(RK,i).
The advantage of this method is that the influence of the detector resolution becomes minimal forN (K∗0)
close to zero, and the contribution from the peaking back-ground is reduced in Pi(MKπ; ξ) to the same extent as the
contribution of K∗0mesons, and becomes negligible when
N (K∗0) is close to zero. As an example, Fig. 7 shows the
mass distribution Pi(MKπ; ξ) for ξ = 0.88, for all kaons
with 4.2 < pT(K+) < 5.6 GeV. This distribution is
ob-tained from the distributions shown in Figs. 4 and 6, using Eq. (20). The contributions of both K∗0→ K+π−
and ρ0
→ π+π−, as well as any other resonance in the
background, disappear. As a result, the fitting procedure becomes more robust, the fitting range can be extended, and the resulting value of RK(K∗0) becomes stable under
a variation of the fitting parameters over a wider range. The value of RK is also obtained from the production
rate of K0
S mesons in the inclusive muon and dimuon
samples. We compute RK,ifor a given pT interval i, as
RK,i(KS0) = Ni(KS0→ µ) ni(KS0 → µ) ni(µ) Ni(µ) κi, (21)
num-20000
25000
30000
35000
0.8
1
1.2
1.4
1.6
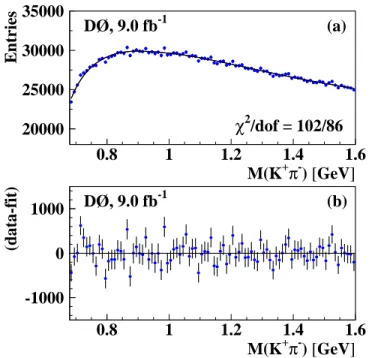
M(K
+π
-)
[
GeV
]
Entries
(a)
DØ, 9.0 fb
-1χ
2/dof = 102/86
-1000
0
1000
0.8
1
1.2
1.4
1.6
M(K
+π
-)
[
GeV
]
(data-fit)
(b)
DØ, 9.0 fb
-1FIG. 7: (color online). (a) The K+π−invariant mass
distri-bution P2(MKπ; ξ) obtained using Eq. (20) for ξ = 0.88 for
all kaons with 4.2 < pT(K+) < 5.6 GeV. The dashed line
shows the contribution from the combinatorial background. (b) Difference between data and the result of the fit.
ber of reconstructed K0
S → π+π− decays with one pion
identified as a muon in the dimuon and the inclusive muon data, respectively. The correction factor κi is
dis-cussed later in this section. The measurement of RK,i
using Eq. (21) assumes isospin invariance and consequent equality of the ratio of production rates in the dimuon and in the inclusive muon samples of K+and K0
Smesons, i.e., Ni(KS0 → µ) ni(KS0→ µ) =Ni(K → µ) ni(K → µ) . (22)
Since the charged kaon pT in Eq. (22) is required to be
within the pT interval i, the transverse momentum of the
K0
Smeson in Eq. (21) is also required to be within the pT
interval i. We expect approximately the same number of positive and negative pions from K0
S → π+π− decays to
be identified as a muon. Therefore, we use both like-sign and opposite-sign dimuon events to measure Ni(KS0 → µ)
and we do not use the multiplicative factor of two in Eq. (21). The requirement of having one pion identified as a muon makes the flavor composition in the samples of charged K→ µ events and K0
S → µ events similar.
The charges of the kaon and the additional muon in a dimuon event can be correlated, i.e., in general N (K+µ+)
6= N(K−µ+). However, the number of
Ni(KS0 → µ) events is not correlated with the charge of
the additional muon, i.e., N (K0
S → µ+, µ+) = N (KS0 →
TABLE IV: Values of κ in different pTbins. The bottom row
shows their average. Only statistical uncertainties are given.
bin κ 1 1.005 ± 0.024 2 1.025 ± 0.016 3 1.038 ± 0.016 4 1.036 ± 0.016 5 1.051 ± 0.016 6 1.080 ± 0.013 Mean 1.046 ± 0.007
0.8
0.9
1
1.1
1.2
5
10
15
20
25
p
T(K)
[
GeV
]
κ
DØ, 9.0 fb
-1FIG. 8: (color online). The correction coefficient κ as a
function of the kaon transverse momentum. The horizontal dashed line shows the mean value.
µ−, µ+). Since the ratio R
K,iis determined for the
sam-ple of like-sign dimuon events, we apply in Eq. (21) the correction factor κi, defined as
κi≡
2(N (K+µ+) + c.c.)
(N (K+µ+) + N (K−µ+) + c.c.), (23)
to take into account the correlation between the charges of the kaon and muon. The abbreviation “c.c.” in Eq. (23) denotes “charge conjugate states”. The coef-ficients κi are measured in data using the events with
a reconstructed K∗0 → K+π− decay and an additional
muon. To reproduce the selection for the dimuon sample [11], the invariant mass of the Kµ system, with the kaon assigned the mass of a muon, is required to be greater than 2.8 GeV. The fitting procedure and selection crite-ria to measure the number of K∗0 events are described
in Ref. [11]. The values of κi for different pT intervals
are given in Fig. 8 and in Table IV.
The average muon detection efficiency is different for the inclusive muon and like-sign dimuon samples be-cause of different pT thresholds used in their triggers.
The difference in muon detection efficiency is large for muons with small pT, but it is insignificant for muons
above the inclusive-muon trigger threshold. The ratio Ni(KS0 → µ)/ni(KS0 → µ) in Eq. (21) is measured as
a function of the transverse momenta of K0
S mesons,
pT(KS0), while the ratio ni(µ)/Ni(µ) is measured in bins
of muon pT. Each pT(KS0) bin contains π→ µ with
0
0.5
1
1.5
5
10
15
20
25
p
T(
µ
)
[
GeV
]
Eff(
µ
)
1µ/ Eff(
µ
)
2µDØ, 9.0 fb
-1FIG. 9: (color online). The ratio of π → µ detection efficien-cies for the inclusive muon and dimuon data as a function of the muon transverse momentum. The horizontal dashed line
shows the mean value for pT(K) > 4.2 GeV.
therefore does not cancel in Eq. (21), and can affect the measurement of RK(KS0). Figure 9 shows the ratio of
π → µ detection efficiencies in the inclusive muon and dimuon data. To compute this ratio, we select the K0 S
mesons in a given pT(KS0) interval. The pT(π)
distribu-tion of pions produced in the K0
S → π+π− decay with
a given pT(KS0) is the same in the dimuon and inclusive
muon data. Therefore, any difference in this pT(π→ µ)
distribution between dimuon and inclusive muon data is due to the π → µ detection. We compute the ratio of these pT(π → µ) distributions, and normalize it such
that it equals unity for pT(π→ µ) > 5.6 GeV. The value
of this pT threshold corresponds to the pT threshold for
single muon triggers. Figure 9 presents the average of the ratios for different pT(µ) intervals. The ratio is
sup-pressed for pT(π → µ) < 4.2 GeV, and is consistent with
a constant for pT(π → µ) > 4.2 GeV. To remove the
bias due to the trigger threshold, we measure RK(KS0)
for events with pT(π → µ) > 4.2 GeV. As a result, the
ratio RK is not defined for the first two pT bins in the
K0
S channel.
The values of RK(K∗0) obtained through the
null-fit method, for different muon pT bins, are shown in
Fig. 10(a) and in Table V. The values of RK(KS0) are
contained in Fig. 10(b) and in Table V. The difference between the values of RK measured with K∗0mesons and
with K0
S mesons is shown in Fig. 11. The mean value of
this difference is
∆RK = 0.01± 0.05, (24)
and the χ2/d.o.f. is 1.7/4. We use two independent
methods, each relying on different assumptions, to mea-sure the ratio RK and obtain results that are consistent
with each other. The methods are subject to different systematic uncertainties, and therefore provide an im-portant cross-check. As an independent cross-check, the value of RK obtained in simulation is consistent with
that measured in data, see Sec. XIII for details. We take the average of the two channels weighted by their uncer-tainties as our final values of RK for pT(K) > 4.2 GeV
TABLE V: Values of RK obtained using K∗0 and KS0 meson
production in different pT bins. The bottom row shows their
average. Only statistical uncertainties are given. The ratio
RK in the KS0 channel is not measured in the first two bins,
see Sec. V.
bin RK from K∗0 RK from KS0 average RK
1 0.983 ± 0.154 0.983 ± 0.154 2 0.931 ± 0.058 0.931 ± 0.058 3 0.880 ± 0.052 0.844 ± 0.059 0.864 ± 0.039 4 0.856 ± 0.082 0.800 ± 0.040 0.811 ± 0.036 5 0.702 ± 0.112 0.828 ± 0.042 0.813 ± 0.039 6 1.160 ± 0.165 1.138 ± 0.117 1.146 ± 0.095 Mean 0.892 ± 0.032 0.834 ± 0.025 0.856 ± 0.020
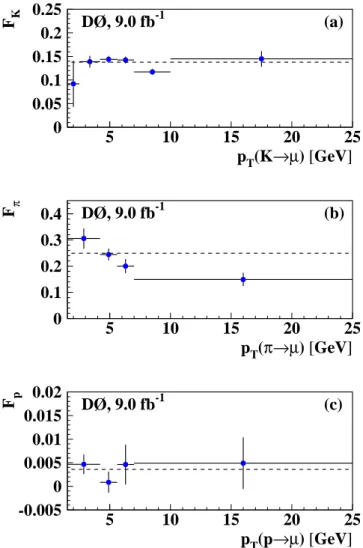
TABLE VI: Values of FK, Fπ, and Fpfor different pT bins.
The last line shows the weighted average of these quantities obtained with weights given by the fraction of muons in a
given pT interval Fµi in the dimuon sample, see Table I. Only
statistical uncertainties are given.
Bin FK× 102 Fπ× 102 Fp× 102 1 9.19 ± 4.90 30.54 ± 3.89 0.47 ± 0.21 2 13.88 ± 1.26 3 14.38 ± 0.74 24.43 ± 2.28 0.09 ± 0.22 4 14.26 ± 0.74 19.99 ± 2.67 0.46 ± 0.42 5 11.73 ± 0.67 14.90 ± 2.55 0.49 ± 0.55 6 14.48 ± 1.64 All 13.78 ± 0.38 24.81 ± 1.34 0.35 ± 0.14
and use the values measured in the K∗0 channel for
pT(K) < 4.2 GeV. These values are given in Table V
and in Fig. 10(c). As we do not observe any difference between the two measurements, we take half of the un-certainty of ∆RK as the systematic uncertainty of RK.
This corresponds to a relative uncertainty of 3.0% on the value of RK. In our previous measurement [11], this
un-certainty was 3.6%, and was based on simulation of the events.
Using the extracted values of RK, we derive the
val-ues of FK, Fπ and Fp. The computation of FK is done
using Eq. (16), and we follow the procedure described in Ref. [11] to determine Fπand Fp. The results are shown
in Fig. 12 and in Table VI. The fractions Fπ and Fp are
poorly determined for the lowest and highest pT because
of the small number of events. The content of bins 1 and 2, and bins 5 and 6 are therefore combined.
VI. SYSTEMATIC UNCERTAINTIES FOR
BACKGROUND FRACTIONS
The systematic uncertainties for the background frac-tions are discussed in Ref. [11], and we only summarize the values used in this analysis. The systematic uncer-tainty on the fraction fKis set to 9% [11]. The systematic
uncertainty on the ratio RK, as indicated in Sec. V, is
0
0.5
1
1.5
5
10
15
20
25
p
T(K)
[
GeV
]
R
K(K
*0)
DØ, 9.0 fb
-1(a)
0
0.5
1
1.5
5
10
15
20
25
p
T(K)
[
GeV
]
R
K(K
S)
(b)
DØ, 9.0 fb
-10
0.5
1
1.5
5
10
15
20
25
p
T(K)
[
GeV
]
R
Kcombined
(c)
DØ, 9.0 fb
-1FIG. 10: (color online). The ratio RKobtained using (a) K∗0
production, (b) K0
Sproduction, and (c) combination of these
two channels as a function of the kaon transverse momentum. The horizontal dashed lines show the mean values.
-0.2
0
0.2
5
10
15
20
25
p
T(K)
[
GeV
]
R
K(K
*0) - R
K(K
S)
DØ, 9.0 fb
-1FIG. 11: (color online). The difference RK(K∗0) − RK(KS0)
as a function of kaon transverse momentum. The horizontal dashed line shows the mean value.
0
0.05
0.1
0.15
0.2
0.25
5
10
15
20
25
p
T(K
→µ
)
[
GeV
]
F
KDØ, 9.0 fb
-1(a)
0
0.1
0.2
0.3
0.4
5
10
15
20
25
p
T(
π→µ
)
[
GeV
]
F
πDØ, 9.0 fb
-1(b)
-0.005
0
0.005
0.01
0.015
0.02
5
10
15
20
25
p
T(p
→µ
)
[
GeV
]
F
pDØ, 9.0 fb
-1(c)
FIG. 12: (color online). The values of (a) FK, (b) Fπand (c)
Fp in the like-sign dimuon sample as a function of the kaon,
pion and proton pT, respectively. The horizontal dashed lines
show the mean values.
The systematic uncertainties on the ratios of multiplici-ties nπ/nK and np/nK in p¯p interactions are set to 4%
[17]. These multiplicities are required to compute the quantities fπ, fp. The ratios Nπ/NK and Np/NK,
re-quired to compute the quantities Fπ and Fp [11] are
as-signed an additional 4% systematic uncertainty. The val-ues of these uncertainties are discussed in Ref. [11].
VII. MEASUREMENT OF fS, FSS
We determine the fraction fS of S muons in the
in-clusive muon sample and the fraction FSS of events with
two S muons in the like-sign dimuon sample following the procedure described in Ref. [11]. We use the
follow-TABLE VII: Asymmetries aK, aπ, and ap for different pT
bins. The bottom row shows the mean asymmetries averaged over the inclusive muon sample. Only the statistical uncer-tainties are given.
Bin aK× 102 aπ× 102 ap× 102 1 +3.26 ± 1.67 −0.14 ± 0.15 −6.2 ± 6.9 2 +4.18 ± 0.20 3 +5.00 ± 0.13 −0.08 ± 0.12 +4.9 ± 5.6 4 +5.18 ± 0.22 +0.25 ± 0.23 −1.2 ± 12.8 5 +5.44 ± 0.34 +0.63 ± 0.40 −6.8 ± 9.6 6 +4.52 ± 0.57 All +4.88 ± 0.09 −0.03 ± 0.08 −0.8 ± 3.8
ing value from simulation FLL FSL+ FLL = 0.264± 0.024, (25) and obtain fS = 0.536± 0.017 (stat) ± 0.043 (syst), Fbkg = 0.389± 0.019 (stat) ± 0.038 (syst), FLL = 0.082± 0.005 (stat) ± 0.010 (syst), FSL = Fbkg− 2FLL, FSS = 0.692± 0.015 (stat) ± 0.030 (syst). (26)
The difference between these values and that in Ref. [11] are due to the increased statistics and the changes in the muon selection and in the analysis procedure.
VIII. MEASUREMENT OFaK,aπ, ap,δ
We measure all detector related asymmetries using the methods presented in Ref. [11]. Muons from decays of charged kaons and pions and from incomplete absorp-tion of hadrons that penetrate the calorimeter and reach the muon detectors (“punch-through”), as well as false matches of central tracks to segments reconstructed in the outer muon detector, are considered as detector back-grounds. We use data to measure the fraction of each source of background in both the dimuon and inclusive muon samples, and the corresponding asymmetries. Data are also used to determine the intrinsic charge-detection asymmetry of the D0 detector. Since the interaction length of the K+ meson is greater than that of the K−
meson [14], kaons provide a positive contribution to the asymmetries A and a. The asymmetries for other back-ground sources (pions, protons and falsely reconstructed tracks) are at least a factor of ten smaller.
The results for the asymmetries aK, aπ, and apin
dif-ferent muon pT bins are shown in Fig. 13 and Table VII.
The asymmetries aπ and ap are poorly measured in the
first and last bins due to the small number of events. The content of bins 1 and 2, and bins 5 and 6 are therefore combined.
0
0.02
0.04
0.06
0.08
5
10
15
20
25
p
T(K
→µ
)
[
GeV
]
a
KDØ, 9.0 fb
-1(a)
0
0.005
0.01
5
10
15
20
25
p
T(
π→µ
)
[
GeV
]
a
πDØ, 9.0 fb
-1(b)
-0.2
-0.1
0
0.1
0.2
5
10
15
20
25
p
T(p
→µ
)
[
GeV
]
a
pDØ, 9.0 fb
-1(c)
FIG. 13: (color online). The asymmetries (a) aK, (b) aπ,
and (c) ap as a function of the kaon, pion and proton pT,
respectively.
The small residual reconstruction asymmetry δiis
mea-sured using a sample of J/ψ → µ+µ− decays
recon-structed from two central detector tracks, with at least one matching a track segment in the muon detector. The values of δi obtained as a function of muon pT are given
in Table VIII and are shown in Fig. 14. The weighted averages for the residual muon asymmetry in the inclu-sive muon and the like-sign dimuon samples, calculated using weights given by the fraction of muons in each pT
interval fi
µ (Fµi) in the inclusive muon (dimuon) sample,
are given by
δ≡ P6i=1fi
µδi= (−0.088 ± 0.023)%, (27)
∆≡ P6i=1Fi
µδi= (−0.132 ± 0.019)%, (28)
where only the statistical uncertainties are given. The correlations among different δi are taken into account in
TABLE VIII: Muon reconstruction asymmetry δifor different
muon pT bins. Only the statistical uncertainties are given.
Bin δi× 102 1 −0.509 ± 0.106 2 −0.205 ± 0.040 3 −0.053 ± 0.048 4 −0.124 ± 0.075 5 +0.050 ± 0.099 6 +0.034 ± 0.189
-0.005
0
0.005
5
10
15
20
25
p
T(
µ
)
[
GeV
]
asymmetry,
δ
DØ, 9.0 fb
-1FIG. 14: (color online). Muon reconstruction asymmetry as
a function of muon pT.
IX. CORRECTIONS FOR BACKGROUND
ASYMMETRIES
The corrections for the background and detector con-tributions to the measured raw asymmetries a and A are obtained combining the results from Tables I, III, VI, and VII, and summarized in Tables IX and X. The values in the bottom row of these tables are computed by averag-ing the correspondaverag-ing quantities with weights given by the fraction of muons in each pT interval fµi (Fµi) in the
inclusive muon (dimuon) sample, see Eqs. (7) and (8). We use the mean values for fπ, Fπ, fp, Fp, aπ, and ap
in bins 1 and 2, and in bins 5 and 6, as the number of events for those bins are not sufficient to perform sepa-rate measurements.
X. COEFFICIENTS cbANDCb
The dilution coefficients cb and Cb in Eq. (12) are
ob-tained through simulations using the method described in Ref. [11]. Both coefficients depend on the value of the mean mixing probability, χ0. We use the value obtained
at LEP as averaged by HFAG [3] for this measurement χ0(HFAG) = 0.1259± 0.0042. (29)
To measure the weights for the different processes pro-ducing S muons, we correct the momentum distribution of generated b hadrons to match that in the data used in
TABLE IX: Corrections due to background asymmetries
fKaK, fπaπ, and fpapfor different pT bins. The bottom row
shows the weighted averages obtained using weights given by
the fraction of muons in a given pT interval, fµi, in the
inclu-sive muon sample. Only statistical uncertainties are given.
Bin fKaK× 102 fπaπ× 102 fpap× 102 1 +0.305 ± 0.220 −0.052 ± 0.054 −0.034 ± 0.041 2 +0.624 ± 0.052 3 +0.832 ± 0.030 −0.025 ± 0.037 +0.005 ± 0.016 4 +0.912 ± 0.046 +0.068 ± 0.065 −0.008 ± 0.081 5 +0.785 ± 0.054 +0.121 ± 0.079 −0.043 ± 0.077 6 +0.577 ± 0.086 All +0.776 ± 0.021 +0.007 ± 0.027 −0.014 ± 0.022
TABLE X: Corrections due to background asymmetries
FKaK, Fπaπand Fpapfor different pTbins. The bottom row
shows the weighted averages obtained using weights given by
the fraction of muons in a given pT interval, Fµi, in the
like-sign dimuon sample. Only statistical uncertainties are given.
Bin FKaK× 102 Fπaπ× 102 Fpap× 102 1 +0.300 ± 0.222 −0.044 ± 0.046 −0.029 ± 0.035 2 +0.581 ± 0.060 3 +0.719 ± 0.042 −0.020 ± 0.029 +0.004 ± 0.012 4 +0.739 ± 0.050 +0.050 ± 0.047 −0.005 ± 0.059 5 +0.638 ± 0.054 +0.094 ± 0.062 −0.033 ± 0.060 6 +0.655 ± 0.112 All +0.633 ± 0.031 −0.002 ± 0.023 −0.016 ± 0.019
this analysis. The determined weights [17] are given in Table XI.
The uncertainty on the weights for the different pro-cesses contains contributions from the uncertainty in the momentum of the generated b hadrons and from the un-certainties in b-hadron branching fractions. The differ-ence in the weights with and without the momentum correction contributes to the assigned uncertainties. Ad-ditional contributions to the uncertainties on the weights derive from the uncertainties on the inclusive branching
TABLE XI: Heavy-quark decays contributing to the inclusive muon and like-sign dimuon samples [17]. The abbreviation “non-osc” stands for “non-oscillating,” and “osc” for “oscil-lating.” All weights are computed using MC simulation.
Process Weight T1 b → µ−X w1 ≡ 1. T1a b → µ−X (non-osc) w1a = (1 − χ0)w1 T1b ¯b → b → µ−X (osc) w1b= χ0w1 T2 b → c → µ+X w2 = 0.096 ± 0.012 T2a b → c → µ+X (non-osc) w2a = (1 − χ0)w2 T2b ¯b → b → c → µ+X (osc) w2b= χ0w2 T3 b → c¯cq with c → µ+X or ¯c → µ−X w3 = 0.064 ± 0.006 T4 η, ω, ρ0, φ(1020), J/ψ, ψ′→ µ+µ− w4 = 0.021 ± 0.002 T5 b¯bc¯c with c → µ+X or ¯c → µ−X w5 = 0.013 ± 0.002 T6 c¯c with c → µ+X or ¯c → µ−X w6 = 0.675 ± 0.101