3D Imaging Methods for
Manufacturing, with Emphasis
on the Laser Speckle Technique
by
Joseph H. Karlin
S.B., Massachusetts Institute of Technology
(1994)Submitted to the Department of Mechanical Engineering in Partial Fulfillment of the Requirements for the
Degree of
MASTER OF SCIENCE
in Mechanical Engineeringat the
Massachusetts Institute of Technology
June 1995© 1995 Massachusetts Institute of Technology All rights reserved
1i
4 2Signature of Author
.,,,01 ey I,.-it /\
Department of Mechanical Engineering May 12, 1995
David E. Hardt Professor of Mechanical Engineering Thesis Supervisor
0 Tma r RbvlAJ~
Certified by
MIT Lincoln Laboratory Research Staff Thesis Supervisor Accepted by
MASSACHUSETTS INSTITUTE
Ain A.
Sonin
OF TECHNOLOG'Chairman, Department Graduate Committee
AUG
31 1995
LIBRARIES 0ker Enpi ,?/
n
v~~~r wr u3D Imaging Methods for Manufacturing, with Emphasis
on the Laser Speckle Technique
by
Joseph H. Karlin
Submitted to the Department of Mechanical Engineering on May 12, 1995 in
partial fulfillment of the requirements for the Degree of Master of Science in
Mechanical Engineering
Abstract
The purpose of this thesis is to analyze the current state of the
three-dimensional imaging industry, exploring in depth the particular technique of
laser speckle wavelength decorrelation. Also studied are the effects of different
surface finishes, ambient conditions, and data filtering techniques on the
accuracy of the laser speckle technique.
A six inch square stamped sheet metal part is used to compare the laser
speckle technique to the CMM, an industry standard. The accuracy of the
laser speckle device is determined by creating an error map between the
sampled speckle data and a mathematical model of the part surface generated
from the CMM measurement. The same part is used for eight laser speckle
measurements, and the results are compared to determine the effects of each
condition on accuracy. In addition, a New Focus tunable external cavity diode
laser is examined as a possible replacement for the Titanium Sapphire ring
laser currently used in the speckle system.
The results show that the laser speckle wavelength decorrelation
technique is accurate in range to 1082 gim (0.0426 in) when measuring a
sample sheet metal part of 19 mm (0.75 in) range extent. The theoretical
range resolution of the technique is only limited by the tuning range of the laser
and the computing power available for data processing. The range resolution is
better than 1 gm (0.00004 in) when measuring objects of range extent on the
order of 1 mm (0.04 in). In addition, accuracy is degraded by the presence of air
turbulence and too much light reflected back to the CCD array. However,
proper image processing can extract the image even under non-ideal ambient
conditions and surface finishes.
In the short term, the laser speckle technique is not practical for quick
and accurate three-dimensional imaging use. Currently, the best technique for
quick and accurate surface mapping of sheet metal parts is a triangulation
based laser scanning technique currently available from several companies.
However, with a few more years of research and development, the laser
speckle wavelength decorrelation technique could easily offer the best
combination of speed and accuracy in the metrology industry.
Thesis Supervisor: David E. Hardt
Dedication
This thesis is dedicated to my grandmother, Sooky Karlin, who is not with us now, but if she was, I know she would be very proud of this work and my other accomplishments in the past nine years.
Acknowledgments
First, I would like to thank my parents and my sister for providing continual love and support to me throughout my life.
Next, I would like to thank Professor David E. Hardt for supervising my research. He helped me a great deal to keep focused in my research and provided an expert point of view when I was trying to decide where to go with this project.
I would like to give special thanks to the MIT Lincoln Laboratory Advanced Concepts Committee, who supported my research.
Also, I would like to thank the members of the Laser Speckle Laboratory of Group 35 of the MIT Lincoln Laboratory. Dr. Lyle Shirley supervised my work at Lincoln and provided much needed guidance and support for my work with Laser Speckle. John Vivilecchia taught me the basics of performing a laser speckle measurement. Emory Ariel was helpful when I was designing a mount for the sheet metal part, and he was a great help with the alignment of the Ti:S laser through the optics. Harold Payson and Michael Mermelstein were a great help in answering various questions about the systems in the Speckle Lab. Bob Hall of the Lincoln Laboratory Library, a master of keywords for journal articles, assisted me during several literature searches. And a special thanks goes to Greg Hallerman, who put up with endless hours of helping me run my Laser Speckle experiments and having discussions about everything from data processing to life in general.
In addition, I would like to thank the crew at the Laboratory for Manufacturing and Productivity. Dan Walczyk was a great help getting me started with my research at MIT and making me feel at home in the Lab in the basement of Building 35. Dan was also very helpful in teaching me how to stamp the sheet metal part which I used for my experiments. Jerry Wentworth was extremely helpful in teaching me how to use the Brown & Sharpe CMM at MIT and putting me in touch with the right people to get the right CMM software.
Finally, I would like to thank Leslie Regan, Joan Kravit, and Susan Melillo of the Graduate Mechanical Engineering Office for helping me with all the paperwork necessary to survive in Graduate School at MIT.
About the Author
Joseph Howard Karlin was born in Philadelphia, Pennsylvania on April 27,
1972. He became involved in research at an early age, entering research
projects in the local, state, and national levels of several middle and high school science competition organizations. Joe was recognized for his high school biochemistry research by the Westinghouse Science Talent Search, which named him as a Finalist in 1990.
Joe spent his undergraduate years at MIT, where he graduated with a S.B. Degree in Mechanical Engineering in February, 1994. Then he began work on his S.M. Degree in Mechanical Engineering, also at MIT, and he graduated in June 1995 upon completion of this work. He is scheduled to begin work in Automobile Product Design at the Ford Motor Company in June 1995.
Tne ;a a of t• ^ frther h
Beta Chapter of Theta Chi Fraternity, and he was elected to membership in Tau Beta Pi, the Engineering Honor Society, and Pi Tau Sigma, the Mechanical Engineering Honor
Society. Also, he is a member of the American Society of Mechanical Engineers.
Joe spends his spare time playing the piano and composing music, but none of his songs have yet been recorded. He is also an avid reader of fiction, and he enjoys
biking and jogging around the
Charles River in Boston.Table of Contents
1 Introduction
13
1.1 M otivation ... ... 13
1.2 O bjectives ... ... 15
1.3 O utline of Thesis...16
2 Mechanical Contact: Coordinate Measuring Machine 18 2.1 Early M anual CM M s... ... 18
2.2 Continuous Contact Coordinate Measuring Machine ... 20
2.3 Touch Trigger Probe Coordinate Measuring Machine ... 23
2.4 Disadvantages of a CM M ... ... 26
2.5 Brown & Sharpe MicroVal PFx CMM ... ... 27
2.6 Sum m ary...30
3 Survey of Three-Dimensional Imaging Techniques 32 3.1 Passive Triangulation ... 34
3.1.1 Stereo D isparity... ... 35
3.2 Active Triangulation... ... 37
3.2.1 Point Laser Triangulation... ... 37
3.2.2 Scanning Point Laser Triangulation... .. ... 41
3.2.3 Structured Light: Line, Grid...45
3.2.4 Moire Interferometry... ... ... 47
3.3 Passive Non-Triangulation ... 51
3.3.1 Range from Focus... .51
3.3.2 Other Passive Non-Triangulation Techniques... 54
3.4 Active Non-Triangulation...54
3.4.1 Fresnel Diffraction... 54
3.4.2 Pulse Lasar Radar... .. ... 58
3.4.3 Amplitude Modulation Continuous Wavelength (AM CW)...59
3.4.4 Frequency Modulation Continuous Wavelength (FM CW) ... 61
3.4.5 Holographic Interferometry ... ... 63
4 How Laser Speckle Works 68
4.1 What is Laser Speckle? ... . ... . . .. .. . . .... . . 68
4.2 Finding Range Data from Laser Speckle ... .... 68
4.3 System D esign ... ... 72
4.3.1 Laser Speckle System Design ... ... 72
4.3.2 Using the New Focus Laser ... ... 75
4.4 Im age Processing ... ... 76
4.4.1 Perform a Three-Dimensional Fourier Transform ... 76
4.4.2 Extract Target Image from a Three-Dimensional Array...78
4.4.3 D ata Filtering ... ... 79
5 Experimental Design 81 5.1 The Sheet M etal Part ... 81
5.2 Design of a Repeatable Mounting Fixture... ... 82
5.3 CM M M easurem ents ... ... 83
5.4 Laser Speckle Measurements ... 84
5.4.1 Power Distribution Across the Collimated Laser Beam...84
5.4.2 Laser Speckle Experimental Trials ... .... 84
5.4.3 Determination of Optimal Reference Mirror... 85
5.5 New Focus Laser Calibration and Characterization... 87
6 Results and Discussion 89 6.1 Presentation of CMM Data... 89
6.2 Power Distribution Across the Collimated Laser Beam...90
6.3 Presentation of Laser Speckle Data Sets... .... 90
6.4 Comparison of CMM Data to Laser Speckle Data... 112
7 Conclusions and Recommendations
124
7.1 Review of Results: CMM vs. Laser Speckle ... 124
7.2 Laser Speckle: W here is it Headed? ... 125
7.3 Metrology Solution for Flexible Sheet Metal Forming ... 126
Bibliography 131
Appendix A: Mounting Fixture and Clamping Piece 135
List of Figures
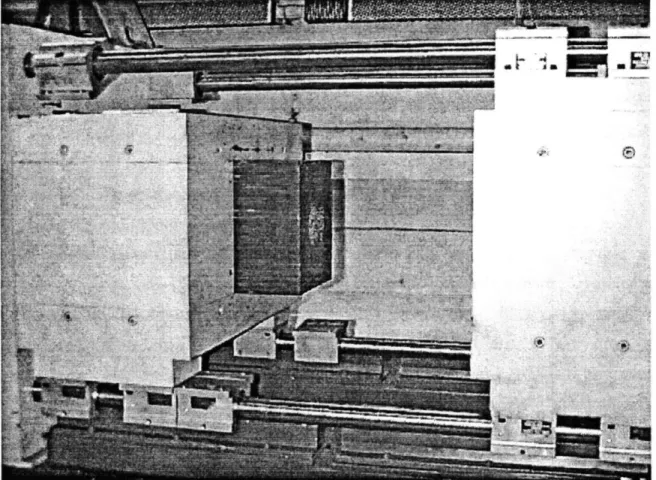
Figure 1.1: Flexible Sheet Metal Forming Press at MIT...14
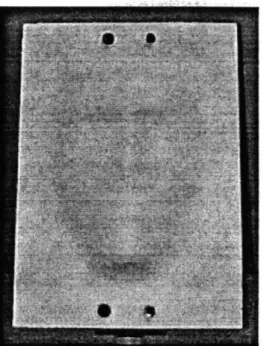
Figure 1.2: Face Impression Made By Flexible Sheet Metal Press ... 15
Figure 2.1: Basic Milling Machine / CMM Design... ... 19
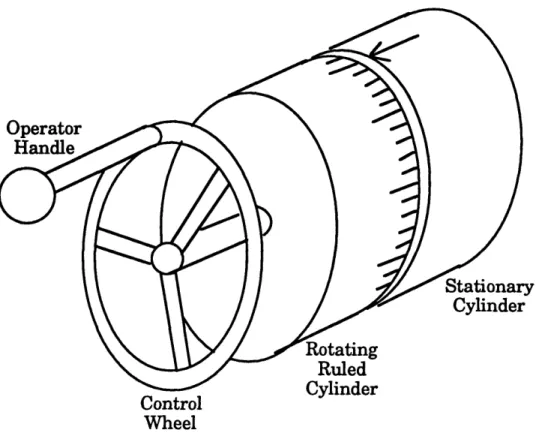
Figure 2.2: Manual CMM Workpiece Table Axis Controller ... 20
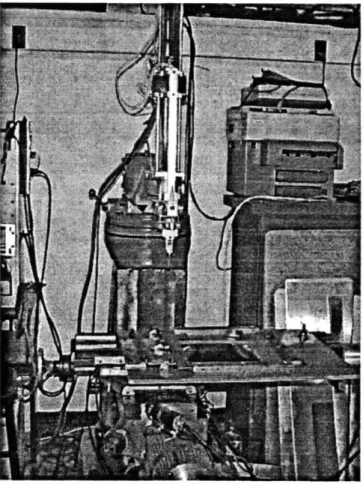
Figure 2.3: MIT Continuous Contact CMM ... 21
Figure 2.4: Renishaw Scanning Probe, Adapted From [4]...23
Figure 2.5: Renishaw Touch Trigger Probe, Adapted From [111 ... 24
Figure 2.6: Brown & Sharpe MicroVal PFx CMM... 28
Figure 3.1: 3D Imaging Terms, Adapted From [171... .... 33
Figure 3.2: Triangulation Range Sensing, Adapted From [18 ... 35
Figure 3.3: Point Triangulation Range Sensor, Adapted From [19 ... 38
Figure 3.4: Camera Centered Point Triangulation...42
Figure 3.5: Autosynchronized Scanning, Adapted From [371 ... 43
Figure 3.6: Line Scanning, Adapted From [40] ... ... 46
Figure 3.7: Moir6 Fringe Pattern ... 47
Figure 3.8: Projection Moir6 Configuration, Adapted From [17 ... 49
Figure 3.9: Thin Lens Relationships, Adapted From [17]... 52
Figure 3.10: Fresnel Diffraction System, Adapted From [55] ... 57
Figure 3.11: AM CW Radar Principles, Adapted From [17]...60
Figure 3.12: FM CW Linear Ramp Principles, Adapted From [17 ... 62
Figure 3.13: Example of a Holographic Setup, Adapted From [681...64
Figure 4.1: Speckle Pattern from Triconic, Adapted From [2] ... 69
Figure 4.2: Step Target Speckle Intensity Variation, Adapted From [2]...70
Figure 4.3: Laser Speckle System Diagram, Adapted From [2] ... 73
Figure 4.4: Laser Speckle System Setup ... ... 73
Figure 4.5: The New Focus External Cavity Tunable Diode Laser... 76
Figure 4.6: Three-Dimensional Laser Speckle Array... 78
Figure 4.7: Extracting an Image... ... 79
Figure 5.1: The Sheet Metal Part Used for This Work...82
Figure 5.3: Mounting Setup for the Sheet Metal Part...83
Figure 5.4: Coated Sheet Metal Part with Reference Mirror ... 86
Figure 5.5: Two Dimensional FFT of Coated Part, R = 0.25 m...87
Figure 5.6: Burleigh Wavemeter... 88
Figure 6.1: CMM Measurement of Sheet Metal Part...89
Figure 6.2: Power Distribution of Ti:sapphire Beam ... 90
Figure 6.3: Diffuse White Paint, 128 Frames ... .... 93
Figure 6.4: Diffuse White Paint, 256 Frames ... .... 95
Figure 6.5: Light Coat of Diffuse White Paint, 128 Frames ... 97
Figure 6.6: No Coating, 128 Frames... 101
Figure 6.7: Coated with Machining Oil, 128 Frames ... 103
Figure 6.8: Half Coated with Diffuse White Paint, 128 Frames ... 106
Figure 6.9: Diffuse White Paint, Oscillating Fan, 128 Frames... 109
Figure 6.10: Diffuse White Paint, Air Circulation On, 128 Frames... 112
Figure 6.11: Comparison: Y-Z Slice Through Part ... 117
Figure 6.12: Comparison: X-Z Slice Through Part ... 121
Introduction
1.1 Motivation
Rapid prototyping can be very useful to product designers of many types of products. Many times, marketing or artistic design people will create a wood or plastic mock-up of a new product. The product designer is handed this conceptual model and told to create something that looks like it. How much easier her job would be if a real time high accuracy three-dimensional imaging system were available. One could scan the object and have a mathematical model of it inside a CAD system in seconds. It would then be a much more simple task to create machining code for the part and to create prototypes or dyes for manufacturing the part.
Quality control is very important in manufacturing systems. Keeping manufactured parts in tolerance is vital to making a successful product. Currently, one can check critical dimensions of a part in real time, or one can take a few minutes to get an accurate three-dimensional map of the part. A real time high accuracy three-dimensional imaging system would make possible much more careful tolerancing of parts in a short period of time, which would be very valuable in a process such as manufacturing of car door panels.
Advanced manufacturing systems would also greatly benefit from a real time high accuracy three-dimensional imaging system. A flexible sheet metal
forming system developed at MIT (Hardt et. al. [1], see Figure 1.1) uses a closed loop system to converge on an accurate part after several iterations of measuring the part, calculating an error map, making a new die, and forming a new part. In this way, an accurate part can be made in a few iterations without fully modeling the springback in the system. A real time high
accuracy three-dimensional imaging system would make a closed loop system of this type very useful in sheet metal manufacturing applications.
Figure 1.2: Face Impression Made By Flexible Sheet Metal Press
Three-dimensional imaging systems have come a long way in the last
several years. Improvements in electronics and computing power have made
today's systems faster and more portable than those available just a few
years ago. However, there still remains a need for more quick and accurate
systems than those we currently have. The sheet metal industry, for example,
could sorely use a real time, high density, sub-micron accuracy imaging
system. Laser Speckle could be just this system in a few years.
1.2 Objectives
The purpose of this thesis is to explore the current techniques available
for three-dimensional imaging, investigating in detail the laser speckle
wavelength decorrelation technique being researched at MIT Lincoln
Laboratory (Shirley et. al. [2]).
The first principal objective is a comprehensive literature review of the
current state of the three-dimensional imaging market. There are several
different underlying technologies which have been used to measure objects, and
each one has different strengths and weaknesses to be explored. Also, there
are many companies which currently market three-dimensional imaging
products which use these technologies. By exploring the capabilities of these technologies and products, areas of research need can be determined. The literature review will concentrate on techniques which can be applied to the sheet metal market, in particular concerning flexible sheet metal forming applications, since this is the scope of my research.
The second principal objective is an investigation of the laser speckle wavelength decorrelation technique. This is a promising new technique for three-dimensional imaging which could potentially fill a gap in the range of capabilities provided by those techniques already in commercial use. In order to compare the technique to others, it is necessary to obtain specifications through theoretical and experimental analysis. To do this, a stamped steel sheet metal part is measured on both the laser speckle system and a coordinate measuring machine (CMM), which is used as a standard. Several different variations of ambient conditions and surface finishes are used to determine the strengths and weaknesses of the speckle technique.
Once these objectives are met, possible niches for laser speckle can be explored, as well as possible three-dimensional imaging solutions for rapid prototyping and advanced manufacturing systems.
1.3 Outline of Thesis
The thesis is organized as follows. Chapters 2, 3, and 4 present the background information necessary to perform the laser speckle experiments. Chapter 2 presents information on coordinate measuring machines, the current three-dimensional metrology industry standard, which is used as the metric to which to compare the speckle technique. This includes detailed information concerning how a CMM works and the advantages and disadvantages of the system used. Chapter 3 contains a detailed comprehensive literature review of current methods of three-dimensional imaging, breaking the information down into sections based on the fundamental technologies on which the techniques are based. Chapter 4 presents information on the laser speckle wavelength decorrelation system being researched at MIT Lincoln Laboratory. This chapter includes
information on the optics theory behind the speckle technique, as well as a presentation of the system design. The equipment used in the system is discussed, and the software used for data collection is also presented. Furthermore, information regarding the data processing and image filtering techniques used to obtain images is discussed.
Chapters 5, 6, and 7 present the experiments, results, and conclusions concerning my research. Chapter 5 contains a detailed discussion concerning the sheet metal part used for the experiment and the various conditions under which it was measured on the speckle system and the CMM. Also presented is information about the New Focus laser which may be used in a prototype laser speckle system. In addition, the mathematical modeling and error mapping techniques used for determining the accuracy of the laser speckle system, using the CMM as a standard, are presented. Chapter 6 presents the data obtained from the CMM and laser speckle experiments. Also, the accuracy of the laser speckle method in various ambient conditions and with various surface finishes is determined. Chapter 7 presents conclusions which can be drawn from this research. The laser speckle wavelength decorrelation technique is evaluated along with the other three-dimensional imaging techniques currently available for measuring sheet metal. In addition, a market niche for laser speckle is proposed, and future research areas are discussed.
2
Mechanical Contact:
Coordinate Measuring Machine
2.1 Early Manual CMMs
The coordinate measuring machine, or CMM, is currently the most popular three-dimensional measurement device. It is widely used in many industries and is generally known as the metrology industry standard.
A CMM is any type of device which has a probe that can move in three or
more degrees of freedom relative to a part and also provides position feedback which allows the probe tip to be located in three-dimensional space. The earliest CMMs were similar to manual milling machines. In typical manual milling machines, there is a workpiece table which can translate in two dimensions (x,y), and there is a spindle which accommodates the cutting tool which can translate in one dimension (z). This basic milling machine / CMM design is illustrated below in Figure 2.1
Figure 2.1: Basic Milling Machine / CMM Design
The machinist manually moves the workpiece table via two wheels which
translate rotary motion into horizontal motion of the table. The wheels are
attached to a ruled cylinder, usually calibrated to 0.001", which is lined up with
a stationary cylinder with an arrow or other mark to read the current position.
One can obtain relative position information by reading the ruled scale. This
axis controller is shown in Figure 2.2 below. The spindle is usually translated
either by a lever or a wheel, also manually controlled and ruled in some manner
to provide position feedback. To use this machine as a CMM, one simply needs
to retrofit a probe to the cutting tool mounting hole. The part is placed on the
workpiece table, and the user touches the probe to the part, reading the
position of the three axes each time. This similarity in the three-dimensional
position feedback needs of CMMs and milling machines allow many milling
machines to also serve as CMMs in shops that do not have the money or space
for both machines.
uontrol Wheel
Figure 2.2: Manual CMM Workpiece Table Axis Controller
2.2 Continuous Contact Coordinate Measuring Machine
With the advent of the computer, CMMs became a much more powerful tool. Instead of reading a ruling or digital readout and recording data points by hand, the user could now record three-dimensional position data electronically. This necessitated the use of linear or rotary analog or digital position sensors to determine the position of the probe. The use of a computer and sensors also freed the CMM manufacturers from a simple Cartesian axis design. Any three or more degree of freedom system of linkages could be used to position the probe, and a simple computer program could be used to translate the information provided by the sensors into Cartesian coordinate data.
Although the technology was available to set the probe in continuous motion along one axis prior to the invention of the computer, it did not make sense to do this if one needed to record data manually. Now, it was possible to
record a steady stream of three-dimensional data points from the sensors while moving the probe along one axis. This allowed the invention of the continuous contact CMM, which could take data points very quickly while contact was maintained between the probe and the part.
Maintaining continuous contact between the probe and the part is crucial in this type of CMM. It is also crucial, however, to automate the motion of the probe up and down (z axis) while scanning along an axis (x or y axis) such that the probe or part is not damaged by excessive force between the two. One way of doing this is to design a probe which can sense the forces between itself and the part and react with appropriate vertical motion. This was done at MIT by Ousterhout [3], and it is pictured below in Figure 2.3.
Figure 2.3: MIT Continuous Contact CMM
The probe design incorporates two strain gauges to determine the deflection of the probe in the x and y axes (along the workpiece table) and an
LVDT to sense deflection in the z axis (up and down). The probe is free to translate in the z axis a few centimeters before the z axis is moved by motor control. As the CMM moves along one axis, the z axis is moved up and down according to an algorithm based on the input provided by the strain gauges and LVDT, with the goal of remaining in contact with the part. During the scan, a computer takes a steady stream of x,y,z data points according to a user set time interval. In this early design, however, the probe leaves large (1 mm) grooves in the part as it measures.
More current continuous contact machines have largely solved the problem of leaving deep grooves in the surface of the part. A recent probe design by Renishaw [4] (see Figure 2.4 below) incorporates three motor controlled degrees of freedom inside the probe which allows the angle of contact between the stylus tip and the part surface to remain normal throughout the scan. In a manner similar to the MIT scanning CMM design, the Renishaw probe incorporates a strain gauge system for sensing forces transverse to the probe's local z axis. In addition to a single linear transducer to determine motion of the probe tip along the local z axis, the Renishaw design also uses two angular transducers to determine the angular displacement of the probe tip in two degrees of freedom relative to the CMM's z axis. A computer takes the sensor feedback and moves the three local probe motors and the CMM's z
axis motor to keep the probe in continuous normal contact with the part
surface. The use of modem sensors and electronics in the probe allows the forces between the probe and the part to be kept at a near constant level which can be adjusted by the user to prevent significant damage to a part.
degree of freedom 3 rotary trans rotary trans linear tra strai legree of freedom 2 .gree of freedom 1
Figure 2.4: Renishaw Scanning Probe, Adapted From [4]
The continuous contact scanning method is also used in stylus instruments, frequently called profilometers, which are used for measuring surface roughness or geometries with extremely small range extents (less than 1•tm). Since this kind of range extent is not typical of sheet metal design applications, I will not go into depth concerning the details of this type of product. However, if you need more information, several papers [5-10] have been written detailing this application.
2.3 Touch Trigger Probe Coordinate Measuring Machine
The next invention to revolutionize the CMM was the touch trigger probe. Instead of having a computer read the axis position sensors at a constant rate while the probe maintains contact with the part, the computer is signaled by the probe to take a position reading when it touches the part surface at discrete points. This allows for sampling of parts at precise three-dimensionalpoints, unrestricted by the need to remain constrained to two axis motion while taking data points. With a touch trigger probe, one can easily check for the location or size of holes or other features, manually or via computer commands. Also, there is less danger of scraping grooves in a surface because the axial stiffness of the probe can be very little yet still allow for very accurate measurements. The triggering can be done in a number of ways, but the basic probe design is similar. One example of a touch trigger probe by Renishaw [11] is shown below in Figure 2.5.
Cross Section Slice A
The Renishaw touch trigger probe shown above incorporates two springs to allow motion of the probe axially and horizontally. When the probe contacts the part, axial motion of the probe results. This motion blocks some of the beam going from the LED to the light detector pair. This sudden change in voltage between the two detectors causes a trigger signal to be sent, indicating to the computer that the part has been contacted. At this instant, all sensor data is read, including both the linear encoders or other sensors for determining global x,y,z position and the strain gauges or other sensors for measuring the local deflection of the probe. Part contact triggering can also be done several other ways. Another common triggering scheme is that of mounting strain gauges in a position such that any sudden motion of the probe is detected. Also, one could use piezoelectric elements which can detect either strain or a shock wave generated by the contact between the part and the probe. In addition, a triggering circuit could be set up which is broken when the probe is unseated from its kinematic rest position, signaling contact with the part. One of the most creative methods of detecting contact was done by Renishaw [12], where the workpiece table is vibrated at high frequency (isolated from the probe, of course) and the contact is sensed by a piezoelectric crystal when the vibrations travel through the probe. This scheme prevents the probe from triggering from shock waves created by something other than the probe contact in a noisy manufacturing environment.
In addition to the triggering mechanism, it is necessary to correct for the finite probe tip radius. The probe tip will introduce an error at each data point of the magnitude of the radius of ball at the end of the probe. To obtain the direction of the error, one must determine the angle of contact between the probe and the part surface, from which the actual position of the part surface can be inferred. This can most easily be done via an arrangement of strain gauges placed to detect deflection of the probe in it's local x,y plane.
After the probe is retracted from the part surface, the probe is forced by springs to be kinematically seated at its original rest position, thus allowing for very repeatable measurements. In the probe of Figure 2.5, Renishaw chose to use a stiffer planar spring to allow probe motion in the local x,y plane and a less
stiff spring to allow axial motion. The reason for this arrangement was that in many touch trigger probes, there is frequently hysteresis in the rest position of the stylus after the probe is retracted, when the spring forces are unable to completely overcome the frictional forces to return the stylus precisely to its rest position. The very light axial spring force reduces the friction inside the probe, while the strong planar spring forces the probe back to its precise kinematic rest position. This design helps make the probe more repeatable.
2.4 Disadvantages of a CMM
Although coordinate measuring machines have come a long way from their earliest versions, there are still some significant disadvantages to using them in certain applications. The first of these is the speed of measurement. Certain CMM systems are faster than others, but measuring large parts with a dense sampling grid gets very time consuming because the CMM has to physically touch the entire part. For example, if you want to measure a part that measures 100 mm by 100 mm, and you want to sample the part in a 1 mm grid, each point taking 1 second, it will take you 10,000 seconds, or almost
3 hours to measure the part.
Also, there is the problem of elastic and plastic deformation of the surface of a part. Modem CMM's have solved the problem of scraping and dimpling hard surfaces, but softer surfaces can still be a problem. If you want to measure really sensitive surfaces such as foil, you can use a really sensitive probe to avoid plastic deformation, but you are going to have to compromise on time of measurement. The approach speed has to be very slow to be gentle on a sensitive surface. In addition, doing continuous contact scanning can be problematic when measuring surfaces with a high coefficient of friction against the probe tip, such as rubber, because of stick-slip behavior of the probe tip. However, even if you try to measure rubber or another easily elastically deformable material with a touch trigger probe, there can still be problems because of the elastic deformation which can occur, which can lead to faulty measurements.
Another limitation is that the size of the machine must be larger than the size of the part. If you want to measure a car door, you need a CMM that can move its probe to any part on the door. Since the cost of the machine exponentially scales with the size of the machine, measuring large parts can be both time consuming and expensive. Also, the fact that you have to touch each point on the part surface causes problems when there are recessed sections of the part with steep walls. You need your probe to be as long as the bottom of these sections in order to reach the part.
Finally, CMM probes have a finite diameter ball on the tip of the probe. This means that one can only measure surface features which have a spatial frequency larger than the diameter of the ball. Therefore, small holes and slots may not be picked up unless you use a small enough probe tip.
2.5 Brown & Sharpe MicroVal PFx CMM
Since the coordinate measuring machine is widely used and is currently the industry standard three-dimensional metrology device, it was a natural choice to use as the metric against which to measure the performance, accuracy, and other specifications of the laser speckle wavelength decorrelation system. For this research, a Brown & Sharpe MicroVal PFx CMM was used. The primary reason for the selection of this manufacturer's CMM was that MIT happens to have one, and that it was available for my use. Brown & Sharpe has loaned the MIT Laboratory for Manufacturing and Productivity the MicroVal PFx for use in student research. The MicroVal PFx is pictured below in Figure 2.6.
The MicroVal PFx system includes an IBM compatible 486 PC. Brown & Sharpe provided a computer program, Micromeasure IV, to be the interface between the user and the CMM. The program had a somewhat convenient icon based graphical user interface, but the system took a significant amount of learning time before I was proficient at measuring a part. One can either use the computer to control the motion of the CMM, or one can manually control it via the attached joystick controller or by holding onto the grip just above the probe assembly and moving it by hand.
The MicroVal PFx uses air bearings to allow for quick, low friction motion. It moves with three degrees of freedom, able to translate in the x, y, and z axes. The CMM uses a bridge type design to prevent errors introduced from bending in a cantilever arm. A direct drive design is used for actuation of the stages, where the motor is directly coupled to the drive shaft, translating rotary motion to linear motion by six roller bearings.
Position information for the x, y, and z axes are read via linear incremental optical encoders. The encoder consists of two glass scales, an LED source, and a photodiode receiver. The glass scales are coated with lines of a highly reflective material, with non-reflective gaps between them. One glass scale runs the full length of the bearing, and it is mounted to the bearing. The second glass scale, called the reticle, is much smaller, and is slid along the bearing next to the first scale. As the reticle is moved over the stationary scale, light from an LED is aimed through the reticle, off of the scale, back through the reticle, and into a photodiode. During the linear motion, the light reaches the photodiode in a square wave manner. Position information (the number of counts), is sent to the computer. The reticle has an additional grating which is physically offset 1/4 of a division (90') from the first grating. This grating has its own LED and photodiode, and this signal either precedes or follows the other signal depending upon the direction of travel [13]. This type of encoder is called a quadrature encoder [14].
Brown & Sharpe gives the following specifications for their MicroVal PFx
CMM:
* volumetric accuracy: 10 gm
* linear accuracy
* resolution 1 im
* repeatability 3 pm
* range XYZ 457 x 508 x 406 mm
* weight (complete system) 727 kg
*
cost
$100,000.00
2.6 Summary
Today, CMMs are available in all shapes and sizes. A host of companies manufacture them, for prices ranging from a few thousand dollars for a small manual CMM to several hundred thousand dollars for large computer controlled ones. They are in use in every manufacturing sector from designing small consumer products to designing automobiles and airplanes. As one can guess, the accuracy and resolution of these devices vary according to the scale,
axis motion schemes, sensors chosen, and probe used. Some manufacturers of
CMMs include the following:
* Brown & Sharpe, North Kingstown, RI
* Brunson Instrument Company, Kansas City, MO * Carl Zeiss
* DEA, Livonia, MI
* Forward Poli, Chesterfield, MI * Helmel, Niagara Falls, NY
* International Metrology Systems, Ontario, Canada * LK Inc., Brighton, MI
* L.S. Starrett, Mount Airy, NC * MicroVu, Windsor, CA
* Mitutoyo, Tokyo, Japan
* Renishaw, Gloucestershire, UK * Romer, Inc., Carlsbad, CA * Sheffield
* Simco Industries, Inc., Roseville, MI * TSK America, Farmington Hills, MI
The accuracy of a CMM is fundamentally limited by a few things. The first of these is the sensors used to determine the position of the probe tip in three-dimensional space. Most CMMs use linear encoders to determine the position of the global x, y, and z axes, and most CMMs use Renishaw Probes,
which use strain gauges to determine the relative orientation of the surface when the probe contacts it. Also, the accuracy of a CMM is limited by the straightness of the rails and the squareness of the axes to each other. The larger the CMM, the longer the axis rails, and therefore the more error the rail straightness and squareness can introduce into the system. Naturally, cheaper machines use cheaper sensors and axis rail materials, so accuracy varies from manufacturer to manufacturer. However, a linear accuracy, resolution, and repeatability of 1gim is not uncommon among the above listed CMM manufacturers. As technology allows manufacturers to create longer, straighter axis rails, more finely grated optical encoders, and more accurate strain gauges, CMMs can become increasingly more accurate, as long as consumers are willing to pay the price for it. However, as CMMs incorporate these new technologies, things which are neglected now such as air currents and workpiece table vibration may become much more important to the accuracy of the machine.
Survey of Three-Dimensional
Imaging Techniques
Although there are scores of three-dimensional imaging products currently commercially available, they rely on the same basic set of fundamental technology categories. The first way to differentiate between the technologies is to determine whether or not there is mechanical contact between the measurement device and the part to be measured. The coordinate measuring machine, the most popular mechanical contact three-dimensional measuring device, was discussed in detail in the previous chapter. Of non-contact devices, one can make a distinction between passive and active methods of measuring. A passive method is one which does not introduce special lighting onto the part in order to measure it, while an active method may project a pattern of light onto the part or probe the part with beams or planes of laser light. Another basic difference between non-contact devices is whether or not geometric triangulation is used to obtain range information.
In the following sections, each of the fundamental non-contact three-dimensional imaging technologies will be discussed in detail. They will be
presented in four sections, classified according to whether they are active or passive and whether or not they use triangulation to obtain range information. Several [15-25] have published three-dimensional imaging technique surveys from different perspectives. In this survey, I concentrate on uses which can be applied to sheet metal manufacturing.
Some of the terms which are used to describe the capabilities of three-dimensional imaging techniques are shown below in Figure 3.1. The standoff distance of a sensor is the minimum distance from the sensor at which objects can be imaged to within the cited accuracy. The depth of field is the maximum possible range extent of a target which can be measured accurately. The field of view is the maximum possible cross range extent of a target, perpendicular to the ranging axis of the sensor, which can be measured accurately. The range resolution of a sensor is the minimum discernible range difference between parts of a target.
range resolution
ll I II III III
angular
field of view 4 field of view I-IFigure 3.1: 3D Imaging Terms, Adapted From [17]
33
3.1 Passive Triangulation
Triangulation is based on elementary geometry, as shown below in Figure
3.2. The law of sines states that if the length B (the baseline) of one side and
two interior angles LAB and LBC of the triangle ABC are known, then the lengths A and C and the remaining angle LAC must satisfy the following relation:
sin(ZAB) sin(ZBC) sin(LCA)
(3.1)
C A B
Therefore, if one knows the length of the baseline of a triangle and the angles at the baseline vertices, then the range from either of the two vertices to the third one can be easily computed as the corresponding triangle side via the law of sines (Equation 3.1). Thus, triangulation-based imaging systems measure angles and baseline distances as accurately as possible in order to do accurate ranging. Also, all triangulation systems can have a problem if occlusion prevents measurement of the second angle because a point is only visible along side A or C in the triangle ABC.
As shown below in Figure 3.2, the epipolar plane is the plane in which the triangle lies. Passive triangulation methods rely on the basic geometric relationship of Equation 3.1, making use of ambient light conditions.
target point camera axis
camera axis (stereo)
range
epipolar plane
baseline camera (stereo)
or projector (structured light) Figure 3.2: Triangulation Range Sensing, Adapted From [181 3.1.1 Stereo Disparity
Stereo Disparity is the most well known non-contact three-dimensional imaging technique, since it is used in human vision from up to 200 feet. Stereo disparity techniques use an image sensor (usually a CCD array, a two dimensional array of detectors which accumulate a photon-induced charge when light falls on them) at each of two triangle vertices, as shown in Figure 3.2 above. A stereo pair of images can be obtained either from two separate cameras or from a single camera which is moved from one vertex to the other.
The range from either camera to the target can be easily calculated as long as one can match up each point on the target in one camera with a point on the target in the other. This is called the correspondence or registration problem, and it has plagued researchers in stereo disparity for many years. If correspondence is to be determined from the image data, there must be sufficient visual information at the matching points to establish a unique pairing relationship.
There are two main problems concerning correspondence. The first arises when parts of an image are so uniform in intensity and color that matching is made impossible, and the second arises when the image of part of the scene appears in only one view of the stereo pair because of occlusion effects or because of the limited field of view captured by the cameras. For simple objects with sharp edges, stereo vision can work well. However, the more complicated objects are, the more complex stereo matching algorithms must be in order to match features in one camera view to features in the other. Also, as the complexity of the matching algorithm increases, so does the time it takes to obtain three-dimensional data.
There have been many attempts to solve this problem, such as the Marr-Poggio-Grimson algorithm [26] and several others [24, 27-28]. However, problems with occlusion, shadowing, optical illusions, out-of-focus smearing, and specular reflections abound. One way to simplify the problem is to project structured light onto the target, but this is an active triangulation technique, and it will be discussed in the appropriate section.
The accuracy of a stereo disparity system is heavily dependent on the ability of the correspondence algorithm used to match features in the two cameras. This is the biggest disadvantage with the use of stereo disparity systems. As computer systems get more powerful and algorithms become more efficient, the accuracy of such a system can improve.
If the correspondence problem is solved for relatively simple target shapes, then the accuracy of the system would be determined by the resolution of the cameras, which is related to the number of pixels in the CCD array used. If one uses a 512 by 512 pixel CCD camera, then the cross range resolution is limited to the horizontal or vertical field of view divided by 512. The range resolution is dependent on the distance between the cameras. An increased camera separation results in increased range resolution for a given size CCD array, but too much separation may result in occlusion, which will cause the range information in the section of the target not visible in both cameras to be lost. This tradeoff must be optimized for each measurement taken.
Because of the disadvantages of the stereo disparity method discussed above, the technique is not widely used for range finding in manufacturing. It is mostly used in areas where range accuracy on the level of microns is not necessary, such as robot guidance and bin picking.
3.2 Active Triangulation
3.2.1 Point Laser Triangulation
Point laser triangulation is the most widely used non-contact three-dimensional measurement technique in the manufacturing industry. This technique involves the projection of a laser beam onto a target, and a detector (usually a linear CCD array) is used to image the point. The range to a point on the target is then calculated using a simple geometric equation.
A simple design for a point laser triangulation range sensor is shown below
in Figure 3.3. This design incorporates a light source and a detector, separated
by a fixed baseline distance, which must be accurately calibrated. The light
source is aligned along the z axis with the center of its lens positioned at (0,0,0). At a baseline distance b from the light source along the x axis is the detector lens, which is tilted at a fixed angle relative to the x axis baseline. A spot of light from the laser beam is projected onto the detector at the pixel u, which is measured in pixels from the u axis intersection with the w axis, which goes through the center of the detector lens parallel to the z axis. Thus, one can calculate that uz = bf, via similar triangles where f, is the z component of the focal length if the detector lens, measured in pixels. The range value z of the target point can be calculated from the measured value u as shown in the following relation:
z = b
(3.2)
In this technique, a change in the range of the part, Az, is reflected in a shift in the beam image on the CCD array by Au pixels.
fz
b
Z axis ;he page, the page• zFigure 3.3: Point Triangulation Range Sensor, Adapted From [19]
By itself, this technique is a single dimensional one, and it is used as such
in many industries, especially by automobile companies for measuring tolerances at single points. However, a point triangulation sensor becomes a three-dimensional device when it is retrofitted to a CMM in place of a scanning
contact probe or tough trigger probe; it uses the CMM to scan it in a similar
manner to a contact probe. This is one of the principal reasons for its current popularity. A point triangulation sensor allows for much greater scanning speeds than mechanical contact techniques, but it can be used with a CMM for a fraction of the cost of purchasing a whole new system.
The accuracy of a point triangulation sensor can be no better than the equipment it is used with. If it is used as a CMM attachment, the error of the CMM is added to the error of the sensor to obtain the error of the measurements taken with the system. Concerning the sensor itself, it is a
common belief that a large baseline distance separating the laser and the detector is necessary to allow for accurate determination of range. However, for any fixed baseline distance and detector lens focal length, the range resolution of a triangulation system of this type is limited only by the ability of the system to accurately measure the horizontal position of the point where the laser hits the CCD array, and the range accuracy is only limited by the accuracy of the knowledge of the baseline length, the focal length of the detector lens, and the ability to properly focus the image on the detector. Therefore, the components should be mounted sturdily and kinematically, and the chassis of the device should be made of a material with low thermal expansion properties.
A detector with the smallest pixel size will allow for the greatest
resolution, which is be directly related to the resolution of range measurement. Also, a greater baseline distance will allow for more range resolution for a particular detector array. The reason for the influence of baseline distance in range resolution is that a greater angle between the detector-lens axis and the beam axis will cause a change in range to translate to a greater number of pixels to be traversed by the beam in the detector. However, a greater baseline will allow less range measurement for a given detector-array size and laser power, and the longer the baseline becomes, the chance increases for occlusion to cause the beam to be blocked from reaching the detector.
Linear arrays of photodiodes may have more than 4000 elements. The number of positions that can be resolved by position sensitive photodiodes is in the same range. However, the space bandwidth product of photodiode arrays can be much larger than the number of pixels. Using proper choice of spot shape and evaluation of its center of mass via a computer algorithm, it is possible to resolve about 50 positions per pixel. Therefore, a limited number of detector elements is usually not the factor limiting the resolution of the technique. The limitation arises from speckle noise, which can vary the localization of the laser spot image as a function of the arbitrary microstructure of the spot. Many have researched the effect of speckle noise on the microstructure of a laser beam. One useful paper is [29]. It is evident
that a beam with the smallest spot size (diameter at the point where the beam strikes the target) should be used for highest range accuracy. The smaller the spot size, the better the center of the beam can be detected without as many problems from speckle noise.
A problem with all laser-triangulation techniques is that of specular
reflection. Attempting to measure a surface which is too reflective may result in no range measurement if there is no scattering of light at the surface and the reflected light never reaches the camera. Also, errors in measured range values can occur if the reflected light is subsequently reflected by other surfaces before part of it reaches the camera.
Point triangulation sensors come in all shapes and sizes. Digital theodolites are used for large scale measurements of targets such as airplanes. These are made by Zeiss [30], Cubic Precision [31], and Brunson [32]. Cubic Precision makes the AIMS III which they claim has a range accuracy of 25
pm. Brunson makes the BETS (Brunson Electronic Triangulation System).
They also claim a range accuracy of 25 gm. The BETS system uses as many as ten theodolites working simultaneously to measure large parts. The main problem with theodolites is that measuring more than a few points is very time consuming. The reason for this is that theodolites only measure in one dimension and the other two are determined by careful positioning of the theodolites and knowledge of those positions.
Smaller scale point triangulation sensors which can be retrofitted to CMMs are made by Perceptron [331, Measurement Technologies [34], and Medar [35]. Perceptron makes the DataCam sensor, and they claim a range accuracy of 50 pm at a rate of 15,000 points per second, for a price of $6500 per sensor. Measurement Technologies makes the Percimeter II, and they claim a range accuracy of 0.2 pm with a total range of 3 mm and a range accuracy of 40 pm with a total range of 200 mm. The Percimeter II can measure 600 points per second.
Medar makes the MDR Range Sensor. They claim a range accuracy of 50 jpm at a rate of 2,000 points per second. It uses an infared laser diode, of frequency 780 nm, as its light source.
3.2.2 Scanning Point Laser Triangulation
Although point laser triangulation can take data points quickly, in order to increase data acquisition speed further, one needs a CMM to move the sensor back and forth very quickly. It is easy to see the practical speed limits of this technique. However, using similar geometric relations and more complex sensor design, it is possible to vastly increase measuring speed either by having the sensor control scanning along one axis and the CMM control motion along the other, or by having the sensor control scanning along both axes.
One design for a scanning point triangulation range sensor which controls scanning along one axis is shown below in Figure 3.4. A two dimensional CCD array is aligned along the z axis with the center of its lens positioned at (0,0,0). At a baseline distance b from the detector along the x axis is a light projector sending out a beam of light at a variable projection angle 0 relative to the x axis baseline. A two dimensional point x,z is projected into the digitized image at the pixel u. Thus, one can calculate that uz = xfvia similar triangles where f is the focal length of the detector lens, measured in pixels. The two dimensional x,z coordinates of the target point can be calculated from the measured values
u, 8 as shown in the following relations [17]:
b x = - u (3.3)
f
cot-u
b z= . f (3.4) f cot 9 - u 41scanning point
Y axis into the page, v axis out of the page
beam part
3D point
(x,y,z)
uaxisj
Figure 3.4: Camera Centered Point Triangulation
Synchronized scanning, a concept patented by Marc Rioux [36], increases the potential data acquisition speed by scanning a laser beam in two directions. In this technique, the linear position detector and the light projector are both scanned. The projection angle is coupled with the horizontal position measurement, allowing high range resolution with a small baseline by making more efficient use of the finite resolution provided by a linear detector. The only difference between synchronized scanning geometry and conventional scanning geometry is the addition of a detector scanner which moves synchronously with a projection scanner and has the effect of canceling its angular movement. This results in bringing the position of the spot on the sensor closer to the reference point. Therefore, a change in the position of the light spot along the z axis produces an equivalent angular shift for both
geometries, but a change along the x axis produces a much smaller angular shift when using synchronized scanning geometry. By combining the two separate scanning mechanisms described above, a perfect synchronization can be obtained. This is done by using polygonal or pyramidal mirrors or a plane mirror coated on both sides. An example of this technique is shown below in Figure 3.5.
b
Figure 3.5: Autosynchronized Scanning, Adapted From [37]
With synchronization, the position sensor is mainly used to measure range, while in conventional geometries a large part of the position sensor area is also used to measure x coordinates. This is unnecessary because the position of the scanner mirror can be precisely obtained. If a sensor is designed that incorporates synchronization and uses the same position sensor that is used in conventional geometries, the focal length of the lens used to collect the light can be increased, providing an increased range resolution without reduction in the field of view.
In Figure 3.5, a laser diode and a linear CCD array are positioned next to each other and near a multifaceted pyramidal mirror. The beam leaves the source, hits the mirror facet currently rotated at angle 0 to normal, reflects off a fixed mirror M1, reflects off a slowly scanning mirror M3, and impinges on a
43
target surface. The illuminated bright spot is viewed by the detector via the opposite side of the multifaceted mirror, a fixed mirror M2 separated by a fixed baseline distance b from the other fixed mirror, and the slowly scanning mirror M3. The horizontal position p of the bright spot at the detector is given by the following relation:
p+wtanO rof
u(p)
=w
-, w = (3.5)w - p tan O ro - f
where u(p) is the effective horizontal position if synchronized scanning was not used, w is the distance from the center of the focusing optics to the position detector surface, f is the focal length of the detector's lens, and ro is the average
range to object surface points, determined by the angular positioning of mirrors M1 and M2. A vertical mirror M3 slowly scans, typically two orders of magnitude slower than the pyramidal mirror. M3 is rotated by an angle 0 whose rotational axis is located a distance h from the baseline between the fixed mirrors. The three-dimensional coordinates of points on the target are determined by the values 0, 0, and p, the pyramidal scanning mirror angle, the vertical mirror M3 scanning angle, and the linear position detector value, respectively, via the following relations:
= bu(p) (3.6) u(p) + wa(O)
=
bw
- h sin(2)
(3.7)
(u(p)
+
wa(
)
z
bw
- h cos(2 )
(3.8)
(u(p) + wa(0)where the angular function of horizontal scanning pyramid mirror is given by:
b + 2ro tan0 (39)
To the best of my knowledge, autosynchronized scanning provides the best combination of speed and accuracy currently commercially available. The speed of measurement is only limited by the ability to rotate the mirrors quickly yet still accurately and the ability of the computing system with which the device is used.
Scanning laser triangulation systems are commercially available from Hymarc [38] and Medar [391. Hymarc makes the Hyscan 3-D Laser Digitizer. They claim a range accuracy of 25 gm for a depth of field of 40 mm, at a rate of
10,000 points per second, and at a cost of about $90,000. The Hyscan sensor
scans in two directions, using the autosynchronized scanning method described above. In fact, Hymarc works with Marc Rioux, who patented the concept of synchronized scanning. Medar makes the MDC contour sensor, and they claim a range accuracy of 25 jim. The MDC scans a laser beam in one direction (y) only. It can therefore be used to measure contours, or it can be retrofitted to a CMM which would move the sensor in the other horizontal direction (x).
3.2.3 Structured Light: Line, Grid
When a laser beam is passed through a cylindrical lens, a line of light is created. A scanning line triangulation system uses similar geometric relations to those presented in the previous section. However, instead of scanning a point in two directions and using a linear detector array, a line is scanned in one direction, and a two dimensional detector array is used. A typical line scanning technique is shown in Figure 3.6 below. Data collection may be faster with this method, but two dimensional CCDs are more expensive than linear CCDs, and range resolution may decrease because two dimensional CCD arrays are usually 256 by 256 or 512 by 512 pixels, where linear photodiode arrays or linear CCD arrays may have more than 4000 elements.
target
ating
rror
Figure 3.6: Line Scanning, Adapted From [40]
Another form of laser triangulation uses more complicated structured light. One could project multiple points, multiple lines, a grid of lines, or other geometric shapes onto a target, using a grating and one or more lenses. A two
dimensional CCD array would serve as the detector, imaging the whole target
at once, without scanning. The benefit of this type of technique is that there are no moving parts to break or become misaligned. However, using a two
dimensional CCD with only 512 by 512 pixels will limit the range resolution.
Also, the cross range resolution is limited by the spacing of lines projected onto the target.
United Scanning Technologies [41] makes the Replica system. The Replica uses a line scanning system similar to that shown in Figure 3.6 above. Intelligent Automation Systems [42] makes a structured light line sensor called the 4D-Imager, and they claim a range accuracy of 1/2000 of the field of view. They have achieved a data collection rate of 10,000 points per second, for up to 50,000 points in a single scene. Modular Vision Systems [43] makes

![Figure 2.4: Renishaw Scanning Probe, Adapted From [4]](https://thumb-eu.123doks.com/thumbv2/123doknet/13801619.441142/23.918.212.649.108.579/figure-renishaw-scanning-probe-adapted.webp)
![Figure 2.5: Renishaw Touch Trigger Probe, Adapted From [111]](https://thumb-eu.123doks.com/thumbv2/123doknet/13801619.441142/24.918.200.768.350.1022/figure-renishaw-touch-trigger-probe-adapted.webp)

![Figure 3.1: 3D Imaging Terms, Adapted From [17]](https://thumb-eu.123doks.com/thumbv2/123doknet/13801619.441142/33.918.135.747.558.961/figure-d-imaging-terms-adapted-from.webp)
![Figure 3.3: Point Triangulation Range Sensor, Adapted From [19]](https://thumb-eu.123doks.com/thumbv2/123doknet/13801619.441142/38.918.168.794.117.610/figure-point-triangulation-range-sensor-adapted.webp)
