HAL Id: hal-03032131
https://hal.archives-ouvertes.fr/hal-03032131
Submitted on 15 Dec 2020HAL is a multi-disciplinary open access archive for the deposit and dissemination of sci-entific research documents, whether they are pub-lished or not. The documents may come from teaching and research institutions in France or abroad, or from public or private research centers.
L’archive ouverte pluridisciplinaire HAL, est destinée au dépôt et à la diffusion de documents scientifiques de niveau recherche, publiés ou non, émanant des établissements d’enseignement et de recherche français ou étrangers, des laboratoires publics ou privés.
Comparative Phylogenetics of Papilio Butterfly Wing
Shape and Size Demonstrates Independent Hindwing
and Forewing Evolution
H. L. Owens, D. S. Lewis, Fabien L. Condamine, A Kawahara, R Guralnick
To cite this version:
H. L. Owens, D. S. Lewis, Fabien L. Condamine, A Kawahara, R Guralnick. Comparative Phylogenet-ics of Papilio Butterfly Wing Shape and Size Demonstrates Independent Hindwing and Forewing Evo-lution. Systematic Biology, Oxford University Press (OUP), 2020, 69 (5), pp.813-819. �10.1093/sys-bio/syaa029�. �hal-03032131�
TITLE: Comparative phylogenetics of Papilio butterfly wing shape and size demonstrates
1
independent hindwing and forewing evolution 2
3
RUNNING TITLE: Comparative phylogenetics of Papilio wing morphology
4
5
AUTHORS: HL Owens*,1,2, DS Lewis3, FL Condamine4, AY Kawahara2, RP Guralnick2
6
*Corresponding author 7
8
1. Center for Macroecology, Evolution, and Climate, University of Copenhagen, Copenhagen, 9
Denmark 10
2. Florida Museum of Natural History, University of Florida, Gainesville, FL USA 11
3. Department of Biology, Burman University, Lacombe, Alberta, Canada 12
4. CNRS, Institut des Sciences de l’Evolution de Montpellier (Université de Montpellier), 13
Montpellier, France 14
15
CORRESPONDING AUTHOR DETAILS
16
Hannah L. Owens 17
Center for Macroecology, Evolution, and Climate 18 University of Copenhagen 19 Universitetsparken 15, byg 3 20 2100 Copenhagen Ø, Denmark 21 Email: hannah.owens@bio.ku.dk 22 23
ABSTRACT
24
The complex forces that shape butterfly wings have long been a subject of experimental 25
and comparative research. Butterflies use their wings for flight, camouflage, mate 26
recognition, warning and mimicry. However, general patterns and correlations among 27
wing shape and size evolution are still poorly understood. We collected geometric 28
morphometric measurements from over 1400 digitized museum specimens of Papilio 29
swallowtails and combined them with phylogenetic data to test two hypotheses: 1) 30
forewing shape and size evolve independently of hindwing shape and size, and 2) wing 31
size evolves more quickly than wing shape. We also determined the major axes of wing 32
shape variation and discovered that most shape variability occurs in hindwing tails and 33
adjacent areas. We conclude that forewing shape and size are functionally and 34
biomechanically constrained, while hindwings are more labile, perhaps in response to 35
disruptive selective pressure for Batesian mimicry or against predation. The development 36
of a significant, re-usable, digitized data resource will enable further investigation on 37
tradeoffs between flight performance and ecological selective pressures, along with the 38
degree to which intraspecific, local-scale selection may explain macroevolutionary 39
patterns. 40
41
KEYWORDS: geometric morphometrics, museum specimens, Lepidoptera, Batesian
42
mimicry 43
“…[O]n these expanded membranes Nature writes, as on a tablet, the story of the 45
modifications of species, so truly do all changes of the organization register 46
themselves thereon.” – Henry Walter Bates on butterfly wings, 1863 47
48
For decades, researchers have examined butterfly wing diversity through lenses of functional 49
adaptation, evolutionary history, and development. For nearly all Lepidoptera species, wings 50
power flight to search for larval host plants, nectar sources, mates, and new territory (Scoble 51
1992). The physical requirements for powered flight are thought to exert natural selective 52
pressure on lepidopteran wing size and shape; indeed, artificial selection experiments on wing 53
and body size allometries have demonstrated significant fitness advantages for wild-type males 54
compared those selectively bred for alternative allometries (Frankino et al. 2005). However, 55
evidence suggests that forewings and hindwings unequally contribute to flight performance: in a 56
study of 19 species of butterflies and 25 species of moths, all could fly with their hindwings 57
removed, although at the cost of speed and maneuverability (Jantzen and Eisner 2008). 58
Therefore, forewing shape and size may result from stabilizing selection imposed by the 59
biomechanical requirements of flight, whereas hindwing shape and size may respond more 60
readily to neutral or selective processes such as sexual selection (Chazot et al. 2016), and 61
predation pressure (Sourakov 2013, Barber et al. 2015, Willmott et al. 2017, Rubin et al. 2018). 62
Still, experimental manipulations (e.g. Jantzen and Eisner 2008) cannot characterize 63
processes at evolutionary time scales and across lineages. Comparative analysis of data from 64
natural history collections may ameliorate this shortcoming by bridging the gap between 65
experimental manipulation and observed macroevolutionary patterns. Strauss (1990) quantified 66
variation in wing morphology in select heliconiine and ithomiine butterflies and found hindwings 67
were much more variable than forewings, providing a tantalizing link between functional studies 68
and the impact of aerodynamic constraints on wing shape evolution. In contrast, a recent study of 69
Morpho butterflies found a strong correlation between fore- and hindwing sizes as well as shapes
70
(Chazot et al. 2016). Such datasets can also be used to identify morphological “paths of least 71
resistance,” axes along which diversification happens most quickly (Schluter 1996). Comparative 72
studies of Myotis bat skulls (Dzeverin 2008) and whole Pheidole ants (Pie and Tschá 2013) 73
found size evolved more quickly than shape, but size variation as an evolutionary path of least 74
resistance remains untested in Lepidoptera. 75
We built on this groundwork to test two predictions via examination of swallowtail 76
butterflies in one clade of the genus Papilio (subgenera Agehana, Alexanoria, Chilasa, 77
Heraclides and Pterourus, hereafter “swallowtails in the clade of interest”): 1) forewing shape
78
and size evolve independently of hindwing shape and size, and 2) wing size evolves more 79
quickly than wing shape (Table 1). Our first prediction is based on the presumption that the 80
forewing is functionally constrained while other selective pressures (e.g. predation, sexual 81
selection) operate on hindwing shape. The second is based on the presumption that overall size 82
change is an evolutionary path of least resistance. To test these hypotheses, we took 83
morphometric measurements from digitized museum specimens and analyzed them in a 84
comparative phylogenetic framework with a well-sampled and resolved species-level phylogeny 85
(Owens et al. 2017). 86
METHODS
88
Morphometrics
89
Standardized dorsal and ventral images of Papilio butterfly specimens with scale and 90
color bars were obtained from four natural history museums (Supplemental Fig. 1): the American 91
Museum of Natural History (AMNH), Field Museum (FMNH), Florida Museum of Natural 92
History, McGuire Center for Lepidoptera and Biodiversity (MGCL), and the Smithsonian 93
Institution National Museum of Natural History (NMNH; Supplemental Table 1). Images were 94
taken with a NIKON D300S with an AF Micro-Nikkor 60mm f/2.8D lens (AMNH), Canon EOS 95
70D with a Canon EF 50mm f/1.4 USM lens (FMNH), Canon EOS 70D with a Canon EF-S 96
60mm f/2.8 Macro USM lens (MGCL), or a Canon EOS 6D with a Canon EF 28-80mm f/3.5-5.6 97
lens (NMNH) mounted on either a copy stand or tripod and operated manually (AMNH) or 98
tethered to a MacBook Air with the Canon EOS Utility (FMNH, MGCL, NMNH; Supplemental 99
Fig. 2). Photographs were centered with white-space around images, where labels and color bar 100
are located, to limit lens distortion. Specimen label data, collection date, location and sex of 101
specimen (where available) were transcribed by volunteers via the Notes from Nature platform 102
(Hill et al. 2012). All standardized images used in this study have been made publicly available 103
(AMNH:
https://datadryad.org/stash/share/Lq-XOj-IAFl-104
PyvNF3Es77l3n4WgsEKE6XrKTjPH7z8; FMNH:
https://pj.fieldmuseum.org/event/626b0f98-105
98e7-49c8-903e-d67017fe2356; MGCL: LINK PENDING; NMNH: LINK PENDING). 106
Landmarks for morphometric measurement were based on previous morphological work 107
on Heraclides swallowtails (Lewis et al. 2015; Fig. 1). One forewing landmark (F1 in Fig. 1), 108
was removed from final analysis due to particularly high rate of measurement error; this was 109
largely due to curling of the anterior wing margin in many specimens. To allow full view of 110
otherwise overlapping wing elements, we used 10 forewing landmarks from dorsal images and 111
12 hindwing landmarks from ventral images (Fig. 1). Landmark and 1 cm scale bar coordinates 112
were collected in ImageJ 1.49 (https://imagej.nih.gov/ij/) using the PointPicker plugin 113
(http://bigwww.epfl.ch/thevenaz/pointpicker/) and imported into Microsoft Excel for collation 114
and post-processing. We collected 1,449 dorsal and 1,404 ventral landmark measurement sets 115
representing 60 and 59 species, respectively (Supplemental Table 1). Measurements were 116
calibrated with scale bar coordinates, and final coordinate text files were prepared using 117
TextWrangler 5.5.2 (http://www.barebones.com/products/textwrangler/). These data are 118
available in Appendix 1 (
https://datadryad.org/stash/share/Lq-XOj-IAFl-119
PyvNF3Es77l3n4WgsEKE6XrKTjPH7z8). Forewing and hindwing landmark data with scale 120
information were superimposed using Procrustes alignment; species represented by fewer than 121
10 specimens and statistical outlier landmark sets were removed, and the final datasets were re-122
aligned. We tested for allometric effects in fore- and hindwing shape variation using the 123
homogeneity of slopes test (grouping specimens by species) and a subsequent Procrustes 124
ANOVA to determine the contribution of size in determining shape variation. Mean species 125
shape was calculated, the resulting dataset was re-aligned, gross outliers were removed, and 126
allometric effects (grouping species into two subclades: Agehana + Pterourus, Alexanoria, 127
Chilasa, and Heraclides, Fig. 1) were examined. Finally, mean intraspecific Procrustes distance
128
from mean shape, morphospace volume occupied by each species (the product of the range of 129
each principal component excluding values more than 1.5 times greater or less than the 130
interquartile range), mean intraspecific centroid size, and intraspecific centroid variance were 131
calculated from the specimen-level dataset. These four shape summary statistics were each 132
rescaled to values between 0 and 1 using min-max normalization to render them comparable for 133
downstream analyses. All shape analyses were performed using the R package geomorph 3.1.2 134
(Adams et al. 2013), except for intraspecific Procrustes distance from mean shape, which was 135
calculated using Evomorph 0.9 (Cabrera and Giri 2016; details can be found in Appendix 2). 136
137
Testing independence of forewing and hindwing shape evolution
138
Using a recently-published time-calibrated phylogeny for swallowtails in the clade of 139
interest (Fig. 1; Appendix 1; Owens et al. 2017), we performed a suite of comparative 140
phylogenetic analyses of forewing and hindwing morphology to test the independence of fore- 141
and hindwing shape and size evolution. These analyses were all done in R 3.5.1 (R Core Team 142
2012; details of the analyses can be found in Appendix 2). We estimated phylogenetic signal of 143
fore- and hindwing shapes using Kmult, (Blomberg et al. 2003), a generalization of Blomberg’s K
144
implemented in the R package geomorph 3.1.2 (Adams et al. 2013). Just as with the traditional 145
Blomberg’s K statistic, the closer Kmult is to 1, the more variation in species’ characters can be
146
explained by their phylogenetic relationships under a Brownian motion (BM) model of 147
evolution, and values of K< 1 indicate more variation than expected under BM (Blomberg et al. 148
2003). We then used geomorph to calculate the modular rate ratio (function: 149
compare.multi.evol.rates) for the fore- and hindwing datasets (Denton and Adams 2015), and test
150
whether fore- and hindwing shape evolution was correlated (also known as phylogenetic 151
integration, function: phylo.integration; Adams and Felice 2014). Both tests were conducted 152
under an assumption of BM, as this is the only model currently available for such 153
multidimensional datasets implemented in geomorph (Adams and Collyer 2018). 154
155
Testing independence of fore- and hindwing size evolution
We also tested the independence of forewing and hindwing size evolution. First, we 157
estimated the phylogenetic signal (univariate Blomberg’s K), then estimated the evolutionary 158
rates of fore- and hindwing shape based on the best-fit evolutionary model for each dataset, and 159
finally, tested for significant fore- and hindwing centroid size correlation. These analyses were 160
done using the R packages phytools 0.6-60 (Revell 2012), geiger 2.0.6 (Harmon et al. 2008), and 161
phylolm 2.6 (Tung Ho and Ané 2014); additional details can be found in Appendix 2.
162
Correlations were assessed using a linear-time algorithm developed by Tung Ho and Ané (2014). 163
For the correlation between fore- and hindwing centroid size, we fit a series of phylogenetic 164
linear regressions with different evolutionary models—BM, Ornstein-Uhlenbeck (OU) with root 165
ancestral state estimated from the data, and early burst (EB). We chose the best-fit model for the 166
relationship between fore- and hindwing centroid size based on its minimum corrected Akaike 167
Information Criterion (AICc) score as calculated using the R package MuMIn 1.42.1 (Barton 168
2018) and examined the ratio of hindwing to forewing evolutionary rates (σ2) under these best-fit 169
models using geomorph. To get a clear picture of the degree to which fore- and hindwing 170
centroid sizes were correlated, we calculated R2pred for hindwing size as explained by forewing
171
size; this is an extension of the traditional R2 that weighs the residuals by variance and 172
covariance (Ives 2018). These calculations were done using the R package rr2 1.0.1 (Ives and Li 173
2018; Appendix 2). 174
175
Differences in speed of shape and size evolution
176
We made a final comparison of rates of fore- and hindwing shape and size evolution (σ2) 177
as obtained from the analyses described above to determine the relative evolutionary lability of 178
these four characteristics. Appendix 2 provides an R markdown script of all analyses performed. 179
180 181 RESULTS 182 Morphometrics 183
Forewing measurements for 1,449 specimens representing 60 species and hindwing 184
measurements for 1,404 specimens representing 59 species were analyzed after specimen-level 185
datasets were cleaned. When the datasets were reduced to species for which there were available 186
measurements for at least 10 individuals, 49 species remained in the forewing dataset and 47 in 187
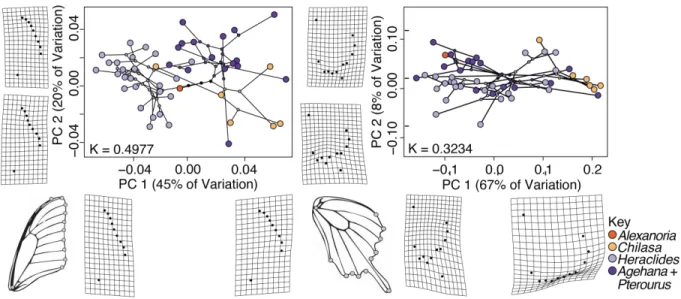
the hindwing dataset. Principal component (PC) 1 of the forewing describes elongation of the 188
wing from the apex to the base, explaining 45% of species’ mean shape variation; PC 2 describes 189
wing margin angularity, explaining 20% of species’ mean shape variation (Fig. 2). PC 1 of the 190
hindwing primarily describes tail length, explaining 67% of variation, while PC 2 describes 191
scalloping of the outer margin, explaining 8% of variation (Fig. 2). 192
Shape does not covary with size consistently for all species in the specimen-level dataset 193
and for all subgenera in the mean species shape dataset (homogeneity of slopes test, P < 0.05), 194
which suggests interspecific allometric effects likely do not play a complicating role in the 195
patterns we examined in this study. However, correlations between log size and shape are 196
significant (P < 0.05), albeit small, for all datasets (forewing specimen-level: R2 = 0.02; 197
hindwing specimen-level: R2 = 0.15; forewing mean shape: R2 = 0.15; hindwing mean shape: R2 198
= 0.21). Summary statistics quantifying intraspecific shape variation (mean Procrustes distance 199
of individuals from mean shape, morphospace volume occupied by each species, mean centroid 200
size, and centroid size variance) can be found in Supplemental Table 2. 201
Independence of Fore- and Hindwing shape
203
Comparative phylogenetic analyses of mean species wing shape indicate a stronger 204
phylogenetic signal in forewing than hindwing shape datasets (Table 2, Fig. 2). The evolutionary 205
rate of the hindwing shape (under an assumption of BM) was also 9 times faster (a statistically 206
significant difference, P < 0.05) than that of the forewing (forewing σ2= 6.6 × 10⁻⁵; hindwing σ2= 207
6.01 × 10⁻⁴). However, despite this disparity in evolutionary rates, fore- and hindwing shapes at 208
the species-level are strongly integrated (rPLS: 0. 75; P < 0.05).
209
210
Independence of Fore- and Hindwing size
211
Comparative phylogenetic analyses of wing centroid size yielded similar patterns. 212
Phylogenetic signal for both fore- and hindwing centroid size is low to moderate (Table 2, 213
Supplemental Fig. 3), but the statistical significance of these estimates is marginal for the 214
forewing and not significant for the hindwing (P = 0.04, P = 0.18, respectively). The OU model 215
fits the forewing dataset best, while the white noise model fits the hindwing dataset best. 216
However, for forewing size, the white noise model was the next-best fit, while for hindwing size, 217
the OU model was the next-best fit (Supplemental Table 4). Therefore, we calculated 218
evolutionary rate based on the OU model for both hindwing and forewing, as this was the best-fit 219
model for both datasets from which evolutionary rate can be calculated (Harmon et al. 2008). 220
Hindwing centroid size evolution is 90 times the forewing rate; this difference is statistically 221
significant (forewing σ2 = 8.4 × 10⁻⁸, hindwing σ2 = 1.1 × 10⁻⁵, P < 0.05). Fore- and hindwing 222
centroid size are mildly but positively and significantly (P < 0.05) correlated (R2 = 0.22; β= 223
3.58). 224
Differences in speed of shape and size evolution
226
Based on our σ2 estimates, hindwing shape is evolving fastest (σ2= 6.01 × 10⁻⁴), 227
followed by forewing shape (σ2 = 6.6 × 10⁻⁵), hindwing size (σ2 = 1.1 × 10⁻⁵), and forewing size 228
(σ2 = 8.4 × 10⁻⁸), in that order (Table 2). Appendix 3 is an R Markdown report of the 229
corresponding results of analytical code supplied in Appendix 2. 230
231
232
DISCUSSION
233
Our results demonstrate that fore- and hindwings are subject to different selective 234
pressures and are evolving autonomously from each other, although there is also evidence of 235
balancing constraint. Notably, phylogenetic signal is stronger in the forewing compared to the 236
hindwing. This pattern is consistent with findings from an early comparative study that 237
demonstrated much higher hindwing shape variation compared to forewings in ithomiine and 238
heliconiine butterflies (Strauss, 1990). Our findings also provide evidence that swallowtail 239
forewing shape and size evolve more slowly than respective hindwing measures, perhaps due to 240
stabilizing selection imposed by dependence on forewings for flight (Jantzen and Eisner 2008). If 241
so, hindwings may be responding more readily to stochastic forces than forewings as the result of 242
factors that can be geographically quite localized and variable (e.g. predation pressure; Barber et 243
al. 2015; Rubin et al. 2018). However, further comparative scrutiny of this trend among 244
butterflies with differing flight behaviors would be beneficial. A recent study in experimental 245
wing reduction in Pierella helvina, a floor-gliding heteriine butterfly, demonstrated enlarged 246
hindwings greatly improved flight performance (Stylman et al. 2019). 247
In contrast to previous studies on bats and ants that found size evolved more quickly than 248
shape (Dzeverin 2008; Pie and Tschá 2013), swallowtails in the clade of interest, shape has 249
evolved at least an order of magnitude more quickly than size in both the hindwing and forewing 250
(Table 2). Indeed, for the full clade of interest as well as both subclades, hindwing shape has the 251
fastest rate of evolution, followed by forewing shape, hindwing size, and forewing size, in that 252
order. This suggests that for butterflies, and in contrast to predictions (Table 1), hindwing shape 253
is the path of least resistance to morphological diversification. This is not to say the evolution of 254
shape and size in the clade is necessarily adaptive — indeed, the difference between hindwing 255
and forewing evolutionary rate ratios for centroid size and wing shape, while dramatic, may also 256
bear the signal of stochasticity in hindwing evolution. Our results should also be interpreted 257
carefully due to a methodological limitation—evolutionary rates for the shape datasets could 258
only be inferred under a BM model using existing methods (Adams and Collyer 2018). If the fit 259
of an OU model could be assessed and was found to be a better fit than BM, it is likely that lower 260
evolutionary rates would be inferred for shape than those found here, as the OU model constrains 261
character evolution around a central location. 262
One of the most labile characteristics of hindwing shape is presence and size of tails, as 263
can be seen examining our hindwing shape deformation grids in relation to PC1 (Fig. 2), which 264
explains 77% of hindwing shape variation. While it is tempting to think of tails as a presence-265
absence trait, there are a wide range of tail shapes and relative sizes compared to the rest of the 266
wing (e.g. Fig. 1), ranging from highly prominent to entirely absent. Tail form lability, visible 267
both in the wide range of tail shapes and sizes and in models of hindwing evolution that appear 268
primarily stochastic, remains understudied. Longer tails have been argued to increase 269
aerodynamic performance for lepidopterans (Park et al. 2010) as well as improving the odds of 270
escaping predators (Barber et al. 2015). However, the tradeoff between costs associated with 271
producing tails versus their benefit requires closer examination, as it is likely dependent on 272
complex interactions among flight behavior characteristics, biotic interactions, and microhabitat. 273
Mimicry may be especially critical as a driver of hindwing shape evolution and tail shape 274
differences. Mimicry selection in Papilio butterflies, often for dramatically different models, 275
appears to have had a profound effect across the clade. This is particularly true for hindwings in 276
swallowtails in the clade of interest, and especially in relation to tail shape because most species 277
with strongly reduced tails (e.g. those species with positive values along PC1) are also mimetic 278
(Supplemental Fig. 4). Overall, 39 of the 60 taxa included in our study have at least one mimetic 279
sex (Supplemental Table 5; Supplemental Fig. 4). Examples of putative Batesian mimic taxa 280
include P. (Pterourus) zagreus, which mimics Heliconius and a number of genera in Danainae 281
(Tyler et al. 1994); P. (Chilasa) clytia, which mimics Euploea (Kunte 2009), and Heraclides of 282
the anchisiades group, which mimics Parides (Srygley and Chai 1990; Tyler et al. 1994). 283
Additional mimetic taxa that were not well-sampled enough to incorporate into our final analyses 284
or were removed because they were strong outliers, such as P. (Chilasa) laglaizei, a mimic of the 285
uraniid moth Alcidis agarthyrsus (Collins and Morris 1985), and P. (Pterourus) euterpinus, a 286
mimic of heliconiine butterflies (Tyler et al. 1994). 287
Our results suggest that for swallowtails, selective pressure for mimicry is a much 288
stronger driver of morphology than shared phylogenetic history. This highlights the importance 289
of predation interactions for the evolution of these lineages. Kunte (2009) demonstrated Papilio 290
butterflies do not appear to have co-evolved with their models, but instead may have adapted to 291
existing models after colonizing new areas. This result is consistent with the findings of studies 292
in other organisms, such as ant-mimic jumping spiders (Ceccarelli and Crozier 2007), coral– 293
snake–mimic colubrid snakes (Rabosky et al. 2016), and army–ant–mimic rove beetles 294
(Maruyama and Parker 2017). None of these groups appear to have co-evolved with their 295
models, but instead may have taken advantage of already-established model patterns. This 296
hypothesis deserves further study by reconstructing the evolution of shape in mimetic Papilio 297
lineages (and outward into the family Papilionidae) and comparing the result to the inferred 298
biogeographic history of these lineages and their putative models. 299
Owing to a preponderance of male and unsexed specimens in our study (and natural 300
history collections in general), we were unable to fully explore differential patterns of wing 301
shape evolution in the context of sexual dimorphism. Previous studies of evolutionary processes 302
related to sex-limited mimicry have not focused on wing shape; instead, studies have diagnosed 303
mimics based on coloration (Kunte, 2009) or examined evolution of key mimicry-relevant genes 304
(Timmermans et al. 2017). Thus, a critical, unanswered question is how different drivers of 305
dimorphism operate across the clade, and we hope that this can be addressed in the future by 306
leveraging our growing database of landmarked Papilio wings. Despite current sample 307
limitations, we were able to examine two species (P. androgeus and P. scamander) for which we 308
had data to make statistically relevant comparisons between male and female specimens. For 309
those two species, we found no evidence of sexual dimorphism in shape or size in forewings or 310
hindwings (script Appendix 3; R Markdown report Appendix 4). 311
In conclusion, our study demonstrates how digitized museum specimens can bridge the 312
gap between taxonomically- and temporally-limited experimental manipulations (e.g. Frankino 313
et al. 2005; Jantzen and Eisner 2008) and broad-scale macroevolutionary hypotheses. We 314
recovered evidence that Papilio forewings and hindwings are evolving independently, which is 315
consistent with experimental observations that fore- and hindwings have different effects on 316
butterfly flight dynamics. Furthermore, hindwing shape may be an evolutionary path of least 317
resistance for morphological diversification in butterflies and may reflect strong disruptive 318
selection for mimicry and/or for predation defense. Still, this study is a first glance at the 319
evolutionary relationships between hindwing and forewing shape and size in insects, and future 320
studies are needed to investigate these patterns more thoroughly within swallowtails and more 321
generally across the insect tree of life. Such work will require detailed information on species' 322
phylogenetic relationships and wing morphologies, as well as factors including mimetic systems, 323
within-species geographic variation, and flight behavior. Fortunately, with the systematic 324
digitization of museum specimens and the increasing capacity of researchers to manage large, 325
complex datasets, the answers to these questions are closer to our reach than ever before. 326
327
SUPPLEMENTARY MATERIAL
328
Data available from the Dryad Digital Repository:
https://datadryad.org/stash/share/Lq-XOj-329 IAFl-PyvNF3Es77l3n4WgsEKE6XrKTjPH7z8 330 331 FUNDING 332
This work was supported by National Science Foundation grant no. DEB 1523732 to H.L.O., 333
DEB 1557007 to A.Y.K. and R.P.G., and an “Investissements d’Avenir” grant managed by 334
Agence Nationale de la Recherche (CEBA, ref. ANR-10-LABX-25-01) to F.L.C. 335
336
ACKNOWLEDGEMENTS
337
We are very grateful to the curators and collections managers that granted us access to their 338
collections in order to image specimens, particularly David Grimaldi, Courtney Richenbacher, 339
and Suzanne Rab Green (AMNH); Crystal Maier (FMNH, now MCZ); Andrew Warren and 340
Laurel Kaminsky (MGCL); and Robert K. Robbins and Brian Harris (NMNH). Laura 341
Brenskelle, Josh Dieringer, Toshita Barve, and Vijay Barve (University of Florida) were 342
instrumental in data collection. Chris Hamilton (University of Idaho) engineered the portable 343
light box used on museum visits. 344
345
REFERENCES
346
Adams, D.C., Collyer, M.L. 2018. Multivariate Phylogenetic Comparative Methods: 347
Evaluations, Comparisons, and Recommendations. Syst. Biol. 67:14–31. 348
Adams, D.C., Felice, R.N. 2014. Assessing trait covariation and morphological integration on 349
phylogenies using evolutionary covariance matrices. PloS One. 9:565-572. 350
Adams, D. C., Otárola-Castillo, E., Paradis, E. 2013. geomorph: An R package for the collection 351
and analysis of geometric morphometric shape data. Methods Ecol. Evol. 4:393–399. 352
Allio, R., Scornavacca, C., Nabholz, B., Clamens, A.L., Sperling, F.A.H., Condamine, F.L. 2020. 353
Whole genome shotgun phylogenomics resolves the pattern and timing of swallowtail 354
butterfly evolution. Syst. Biol. 69:38–60. 355
Bai, Y., Bin Ma, L., Xu, S.-Q., Wang, G.-H. 2015. A geometric morphometric study of the wing 356
shapes of Pieris rapae (Lepidoptera: Pieridae) from the Qinling Mountains and adjacent 357
regions: an environmental and distance-based consideration. Fla. Entomol. 98:162–169. 358
Barber, J.R., Leavell, B.C., Keener, A.L., Breinholt, J.W., Chadwell, B.A., McClure, C.J.W., 359
Hill, G.M., Kawahara, A.Y. 2015. Moth tails divert bat attack: evolution of acoustic 360
deflection. P. Natl. Acad. Sci. USA. 112:2812–2816. 361
Bartoń, K. 2019. MuMIn: Multi-Model Inference. R package version 1.43.6. https://CRAN.R-362
project.org/package=MuMIn 363
Bates, H. W. 1863. The Naturalist on the River Amazons. John Murray, London, UK. 364
Blomberg, S.P., Garland, T., Ives, A.R. 2003. Testing for phylogenetic signal in comparative 365
data: behavioral traits are more labile. Evolution 57:717–745. 366
Cabrera, J.M., Giri, F. 2016. Evomorph: evolutionary morphometric simulation. R package 367
version 0.9. https://cran.r-project.org/web/packages/Evomorph/index.html. 368
Ceccarelli, F.S., Crozier, R.H. 2007. Dynamics of the evolution of Batesian mimicry: molecular 369
phylogenetic analysis of ant-mimicking Myrmarachne (Araneae: Salticidae) species and 370
their ant models. J. Evol. Biol. 20:286–295. 371
Cespedes, A., Penz, C.M., DeVries, P.J. 2015. Cruising the rain forest floor: butterfly wing shape 372
evolution and gliding in ground effect. J. Anim. Ecol. 84:808–816. 373
Chazot, N., Panara, S., Zilbermann, N., Blandin, P., Le Poul, Y., Cornette, R., Elias, M., Debat, 374
V. 2016. Morpho morphometrics: shared ancestry and selection drive the evolution of wing 375
size and shape in Morpho butterflies. Evolution 70:181–194. 376
Collins, N. M., and M. G. Morris. 1985. Threatened Swallowtail Butterflies of the World. IUCN, 377
Gland and Cambridge. 401 pp. 378
Frankino, W.A., Zwaan, B.J., Stern, D.L., Brakefield, P.M. 2005. Natural selection and 379
developmental constraints in the evolution of allometries. Science 307:718-720. 380
Dzeverin, I. 2008. The stasis and possible patterns of selection in evolution of a group of related 381
species from the bat genus Myotis (Chiroptera, Vespertilionidae). J. Mamm. Evol. 15:123– 382
142. 383
Harmon, L.J., Weir, J.T., Brock, C.D., Glor, R.E., Challenger, W. 2008. GEIGER: investigating 384
evolutionary radiations. Bioinformatics 24:129–131. 385
Hill, A., Guralnick, R.P., Smith, A., Sallans, A., Gillespie, R., Denslow, M., Gross, J., Murrell, 386
Z., Conyers, T., Oboyski, P., Ball, J., Thomer, A., Prys-Jones, R., de la Torre, J., Kociolek, 387
P., Fortson, L. 2012. The notes from nature tool for unlocking biodiversity records from 388
museum records through citizen science. ZooKeys 209:219-233. 389
Ives, A.R. 2018. R2s for correlated data: phylogenetic models, LMMs, and GLMMs. Syst. Biol. 390
68:234–251. 391
Ives, A.R., Li, D. 2018. rr2: an R package to calculate R2s for regression models. J. Open Source 392
Softw. 3:1028.
393
Jantzen, B., Eisner, T. 2008. Hindwings are unnecessary for flight but essential for execution of 394
normal evasive flight in Lepidoptera. P. Natl. Acad. Sci. USA 105:16636–16640. 395
Kunte, K. 2009. The diversity and evolution of Batesian mimicry in Papilio swallowtail 396
butterflies. Evolution 63:2707–2716. 397
Lewis, D.S., Sperling, F.A.H., Nakahara, S., Cotton, A.M., Kawahara, A.Y, Condamine, F.L. 398
2015. Role of Caribbean Islands in the diversification and biogeography of Neotropical 399
Heraclides swallowtails. Cladistics 31:291-314.
400
Maruyama, M., Parker, J. 2017. Deep-time convergence in rove beetle symbionts of army ants. 401
Curr. Biol. 27:920–926.
402
Owens, H.L., Lewis, D.S., Dupuis, J.R., Clamens, A.L., Sperling, F.A.H., Kawahara, A.Y., 403
Guralnick, R.P., Condamine, F.L. 2017. The latitudinal diversity gradient in New World 404
swallowtail butterflies is caused by contrasting patterns of out‐ of‐ and into‐ the‐ tropics 405
dispersal. Glob. Ecol. Biogeogr. 26:1447–1458. 406
Park, H., Bae, K., Lee, B., Jeon, W.P., Choi, H. 2010. Aerodynamic performance of a gliding 407
swallowtail butterfly wing model. Exp. Mech. 50:1313–1321. 408
Pie, M.R., Tschá, M.K. 2013. Size and shape in the evolution of ant worker morphology. PeerJ 409
1:e205. 410
Punnett, R.C. 1916. Mimicry in butterflies. Nature 97:237–238. 411
R Core Team. 2012. R: a language and environment for statistical computing. R Foundation for 412
Statistical Computing, Vienna, Austria. 413
Rabosky, A.R.D., Cox, C.L., Rabosky, D.L., Title, P.O., Holmes, I.A., Feldman, A., McGuire, 414
J.A. 2016. Coral snakes predict the evolution of mimicry across New World snakes. Nat. 415
Commun. 7:11484.
416
Revell, L.J. 2012. phytools: an R package for phylogenetic comparative biology (and other 417
things). Methods Ecol. Evol. 3:217–223. 418
Rubin, J.J., Hamilton, C.A., McClure, C.J., Chadwell, B.A., Kawahara, A.Y., Barber, J.R. 2018. 419
The evolution of anti-bat sensory illusions in moths. Sci. Adv. 4:eaar7428. 420
Schluter, D. 1996. Adaptive radiation along genetic lines of least resistance. Evolution 50:1766– 421
1774. 422
Schluter, D. 2000. The Ecology of Adaptive Radiation. Oxford University Press, New York. 423
Scoble, M.J. 1992. The Lepidoptera: form, function and diversity. Oxford University Press, 424
Oxford, UK. 425
Sourakov, A. 2013. Two heads are better than one: false head allows Calycopis cecrops 426
(Lycaenidae) to escape predation by a Jumping Spider, Phidippus pulcherrimus 427
(Salticidae). J. Nat. Hist. 47:1047–1054. 428
Srygley, R.B., Chai, P. 1990. Flight morphology of neotropical butterflies: palatability and 429
distribution of mass to the thorax and abdomen. Oecologia 84:491–499. 430
Strauss, R.E. 1990. Patterns of quantitative variation in lepidopteran wing morphology: the 431
convergent groups Heliconiinae and Ithomiinae. Evolution 44:86–103. 432
Stylman, M., Penz, C.M., and P. DeVries. 2020. Large hind wings enhance gliding performance 433
in ground effect in a neotropical butterfly (Lepidoptera: Nymphalidae). Ann. Entomol. Soc. 434
Am. 113:15–22.
435
Timmermans, M.J.T.N., Thompson, M.J., Collins, S., Vogler, A.P. 2017. Independent evolution 436
of sexual dimorphism and female-limited mimicry in swallowtail butterflies (Papilio 437
dardanus and Paplio phorcas). Mol. Ecol. 26:1273-1284.
438
Tyler, H., Brown, K.S.J., Wilson, K. 1994. Swallowtail butterflies of the Americas. A study in 439
biological dynamics, ecological diversity, biosystematics and conservation. Scientific
440
Publishers, Gainesville, FL, USA. 441
Tung Ho, L.S., Ané, C. 2014. A linear-time algorithm for Gaussian and non-Gaussian trait 442
evolution models. Syst. Biol. 63:397–408. 443
Willmott, K.R., Willmott, J.C.R., Elias, M., Jiggins, C.D.. 2017. Maintaining mimicry diversity: 444
Optimal warning colour patterns differ among microhabitats in Amazonian clearwing 445
butterflies. P. Roy. Soc. B-Biol. Sci. 284:20170744. 446
TABLES
448
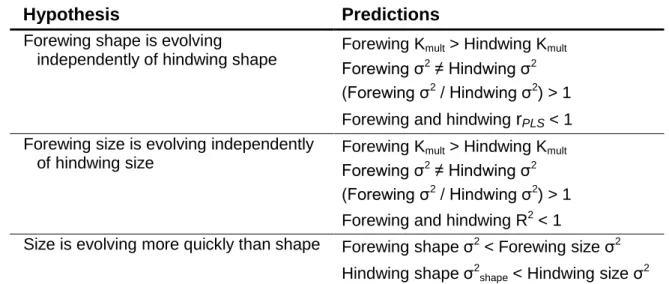
Table 1: Hypotheses examined in this study, with predictions regarding phylogenetic signal
449
and evolutionary rate.
450
Hypothesis Predictions
Forewing shape is evolving
independently of hindwing shape
Forewing Kmult > Hindwing Kmult
Forewing σ2 ≠ Hindwing σ2
(Forewing σ2 / Hindwing σ2) > 1
Forewing and hindwing rPLS < 1
Forewing size is evolving independently of hindwing size
Forewing Kmult > Hindwing Kmult
Forewing σ2 ≠ Hindwing σ2
(Forewing σ2 / Hindwing σ2) > 1
Forewing and hindwing R2 < 1
Size is evolving more quickly than shape Forewing shape σ2 < Forewing size σ2
Hindwing shape σ2
shape < Hindwing size σ2
451
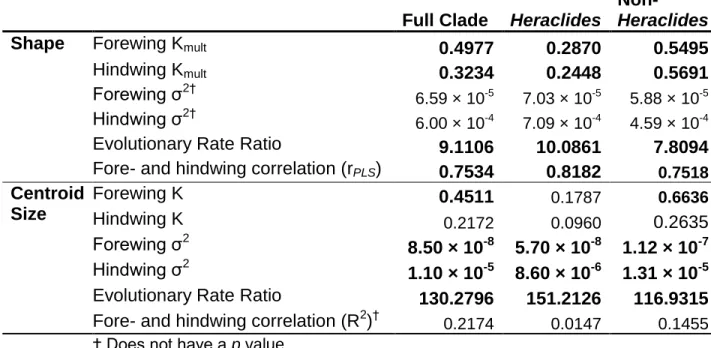
Table 2: Comparative phylogenetics statistics for species-level shape and size. Wing shape
453
generally has more significant phylogenetic signal and evolves more quickly than centroid size; 454
forewing size and shape generally shows stronger phylogenetic signal and evolves more slowly 455
than hindwing size and shape. Full clade: Agehana + Alexanoria + Chilasa + Heraclides + 456
Pterourus; Non-Heraclides: Agehana + Alexanoria + Chilasa + Pterourus. Statistically
457
significant values (p < 0.05) are bolded. 458
Full Clade Heraclides
Non-Heraclides
Shape Forewing Kmult 0.4977 0.2870 0.5495
Hindwing Kmult 0.3234 0.2448 0.5691
Forewing σ2† 6.59 × 10⁻⁵ 7.03 × 10⁻⁵ 5.88 × 10⁻⁵
Hindwing σ2†
6.00 × 10⁻⁴ 7.09 × 10⁻⁴ 4.59 × 10⁻⁴
Evolutionary Rate Ratio 9.1106 10.0861 7.8094 Fore- and hindwing correlation (rPLS) 0.7534 0.8182 0.7518 Centroid Size Forewing K 0.4511 0.1787 0.6636 Hindwing K 0.2172 0.0960 0.2635 Forewing σ2 8.50 × 10⁻⁸ 5.70 × 10⁻⁸ 1.12 × 10⁻⁷ Hindwing σ2 1.10 × 10⁻⁵ 8.60 × 10⁻⁶ 1.31 × 10⁻⁵
Evolutionary Rate Ratio 130.2796 151.2126 116.9315 Fore- and hindwing correlation (R2)† 0.2174 0.0147 0.1455
† Does not have a p value
459
FIGURES
461
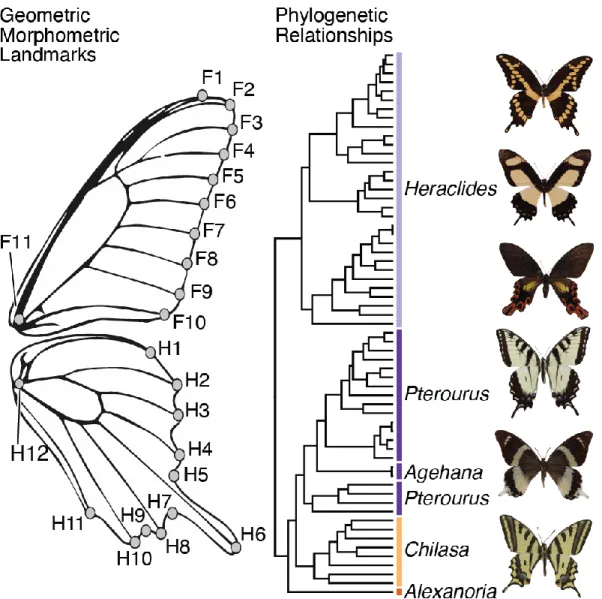
Figure 1. Geometric morphometric landmarks and phylogeny used for analysis. Phylogeny
462
shows non-monophyly of New World swallowtails (Heraclides + Pterourus) and subgenus 463
Pterourus. Shape landmarks, indicated by dots, adapted from Lewis et al. (2015); landmark F1
464
removed from final analysis due to particularly high rate of measurement error. Phylogenetic 465
relationships from Owens et al. (2017) with bars indicating currently recognized subgenera; bar 466
colors correspond with subsequent figure plots. Images depict species corresponding to each 467
labeled clade. 468
Figure 2. Forewing and hindwing phylomorphospace plots; species’ forewing shapes tend
470
to cluster phylogenetically, whereas hindwing shapes do not. Principal components for each
471
dataset were calculated in geomorph; the phylogeny is plotted on top of these, along with 472
inferred node states (under a Brownian motion model—no other models are yet available for this 473
method, Revell 2012), which are color-coded by clade. Warp grid deformations show 474
contributions of principal components 1 and 2 to overall shape. Plots include Blomberg’s K and 475
variance contributions for the first two principal axes of the fore- and hindwing; tips and nodes 476
of phylogeny are color-coded by clade. 477
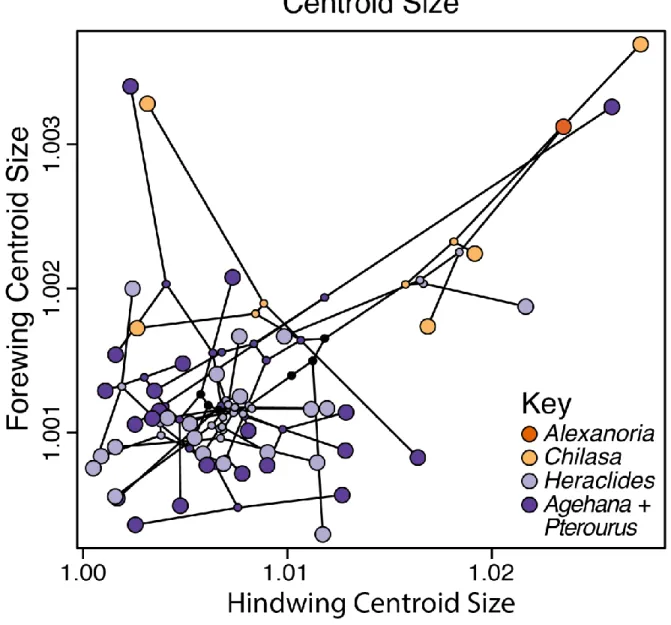
Figure 3. Mean species centroid size in phylomorphospace; Chilasa fore- and hindwing
479
sizes are highly correlated and unique compared to the rest of the clade of interest.
480
Scatterplot shows fore- and hindwing centroid sizes. Black lines indicate phylogenetic 481
relationships; small points at nodes indicate inferred ancestral character values (under a 482
Brownian motion model—no other models are yet available for this method, Revell 2012). Tips 483
and nodes are color-coded by clade. 484