HAL Id: hal-00158342
https://hal.archives-ouvertes.fr/hal-00158342
Submitted on 28 Jun 2007
HAL is a multi-disciplinary open access
archive for the deposit and dissemination of
sci-entific research documents, whether they are
pub-lished or not. The documents may come from
teaching and research institutions in France or
abroad, or from public or private research centers.
L’archive ouverte pluridisciplinaire HAL, est
destinée au dépôt et à la diffusion de documents
scientifiques de niveau recherche, publiés ou non,
émanant des établissements d’enseignement et de
recherche français ou étrangers, des laboratoires
publics ou privés.
On-sky observations with an achromatic hybrid phase
knife coronagraph in the visible
Lyu Abe, Mathilde Beaulieu, Farrokh Vakili, Jean Gay, Jean-Pierre Rivet,
Sebastien Dervaux, Armando Domiciano de Souza
To cite this version:
Lyu Abe, Mathilde Beaulieu, Farrokh Vakili, Jean Gay, Jean-Pierre Rivet, et al.. On-sky observations
with an achromatic hybrid phase knife coronagraph in the visible. Astronomy and Astrophysics
-A&A, EDP Sciences, 2007, 461, pp.365-371. �10.1051/0004-6361:20065150�. �hal-00158342�
hal-00158342, version 1 - 28 Jun 2007
June 28, 2007
On-sky observations with an achromatic hybrid phase knife
coronagraph in the visible
(Research Note)
L. Abe
1, M. Beaulieu
1, F. Vakili
1, J. Gay
2, J.-P. Rivet
3, S. Dervaux
2, and A. Domiciano de Souza
1,21 Laboratoire Universitaire d’Astrophysique de Nice (LUAN), CNRS UMR 6525, Parc Valrose, 06108 Nice Cedex 02, France 2 Laboratoire Gemini, CNRS UMR 6203, Observatoire de la Cˆote d’Azur, B.P. 4229, 06304 Nice cedex 4, France
3 Laboratoire Cassiop´ee, CNRS UMR 6202, Observatoire de la Cˆote d’Azur, B.P. 4229, 06304 Nice cedex 4, France
Received 7 March 2006 / Accepted 11 August 2006
ABSTRACT
Context.The four-quadrant phase mask stellar coronagraph, introduced by D. Rouan et al., is capable of achieving very high dynamical range imaging and was studied in the context of the direct detection of extra-solar planets. Achromatic four-quadrant phase mask is currently being developed for broadband IR applications.
Aims.We report on laboratory and on-sky tests of a prototype coronagraph in the visible. This prototype, the achromatic hybrid phase knife
coronagraph, was derived from the four-quadrant phase mask principle.
Methods. The instrumental setup implementing the coronagraph itself was designed to record the pre- and post-coronagraphic images simultaneously so that an efficient real-time image selection procedure can be performed. We describe the coronagraph and the associated tools that enable robust and repeatable observations. We present an algorithm of image selection that has been tested against the real on-sky data of the binary star HD 80 081 (* 38 Lyn).
Results.Although the observing conditions were poor, the efficiency of the proposed method is proven. From this experiment, we derive procedures that can apply to future focal instruments associating adaptive optics and coronagraphy, targeting high dynamic range imaging in astronomy, such as detecting extra-solar planets.
Key words.Instrumentation: miscellaneous – Methods: data analysis – Atmospheric effects – (Stars:) binaries: general
1. Introduction
The imagery of the faint structures of astronomical objects at high angular resolution (close to the diffraction limit) is a difficult challenge. The current ultimate goal is to directly observe extra-solar planets, whose existence has been unam-biguously confirmed by Mayor & Queloz (1995). Since then, high dynamic range imaging techniques and subsequent instru-mental innovations have triggered the development of ambi-tious ground-based and space-borne projects to reach this chal-lenging exo-planet direct-detection goal. In this context, stel-lar coronagraphy has emerged with the proposal of numerous coronagraphic techniques – e.g. AIC (Gay et al. 1997), phase mask (Roddier et al. 1997), four quadrant and phase knife (Rouan et al. 2000; Abe et al. 2001), binary-shaped masks (Spergel et al. 2001; Vanderbei et al. 2004), pupil apodized Lyot (Aime et al. 2002), two-mirror apodization (Guyon 2003), band-limited coronagraphs (Kuchner et al. 2002) – all capable,
Send offprint requests to: L. Abe, e-mail:
abe@optik.mtk.nao.ac.jp
in theory, of being efficient enough to perform direct detection at the 109 contrast ratio. Nevertheless, further studies led to the conclusion that the main limitations to achieving this per-formance do not come from the high dynamic range imaging concept itself, but rather from all the opto-mechanical environ-ment.
Contrary to the instrument design considerations concern-ing the rejection of undesired scattered-light, the aspect of ob-serving strategies and image analysis/interpretation in coron-agraphy is not taken sufficiently into account. Coronagraphic imaging is a highly non-linear process, resulting in a point-spread-function (PSF) variant by translation. As a conse-quence, interpreting images requires a high level of knowledge of its instrumental environment (where many kind of calibra-tion paths are needed, resulting in a global loss of throughput at the level of the science camera).
The purpose of this paper is twofold. First, we describe a prototype of an achromatic phase knife coronagraph (Abe et al. 2001) and its performance obtained in a laboratory experi-ment. Second, we outline the installation and operating
condi-2 L. Abe et al.: On-sky tests of a phase knife coronagraph (RN)
tions of this coronagraph at the focus of a 50 cm refractor at the Observatoire de Nice (no central obstruction). We describe the image-selection technique and present preliminary on-sky re-sults obtained on the binary star HD 80 081 (* 38 Lyn). Possible ways to use such an instrument at Dome C (Antarctica) as a testbed instrument are also presented.
2. The achromatic hybrid phase mask coronagraph
Following an earlier development, we decided to merge the two concepts of the achromatic phase knife coronagraph (Abe et al. 2001) and the four-quadrant phase mask coronagraph (Rouan et al. 2000), in order to simplify the design of the coronagraphic mask.
2.1. Phase mask design
The phase mask is an assembly of phase plates of equal thick-ness but different optical refraction indices. Instead of using four separate plates, we used a combination of two crossed pairs, each one called a phase knife (Abe et al. 2001). The combination of indices (n1(λ) and n2(λ)) and glass thickness (e1= e2= 99 µm) are optimized to obtain a theoretical nulling effect of ∼ 104over a spectral band ranging from λ = 450 nm to 620 nm. The two orthogonal pairs of phase knives are held together between two identical glass blocks (see Fig. 1-a). This optical design solution was chosen to circumvent the difficult operation of shaping and assembling four independent quad-rants.
Consider a light beam propagating through one phase knife. The light passing through the left part of it will be phase-delayed by the quantity:
ϕ1(λ) =
2πe1n1(λ)
λ , (1)
and the second half of the wave will be phase-delayed by: ϕ2(λ) =
2πe2n2(λ)
λ . (2)
For the sake of manufacturing and assembling simplicity, we impose e1 = e2 = e. Therefore, the relative phase-shift as a function of wavelength is given by:
∆ϕ1,2(λ) =
2πe(n1(λ) − n2(λ))
λ . (3)
Figure 1-b shows the expected relative phase-shift error (∆ϕ1,2 −π)/π as a function of λ, computed for the chosen glass combination: BaF4 and BaF52. The expected theoreti-cal nulling effect of ∼ 104 requires that the differential glass thickness δe be at most 2 nm (≈ λ/300).
2.2. Phase-mask fabrication
The two glass plates were first polished and molecularly bound to one of the polished glass blocks. The glass plates were thick enough to prevent them from breaking while being manipu-lated. Once bounded, the two plates were thinned to the speci-fied thickness and then polished. As mentioned previously, the
(a) 450 500 550 600 650 λ (nm) -0.06 -0.04 -0.02 0.00 0.02 0.04 π -shift error (1.0 is π ) (b)
Fig. 1. (a): The optical assembly of the APKC component: two 99 µm phase knives are stacked between two 6 mm thick glass plates. The light propagates along the Z axis. (b): The relative error on the π phase-shift over the considered spectral band-width.
differential thickness between the two plates should be less than a few nanometers, which is not guaranteed by the present man-ufacturer. A similar assembly technique was used for the sec-ond half of the coronagraphic mask.
The interface (edge contact) between the two glass plates is not well-defined and could be subject to humidity infiltra-tion. We thus chose to perform a V-shaped bevel at the plates interface and to use an optical contact oil to seal it off once the component is assembled. The two separate blocks were then assembled together using molecular bound. Finally, a UV-glue was used to coat the component, holding the two parts together, ensuring a solid assembly.
3. Laboratory tests
3.1. Laboratory tests of the phase-mask
Although the component assembly was largely simplified us-ing the method described above, laboratory tests show that the molecular bound between different glass indices may not be the optimal solution. The left side of Figure 2 shows the corona-graphic pupil image obtained with the prototype. We identified a strong error on the predicted π phase-shift for one phase knife, indicating that the molecular bound probably did not hold (e.g. due to temperature fluctuations). This effect might also be due
Fig. 2. Coronagraphic pupil images. Left: laboratory experi-ment. The dashed circle represents the Lyot stop that is used for on-sky observations (see Section 4.2). Right: numerically simulated. We introduced suspected phase-shift defects to sim-ulate the pupil intensity distribution (thresholded images to ex-hibit the intensity distribution structures).
to the polishing of the two glass plates, which was not precise enough (thickness difference). This phase-shift error can be re-produced by a numerical simulation (right side of Figure 2) where we introduced an error of ∼ 10 % on the phase shift in one direction.
Another shortcoming of the coronagraph is shown in Figure 3. It turns out that the optical sealing oil has created some bubbles that affect the regularity of the interface of the phase-knives edge. It produces unwanted effects, especially at the center (see arrows in Figure 3). The typical size of these irregularities is on the order of a few tens of microns and is comparable to the size of the diffraction pattern. This is proba-bly the main reason the raw performance of the coronagraph is not as good as predicted by the theory. The effect of these un-desirable structures after assembling remains unclear, although one can reasonably speculate that their diffraction effect in the coronagraphic pupil is negligible compared to the expected tur-bulence degradation for on-sky observations.
3.2. Laboratory rejection measurements
The coronagraphic bench was first qualified in laboratory prior to on-sky tests, under the same optical conditions (defined F/D = 30 ratio). The tests were made using an HeNe laser source (632.8 nm). Due to the defect near the center mentioned in Section 3, the nulling effect is less than theoretically ex-pected (a few tens of thousand extinction according to numer-ical models). The rejection measuring procedure involves cali-brated optical densities (Abe et al. 2003) to measure the flux for the source on- and off-axis. This gave a peak-to-peak intensity ratio of ∼ 1000 (Figure 4) for the nulling performance.
4. Prior to on-sky tests
For on-sky observations, the coronagraph has been installed at the focus of the 50 cm refractor of the Observatoire de Nice, with F = 7.5 m (F/D = 15). However, an additional 25 cm aperture diaphragm turned out to be necessary, since we did
Fig. 3. Image of the coronagraphic mask illuminated by a diffuse white light source. Black arrows point toward defects (bubbles) produced by an optical oil used to avoid humidity in-filtration. At the cross intersection, a faint defect is affecting the coronagraphic performance by modifying the image inten-sity distribution (see Fig. 4-bottom right).
Fig. 4. Top-left: the 3D representation of the non coronagraphic PSF with a linear intensity scale. Bottom-left: the 3D repre-sentation of the coronagraphic PSF, normalized to the non-coronagraphic image peak intensity. Top- and bottom-right: the corresponding 2D images, but with two different photometric scales, so that the coronagraphic image is visible. The peak-to-peak intensity ratio is ∼ 1000.
not have any real-time turbulence correction system such as an adaptive optics system or even a tip-tilt mirror.
The refractor objective lens is an achromatic doublet opti-mized for the 560 nm wavelength. In our case, the advantage of having no central obstruction had a counterpart: a residual chromatism strong enough to hamper the image focus on the coronagraphic mask. Its effect on the coronagraphic rejection was then evaluated numerically.
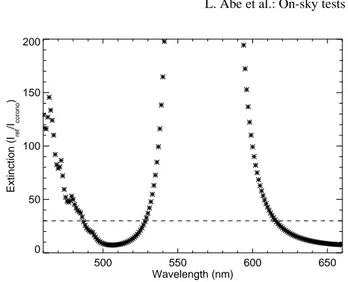
4 L. Abe et al.: On-sky tests of a phase knife coronagraph (RN) 500 550 600 650 Wavelength (nm) 0 50 100 150 200 Extinction (I ref /Icorono )
Fig. 5. Curve showing the wavelength-dependent extinction (max(Ireference)/ max(Icoronagraph)) (stars) due to the refractor fo-cus chromatism and the extinction limit (dashed line) for the whole spectrum (polychromatic coronagraphic image), which only reaches ∼ 30. The vertical scale has been truncated (be-cause the pure performance would be limited by the component itself to approximately 1000). A spectral filter would clearly increase the extinction limit potential between 550 nm and 590 nm.
4.1. Numerical model for the refractor’s residual chromatism effect
The graphs in Figure 5 are derived from a numerical simulation made with the main characteristics of the refractor. It expresses the extinction performance at each wavelength. The cumulated extinction is also given, while integrating the images over the whole spectral bandwidth. Although the overall broadband ex-tinction ratio performance is far from optimal (up to only ∼ 30), we carried out a complete on-sky test under these conditions, essentially to match the predicted observing parameters against real observing conditions.
4.2. Optical set-up for on-sky tests
Figure 6 shows the coronagraphic optical bench designed to be fitted to the bonnette of the 50 cm refractor. A beam-splitter reflects 20 % of the converging beam coming from the refrac-tor onto a monirefrac-toring camera (a SONY XC-EI50 CCD cam-era with 768×494 8.4×9.8 µm pixels) The remaining 80 % are transmitted through the coronagraph to the science camera (a SONY XC-HR8500CE CCD camera with 768×574 8.3 µm square pixels, out of frame in Figure 6). Both cameras de-liver standard CCIR video signals. An astigmatism aberration is introduced by this beam-splitter. However, the phase mask is not sensitive to it (Abe 2002) so that the coronagraphic per-formance should not be degraded. The phase mask component is placed at the focus of the refractor. A relay lens re-images both the primary focal plane (onto the science camera’s detec-tor with a magnification of 1) and the pupil plane. At this re-layed pupil plane, an iris diaphragm (Lyot stop) with a diameter 20 % smaller than the geometric image of the entrance pupil is
Fig. 6. Coronagraphic optical bench (see text for details). The refractor’s bonnette is out of frame on the right side, and the science camera is out of frame on the left side. The light prop-agates from right to left.
placed to eliminate the light diffracted out of the geometrical pupil (see Fig. 2).
4.3. Acquisition software
The acquisition software was written in C++ with a graphical user interface (GUI). It drives a dual channel acquisition board that accepts two standard CCIR signals with independent grab-bers. The software handles the simultaneous acquisitions from both cameras in real time with a multi-threaded architecture. Several indicators can be optionally toggled in order to facili-tate the fine tuning of the experiment. There are two available modes:
– A continuous recording of all the images in RAM memory: in this mode, images from both cameras are recorded and saved in memory, up to a capacity of 1.5 GB. This mode is useful for dark and flat recordings, or to assess the atmo-spheric turbulence conditions (image motion for example). – An automatic image-selection mode: the user sets a thresh-old that has to be first calibrated (see below). In this mode, memory is saved because only “best” images are kept, so that the exposure length can be greatly optimized. The se-lection criteria are based on flux considerations during the acquisition, although the post-acquisition image selection was different (which will also be implemented in future ex-periments).
In both modes, the millisecond timing of all acquired im-ages are recorded in separate text files in order to keep track of image-arrival timing and avoid synchronization errors during image analysis.
Optionally, the software can send external correction com-mands to the refractor guiding system, in order to keep the star centered on the coronagraph axis. The frequency of correction mainly compensates for slow drifts (∼ 1 Hz).
5. Observing procedure
Prior to the observations, the optical components were aligned to the bench’s mechanical axis in laboratory, so only minor fine tuning is necessary once it is plugged in to the refractor. The focal mask and the Lyot stop longitudinal positions were tuned before starting observations. The most effective phase mask po-sition is found while monitoring the pupil image. The resulting position is coherent with the focus position estimated using the Foucault method, corrected from the focus shift introduced by the 6 mm glass plate of the phase mask (Figure 1).
5.1. The image-selection process
In this section, we propose an algorithm for image selection to reduce the speckle noise in the coronagraphic image, and thus to improve the signal to noise ratio for a companion detection.
5.1.1. The speckle noise
We call “speckle noise” the random speckle pattern due to dis-torted and/or tip-tilted wave-fronts. These random structures become a noise source when the exposure time is not long enough to smoothe them in a uniform halo. Unfortunately, the wavefront distortions induced either by atmospheric turbulence and/or by instrumental aberrations do not generally smoothe out, since they may have long time-scale variations (Marois et al. 2003b). These residual speckles are the major limitations to the identification of the science target signal, especially in the point-like source detection context (companion detection) since speckles have the same size as the diffraction pattern. The removal of such structures can be achieved by differential tech-niques, but even in this case, residual differential defects might still exist. The latter is discussed in several papers (Racine et al. 1999; Marois et al. 2003a; Marois et al. 2004). Since the speckled halo is partly correlated to the non aberrated diffrac-tion pattern (Bloemhof 2004; Aime et al. 2004), its contribudiffrac-tion can be diminished by the use of a coronagraph.
In this context, image selection coupled to coronagraphy can be a useful method of increasing the detection limit since the speckle pattern will have a lower intensity due to the coron-agraphic attenuation, which is kept under a fixed level (because of selection constraints) and therefore contributes to a lower speckle variance at a given distance from the optical axis (see Racine et al. 1999, Eq. 11b).
5.1.2. The image-selection algorithm
The image-selection process involves only the monitoring cam-era images, instead of relying on flux considcam-erations from the science camera (coronagraphic) image. It works as follows. From each monitoring camera image, we compute the distance from the photometric center1 of the object to a pre-computed operation point (OP). When this distance exceeds a carefully
1 Standard centroid determination algorithms can be applied with
a high level of confidence, especially when the stellar companion is faint enough to be invisible on individual snapshots.
chosen threshold, the corresponding coronagraphic image from the science camera is rejected. The remaining images are co-added to produce the “long-exposure” coronagraphic image.
The OP has to be assessed accurately before each obser-vation run by recording 5000 frames from both the monitor-ing and science cameras. First, a “long-exposure” image is ob-tained by co-adding all the 5000 science-camera frames. In the resulting image, the cross pattern of the phase mask is clearly visible, and the optical center of the coronagraphic image can be marked unambiguously.
Since the precise image selection procedure is not per-formed during the observation itself, the OP on the monitoring camera is set according to its correlation with the images from the science-camera having the highest extinction ratio. For the post-data analysis, a refined determination of this correlation is performed. To further improve the robustness of the proposed method, an internal (stable) calibration source should be used to accurately set the OP and even to allow precise image selec-tion in real-time. In the present work, the determinaselec-tion of the OP position could only be set on a pixel scale basis (with an image selection radius of 0.5 pix at best).
6. Application to observation data
On the nights of observations, the atmospheric conditions could not be considered as optimal. Despite rapid seeing variations, presumably due to fast high-altitude winds, a coherent peak was almost always present in every short exposure. Diffusion from high-altitude clouds was also perceptible, with a notice-able effect (halo) on the stacked images (see below).
6.1. Observation of HD 80 081 (binary star)
The data under consideration in this article were obtained on March 3, 2004. The target we chose for this test of methodol-ogy was HD 80 081, a binary star with a primary magnitude V1 = 3.9, secondary magnitude V2= 6.6 (∆V = 2.7), and sep-aration 2.7′′. The orientation on the sky of the secondary
com-ponent was known, and the coronagraph was oriented so that it didn’t focus on a “blind area” of the phase mask (i.e. ∼ 45◦ rel-ative to the mask axis). Indeed, investigating the unknown mor-phology and complexity of a target is hampered by the “blind areas” of the four quadrant phase mask, adding a real difficulty to data analysis. Note that the secondary component was not visible in single science-camera snapshots, due to the read-out noise (S/N less than unity), and was hardly visible with the monitoring camera. As already mentioned, no real-time guid-ing correction was active on the refractor, so that the image selection post-processing became mandatory. For comparison, Figure 7 shows the monitor camera exposure and the corre-sponding coronagraphic image. Image generation and analysis are detailed in the following paragraphs.
6.2. Data cube analysis
We performed the image selection procedure described in Sect. 5.1, with increasing values of the distance threshold and
6 L. Abe et al.: On-sky tests of a phase knife coronagraph (RN)
(a) (b)
Fig. 7. On-sky data of HD 80 081. (a): without the corona-graph (monitoring camera), (b): with the coronacorona-graph (science camera). This image was obtained by co-adding 126 frames se-lected among the 5000 recorded frames, using the selection al-gorithm described in Sect. 6.2. The companion appears clearly in the coronagraphic image.
thus increasing numbers of retained frames. Figure 9 displays the resulting coronagraphic images.
In order to check the efficiency of the proposed selection method, we compared the peak intensity of the HD 80 081 secondary component with the peak intensity of the brightest residual speckle (Figure 8-b). This ratio of intensity is plotted as a function of the selection threshold in Figure 8-a. This il-lustrates the gain provided by the selection method which over-comes two effects:
– the apparition of bright speckles due to unconstrained tip-tilt jitters that move the primary star’s image out of the coronagraphic rejection zone;
– the flux dilution of the target peak intensity that tends to lower the difference between the target peak and the resid-ual bright speckles mentioned above.
These effects are clearly visible in the Figure 9 images, where in the last long exposure (almost all frames are inte-grated), the companion of HD 80 081 cannot be disentangled from the coronagraphic image halo with the additional confu-sion that another bright speckle, symmetric to the HD 80 081 companion position has appeared.
The peak-to-peak intensity ratio between the coronagraphic and direct image was measured to approximately 30, which is consistent with the numerical estimate mentioned in Sect. 4.1 (see Figure 5).
6.3. Data consistency checks
To complete the data reduction, we also checked the result con-sistency with the long exposure image. Figure 10 shows several radial profiles for exposure (b) of Figure 9 with 126 selected frames and a selection radius of 0.7 pixels:
– the radial median profile of the non-coronagraphic monitor image (solid curve);
companion speckle
(a)
0 2 4 6 8
Distance threshold for selection (pixels) 0 1 2 3 4 5 Intensity ratio (b)
Fig. 8. (a): The final coronagraphic image showing the bright-est residual speckle of HD 80 081 (emphasized by a white circle surrounding it) and the clearly visible companion of HD 80 081. (b): The intensity ratio between HD 80 081’s com-panion and the brightest residual speckle after coronagraphy, as a function of the distance threshold in the image selection process (see Sect. 5.1.2).
– the average profile of the the monitor image along the di-rection of the off-axis companion2(dash-dotted curve); – the same with the coronagraphic image (dotted curve); – the radial median profile of the coronagraphic image
(dashed curve);
– the sum of solid and dotted curves (light grey curve), which is consistent with the dash-dotted curve.
This comparison allows us to confidently conclude that our coronagraphic data are consistent and that the bright speckle is the companion of HD 80 081. These results clearly show that the central star PSF halo has been attenuated and that the star is not simply masked by the coronagraphic mask. If there were no coronagraphic effect, then the intensity distribution at the companion location would be similar to the dash-dotted curve. The attenuation factor at the companion location (∼ 6λ/D) is ≈8, while it reaches ∼ 10 closer to the optical axis (∼ 4λ/D), where the theoretical transmission of the four quadrant phase mask is ≈ 90%.
2 we averaged the radial profiles within a small sector containing
(a) (b) (c)
(d) (e) (f)
Fig. 9. Coronagraphic images generated with increasing values of the selection distance threshold η (in pixels and in units of
λ/D) and thus with an increasing number of retained frames. The residual speckles become brighter, thus reducing the companion detection S/N. (a): η = 0.5 px = 0.25 λ/D (∼ 80 frames); (b): η = 0.7 px = 0.35 λ/D (∼ 130 frames); (c): η = 1.0 px = 0.5 λ/D (∼ 250 frames); (d): η = 2.0 px = 1.0 λ/D (∼ 900 frames); (e): η = 4.0 px = 2 λ/D (∼ 2750 frames); (f): η = 8.0 px = 4 λ/D (∼ 4500 frames).
0 10 20 30
Off-axis distance (λ/D units) 0.0001
0.0010 0.0100 0.1000 1.0000
Relative intensity (Log
10
scale)
Fig. 10. Comparison of image profiles derived from exposure (b) of Figure 9. See text for details.
7. Conclusion and future prospects
We have presented the first on-sky results of a visible achro-matic hybrid phase knife coronagraph. The extinction perfor-mances, limited by the refractor’s residual chromatism and thus modest, were found to agree with the numerically predicted value (∼ 30).
We demonstrated on real data the efficiency of the image selection algorithm we propose in order to increase the signal to noise ratio and ease the detection of faint companions. The selection method provides an efficient way to extract the scien-tific information by preventing bright speckles from appearing and confusing to the image interpretation.
This encouraging experiment is now envisaged for a test in-strument at Dome C (Antarctica). The inin-strument is expected to benefit from diffraction-limited images while the current im-age selection system is being implemented. Furthermore, we plan to combine this optical system with a speed, high-efficiency photon-counting camera that is under construction at the “Laboratoire Universitaire d’Astrophysique de Nice” (LUAN). We will therefore benefit from quasi-absent readout
8 L. Abe et al.: On-sky tests of a phase knife coronagraph (RN)
noise and good temporal sampling of the atmospheric turbu-lence. The host instrument will be a 14-inch C14 telescope with a modified entrance pupil (Lloyd et al. 2003) in order to keep a maximal coronagraphic performance despite the central ob-scuration (with a lower transmission).
In addition to this gain in transparency, seeing conditions and chromatism reduction (due to the use of a reflector), this new device at Dome C will allow long integration periods dur-ing the polar night. This mission is also a test experiment af-ter the success of smaller optical instruments already tested at Dome C for monitoring the seeing (Aristidi et al. 2003).
Acknowledgements. The authors would like to thank G´erard GREISS
(SEOP, France) for manufacturing the achromatic phase mask, Alex ROBINI from LUAN who manufactured most of the mechanical parts, and OCA and ASHRA for supporting the experiment. Lyu ABE is grateful to the CNES for its support during his postdoctoral fellow-ship. This prototyping experiment was supported by a special grant from the scientific council of the Observatoire de la Cˆote d’Azur.
References
Abe, L. June 2002, PhD thesis, (http://www-astro.unice.fr/∼abe/,
Publications section)
Abe, L., Boccaletti, A., & Vakili, F. 2001, A&A, 374, 1161
Abe, L., Domiciano de Souza, A., Vakili, F. & Gay, J. 2003, A&A, 400, 385
Aime, C., & Soummer, R. 2004, ApJ, 612, L85
Aime, C., Soummer, R., & Ferrari, A. 2002, A&A, 389, 334 Aristidi, E., Agabi, K., Vernin, J., et al. 2003, A&A, 406, L19 Bloemhof, E.E. 2004, ApJ, 610, L69
Carbillet, M., Fini, L., Femen´ıa, B., et al. 2001, Astronomical Data Analysis Software and Systems X, in ASP Conference Proceedings, vol. 238, 249
Fini, L., Carbillet, M., & Riccardi, A. 2001, A&A, 238, 253 Gay, J., & Rabbia, Y. 1997, C. R. Acad. Sci. Paris, S´erie II, 332, 265 Guyon, O. 2003, A&AS, 404, 379
Kuchner, M.J. & Traub, W. 2002, ApJ, 570, 900
Lloyd, J. P., Gavel, D. T., Graham, J. R., et al. 2003, in SPIE proceed-ings, vol. 4860, 171
Marois, C., Doyon, R., Nadeau, D., et al. 2003, in SPIE proceedings, vol. 4860, 130
Marois, C., Doyon, R., Nadeau, D., et al. 2003, in EAS Publications Series, vol. 8, 2003, proceedings of the conference Astronomy with High Contrast Imaging, Nice (France), 13-16 May 2002, Eds. C. Aime & R. Soummer, 233.
Marois, C., Racine, R., Doyon, R., et al. 2004, ApJ, 615, L61 Mayor, M., & Queloz, D. 1995, Nature, 378, 355
Racine, R., Walker, G., Nadeau, D., et al. 1999, PASP, 111, 587 Roddier, F. & Roddier, C. 1997, PASP, 109, 815
Rouan, D., Riaud, P., Boccaletti, A., et al. 2000, PASP, 112, 1479 Soummer, R., Aime, C. & Fallon, P. 2003, A&A, 397, 1161
Spergel, D., & Kasdin, J. 2001, in the proceedings of the 99th AAS Meeting, n86.03, vol. 33, 1431
Vanderbei, R., Kasdin, J., & Spergel, D. 2004, ApJ, 615, 555
List of Objects