Publisher’s version / Version de l'éditeur:
Vous avez des questions? Nous pouvons vous aider. Pour communiquer directement avec un auteur, consultez la première page de la revue dans laquelle son article a été publié afin de trouver ses coordonnées. Si vous n’arrivez pas à les repérer, communiquez avec nous à PublicationsArchive-ArchivesPublications@nrc-cnrc.gc.ca.
Questions? Contact the NRC Publications Archive team at
PublicationsArchive-ArchivesPublications@nrc-cnrc.gc.ca. If you wish to email the authors directly, please see the first page of the publication for their contact information.
https://publications-cnrc.canada.ca/fra/droits
L’accès à ce site Web et l’utilisation de son contenu sont assujettis aux conditions présentées dans le site LISEZ CES CONDITIONS ATTENTIVEMENT AVANT D’UTILISER CE SITE WEB.
12th International Congress on the Chemistry of Cement [Proceedings], pp. 1-17, 2007-07-08
READ THESE TERMS AND CONDITIONS CAREFULLY BEFORE USING THIS WEBSITE. https://nrc-publications.canada.ca/eng/copyright
NRC Publications Archive Record / Notice des Archives des publications du CNRC :
https://nrc-publications.canada.ca/eng/view/object/?id=6ad50669-3e97-4c1d-bf15-0a47f0b5561e https://publications-cnrc.canada.ca/fra/voir/objet/?id=6ad50669-3e97-4c1d-bf15-0a47f0b5561e
NRC Publications Archive
Archives des publications du CNRC
This publication could be one of several versions: author’s original, accepted manuscript or the publisher’s version. / La version de cette publication peut être l’une des suivantes : la version prépublication de l’auteur, la version acceptée du manuscrit ou la version de l’éditeur.
Access and use of this website and the material on it are subject to the Terms and Conditions set forth at Synthesis and characterisation of lithium and sodium doped C-S-H Mitchell, L. D.; Margeson, J. C.; Beaudoin, J. J.
http://irc.nrc-cnrc.gc.ca
S y n t h e s i s a n d c h a r a c t e r i s a t i o n o f l i t h i u m a n d
s o d i u m d o p e d C - S - H
N R C C - 5 0 0 7 7
M i t c h e l l , L . D . ; M a r g e s o n , J . C . ; B e a u d o i n , J . J .
A version of this document is published in / Une version de ce document se trouve dans: 12th International Congress on the Chemistry of Cement, Montreal, July 8-13, 2007, pp. 1-17
The material in this document is covered by the provisions of the Copyright Act, by Canadian laws, policies, regulations and international agreements. Such provisions serve to identify the information source and, in specific instances, to prohibit reproduction of materials without written permission. For more information visit http://laws.justice.gc.ca/en/showtdm/cs/C-42
Les renseignements dans ce document sont protégés par la Loi sur le droit d'auteur, par les lois, les politiques et les règlements du Canada et des accords internationaux. Ces dispositions permettent d'identifier la source de l'information et, dans certains cas, d'interdire la copie de documents sans permission écrite. Pour obtenir de plus amples renseignements : http://lois.justice.gc.ca/fr/showtdm/cs/C-42
Synthesis and Characterisation of Lithium and Sodium Doped C-S-H
By
L.D. Mitchell, J.C. Margeson & J.J. Beaudoin
National Research Council Canada 1200 Montreal Road, Ottawa Canada
1.0 Abstract
Pure and doped calcium silicate hydrates (C-S-H) were synthesised and characterised. Pure preparations with calcium to silica (C/S) ratios ranging from 0.6 to 2.0 were made. Doped preparations with C/S ratios of 1.0 and 1.7 were synthesised with one molar lithium and sodium hydroxide solutions. Each preparation was characterised using Nuclear Magnetic Resonance (NMR), X-ray Diffraction (XRD), Fourier Transform InfraRed (FTIR) spectroscopy, and Scanning Electron Microscopy (SEM). As expected, results for the pure control C-S-H preparations largely agreed with published literature. The lithium and sodium doped preparations both contain residual Ca(OH)2, indicating that their final C/S ratio is not equal to
that of the starting materials. The lithium-doped material at low C/S ratio (1.0) exhibits chemical and structural behaviour more consistent with a pure C-S-H having a higher C/S ratio (1.7). Sodium doped C-S-H exhibited characteristics consistent with that of the purer control preparations.
2.0 Introduction
The structure and properties of calcium silicate hydrate (C-S-H), typically found in hydrated Portland cement products, has been the subject of considerable research for decades T1T. C-S-H is considered to be the main binding and strength-providing phase and has generated much scientific interest. However due too its poorly crystalline state understanding its properties and structure has been elusive. T2T
The C-S-H system is highly complex, and is comprised of crystalline, semi-crystalline and gel structures, with widely varying compositionT1T. The synthesis and characterization of C-S-H phases can consequently be subject to many interpretive challenges. There are numerous proposed structural models for C-S-H, many of which involve some kind of layered structure. Structural details such as how the layers are connected, and the nature of the chemistry between the interlayer spaces has yet to be fully resolved. The thermodynamic and structural properties of C-S-H are also not well defined, and often lack precision.
Scientists have classified the different types of C-S-H based on morphology and chemical analysis to compensate for this lack of structural
knowledge. For example Taylor classified H as H(I) and C-S-H(II) based on systematic studies of hydrated C3S and material
precipitated from aqueous solutionT1T. He concluded that a Ca:Si ratio below 1.5 was characteristic of C-S-H(I), while those with a Ca:Si > 1.5 were C-S-H(II)T3T. It is generally accepted that in fully hydrated Portland cement the Ca:Si ratio ranges from 1.5 to 2.0. A thorough review of the literature addressing this subject can be found elsewhere T4T. Two of the most promising structural models for C-S-H are based on the tobermorite T5T and jennite structures T6,7T. Cong and Kirkpatrick based on their 29Si MAS NMR studies advanced a defect –tobermorite structural model for C-S-H T8T
There is at present, considerable international interest in the use of lithium compounds for mitigating alkali silica reaction (ASR). Many of these compounds appear to be effective only at high dosage, most likely due to the high absorption of lithium by the C-S-H. The role of lithium and the mechanisms by which it mitigates ASR is the subject of much current research. Equally the effect of lithium adsorption on the C-S-H itself has not been researched. For example the effects of lithium interacting with C-S-H phases and volume stability has not been determined.
This study was designed to examine the effects of dopants upon the structure of C-S-H. Lithium hydroxide, and sodium hydroxide were chosen as preliminary additives. Both lithium and sodium are involved in the ASR process when lithium-based inhibitors are employed. Compositions between lithium and sodium-doped C-S-H are justified in this context. Metal hydroxide ions are a principle cause of alkali silica reaction, and have been extensively studied in conjunction with pozzolans, to mitigate this type of concrete corrosion T9-11T. Lithium salts are currently promoted as measures to mitigate alkali silica reaction T12,13T. McCoy and Caldwell T14T showed that the lithium concentration and the lithium cation had a profound effect on the reduction of expansion in cement systems subject to alkali silica reaction. Lithium salts appear to react with silica to form a lithium containing gel product; this gel appears to alleviate expansive behaviour in mortar bars T15T.
Several factors dictate the occurrence of ASR, including the pH and the availability of silica and water. Why lithium can be used to mitigate ASR is however, a subject of much debate.
Stade T16T studied alkali hydroxides, including lithium, and found that C-S-H incorporates NaOC-S-H and KOC-S-H in roughly equal amounts. C-S-However LiOC-S-H is incorporated to a much greater extent. He also determined that C-S-H’s with lower C/S ratios incorporate larger amounts of alkali hydroxides. Stade speculated that alkali hydroxides react with monomeric
SiOH-groups at the inner surface of the interlayer, and that at higher concentrations of alkali hydroxides a M+ - Ca2+ exchange may occur.
A search of silicate-based materials in the Inorganic Crystal Structure Database (ICSD) noted that lithium occupies a 4 coordinate tetrahedral or occasionally a 6 co-ordinate octahedral site. Sodium is not found in tetrahedral coordination and in silicates it is normally 5 coordinate or higher. Potassium is an even larger ion than sodium, so again will rarely occupy the same sites as lithium. Hence a plausible case for a difference in behaviour between lithium and the other alkali metal ions may be made purely on structural grounds. This, perhaps circumstantial evidence, supports the idea that lithium-containing gels could behave differently to those containing either sodium or potassium.
3.0 Experimental
Synthetic C-S-H preparations (different C/S ratios and dopants) were prepared in the laboratory and studied using a variety of techniques including Nuclear Magnetic Resonance (NMR), X-ray Diffraction (XRD), Fourier Transform InfraRed (FTIR) spectroscopy, and Scanning Electron Microscopy (SEM).
Calcium silicate hydrate was made by reacting freshly calcined reagent grade CaCO3 and high surface area amorphous SiO2 (Cabosil). The
powders were weighed in stoichiometric proportions and mixed with excess deionized, deaerated water in an effort to prevent carbonation. Exposure during reaction and of the final product to CO2 was avoided by
keeping both the reaction materials and the final product in air-tight containers, that were purged with N2 gas.
Stoichiometric mixtures were made as follows Target C:S
Molar Ratio CaO (g) SiO2 (g)
Actual Molar Ratio 0.6 16.833 30.001 0.60 0.8 22.458 29.996 0.80 1.0 28.058 30.043 1.00 1.2 33.659 30.006 1.20 1.5 41.99 29.853 1.51 1.7 47.636 29.981 1.70 2.0 55.974 30.002 2.00 3.0 84.097 30.001 3.00
3.1 Preparation of Raw Materials
Commercial high purity CaCO3 (99.9 %) was heated at 900°C for 18h. The
resulting CaO was cooled in a desiccator under vacuum. The desiccator was purged with N2 gas, and the CaO stored in the desiccator until use.
Amorphous silica, Cabosil, was heated at 110°C for 3 hours to thoroughly dry the material.
All mixes were prepared dry in 1-litre high-density polyethylene (HDPE) bottles. The HDPE bottles for each mix system were N2 purged to remove
CO2 and then placed on a rotating wheel that turned the bottles end over
end at a rate of 9 rpm. The system was allowed to react for 10 weeks, (70 days) at which time two thirds of the gel-like suspension was removed. The remaining one third of the sample was placed back onto the rotating wheel and the reaction continued for another 42 weeks (1 year).
The removed sample was filtered under vacuum using a filter funnel and Whatman paper to remove excess water. Once the water was extracted from the filtered product the sample was transferred to a crystallization jar and placed in a dissector and vacuum dried for 14 to 21 days. The resulting product was placed into 25 ml glass vials. Each vial was purged with N2 gas, labelled and sealed until required. One sample of each
C-S-H system was characterized for material properties.
4.0 Results
After the addition of water to the dry-blended raw materials the exothermic reaction of CaO to form Ca(OH)2 commenced immediately and the bottles
became warm. After reaction (70 days) the gel-like product exhibited colloidal behaviour. The solid phase of the system did not easily settle out after agitation was stopped. A small sample of each wet system was placed in a small bottle and allowed to stand. The solid phases did settle somewhat after approximately 4 to 7 days. The synthesis of C-S-H’s with very low C/S ratios (0,6 and 0.8) resulted in solutions that were semi-transparent to clear after 70 days of reaction; however the filtered product was white. In general the higher the Ca content the longer it took to dry. At the end of the drying time the samples were ground with a mortar and pestle to a fine white powder.
4.1 X-ray Diffraction
Analysis was undertaken using a Scintag XDS 2000 with copper K㬐 radiation and a secondary graphite monochrometer. The sample was placed in the XRD and scanned from 5 to 110° 2θ in step mode. The step size was 0.03 ° with a dwell time of 15 seconds. Each scan took approximately 14 hours.
5 25 45 65 85 105 3.0 CSH 1.5 CSH 1.2 CSH 1.0 CSH 0.8 CSH 0.6 CSH 2.0 CSH 1.7 CSH 7° CH 29.4° CH CH CH
Figure 1 XRD results of various pure C-S-H’s with different molar ratios
The occurrence of a range of poorly crystalline materials is clearly illustrated by the results seen in Figure 1. Depending on the C/S ratio, some un-reacted calcium hydroxide is detected. The peaks largely match the PDF Database card numbers 33-0306 and 34-0002 for C-S-H. One notable exception is the low angle peak at ~7.2°; this is reported in card 34-0002 as a 100% peak. Results reported here suggest that the peak found in this approximate position is not a 100% peak, and that the position varies considerably. Further studies by the authors suggested that the drying conditions and C/S ratio affected the intensity and position of this peak, which represents changes in ordering. In addition to the experimental/material variables there are diffraction variables to consider too. The low angular nature of the peak makes recording accurate peak intensities susceptible to beam over-spill. The non-linear relationship between two theta and d-spacing means that the errors introduced by sample displacement for larger d-spacings can be considerable.
It is interesting to note that the low angle peaks for 14, 11, and 9Å tobermorite occur at ~6.3°, 7.8° and 9.4° two theta respectivelyT17-19T. Jennite's low angle peak would fall at ~8.4° two theta T6T. Hence it is perhaps not unreasonable to find some variation in the position and intensity of the ~7.2° two theta C-S-H peak.
Figure 2 and Figure 3 show XRD traces of cation doped C-S-H. The sodium doped C-S-H with a C/S ratio of 1.0, shown in Figure 2, exhibits some extra peaks assigned to carbonation. The carbonation is largely sodium based, indicating that, unlike the lithium, a significant proportion of the sodium remains outside of the layered C-S-H structure. This is consistent with Stade’s findings T16T.
5 25 45 65 85 105
Degrees two theta
Intensity 1.7 CSH with LiOH 1.7 CSH with NaOH 7° 1.7 CSH CH CH CH CH
Figure 2 XRD results of various doped C-S-H’s with fixed C/S ratio
5 35 65 95
Degrees two theta
Intensity 7° CSH 1.0 with LiOH CSH 1.0 with NaOH 29.4° CSH 1.0
Figure 3 XRD results of various doped C-S-H’s with fixed C/S ratio
Both of the cation doped materials shown in Figure 3 (C/S=1.7) exhibit increased levels of residual calcium hydroxide (CH). It also appears that there is more residual CH in the Li preparations, in comparison to the Na one. This high level of residual CH means that the true C/S ratios for these materials are different from the control. Correspondingly, the low angle peak (an indication of ordering levels) shifts both in intensity and position.
4.2 NMR Analysis
29
Si MAS-NMR measurements were carried out using a 4.7T wide-bore magnet, and a console supplied by Tecmag. The 29Si resonance frequency
and spun at 4.5 kHz, in a magic angle spinning probe made by Doty Scientific. The sweep width used was 20 kHz, and the 90° length was 10
µs. A simple pulse and acquire pulse sequence was used, with a relaxation delay of 10s. Acquisition of the spectra was normally carried out over night, but some samples were run over a weekend. This means that the number of scans accumulated for some samples are different. This limits the level of interpretation possible.
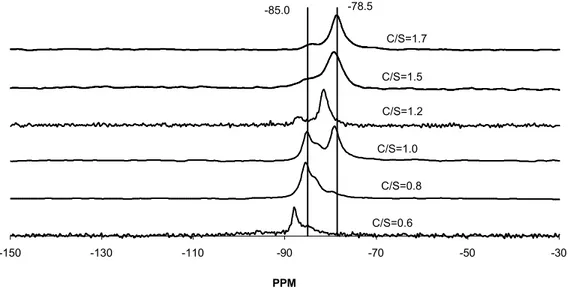
-150 -130 -110 -90 -70 -50 -30 PPM C/S=1.7 C/S=1.5 C/S=1.2 C/S=1.0 C/S=0.8 C/S=0.6 -78.5 -85.0
Figure 4 Si29 NMR results of various pure C-S-H’s with different C/S molar ratios
Figure 4 shows Si29 NMR spectra for the same series of materials characterised by XRD in Figure 1. The results generally show good agreement with those in the published literature T20-22T, in that the levels of polymerisation decrease with increased C/S ratio.
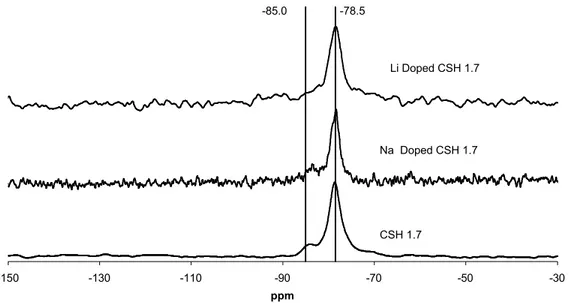
-150 -130 -110 -90 -70 -50 -30 ppm CSH 1.7 Li Doped CSH 1.7 Na Doped CSH 1.7 -78.5 -85.0
& Figure 6 show NMR traces of cation doped C-S-H at two different C/S ratios. They are the same materials seen by XRD in Figure 2 Figure 3
-150 -130 -110 -90 -70 -50 -30 ppm CSH 1.7 Li Doped CSH 1.7 Na Doped CSH 1.7 -78.5 -85.0
is especially interesting as it shows that the lithium doped material shows markedly different behaviour to either the sodium doped or control materials. The lithium doped C-S-H with a C/S ratio equal to 1.0 exhibits a silica polymerisation level equivalent to that of a C-S-H with a C/S ratio equal to 1.7. Both the control and the sodium doped C-S-H exhibit a doublet, whereas the lithium doped C-S-H (with a C/S ratio equal to 1.0) exhibits a single peak with a shoulder. This is characteristic of the C-S-H with a C/S ratio equal to 1.7 as seen in Figure 6. Previous work (23Na NMR) on the interaction of NaCl with C-S-H suggests that sodium has an affinity for the C-S-H surface. T23T
-150 -130 -110 -90 -70 -50 -30 ppm CSH 1.0 Li Doped CSH 1.0 Na Doped CSH 1.0 -78.5 -85.0
Figure 5 29Si NMR results of various doped C-S-H’s with fixed C/S ratio
-150 -130 -110 -90 -70 -50 -30 ppm CSH 1.7 Li Doped CSH 1.7 Na Doped CSH 1.7 -78.5 -85.0
Figure 6 29Si NMR results of various doped C-S-H’s with fixed C/S ratio of 1.7 4.3 Fourier Transfer Infrared FTIR
Figure 7 shows FTIR spectra for the same series of materials characterised by XRD in Figure 1 and NMR in Figure 4. The results again show agreement with those in the published literature T24,25T. The silicate band at ~956 wave numbers is perhaps the most interesting aspect of the graph. At low C/S ratios the peak exhibits a shape like a ‘witches hat’. The peak shape changes with increasing C/S ratio to a narrower more rounded/blunt peak. This is interpreted to represent the change in polymerisation noted from the NMR (Figure 4) The peak shape change
occurs between C-S-H's with a C/S ratio of 1.0 and those with a ratio of 1.2; this again is compatible with the NMR results.
400 800 1200 1600 2000 2400 2800 3200 3600 4000 CSH 3.0 CSH 2.0 CSH 1.7 CSH 1.5 CSH 1.2 CSH 1.0 CSH 0.8 CSH 0.6 OH -assigned to CH CO3 2- Assigned to CaCO3 TSiO4T 4-Assigned to C-S-H
Figure 7 FTIR results of various pure C-S-H’s with different molar ratios
Figure 8 & Figure 9 show FTIR traces of cation doped C-S-H at two different C/S ratios. They are the same materials seen by XRD in Figure 2,
Figure 3 and NMR in -150 -130 -110 -90 -70 -50 -30 ppm CSH 1.7 Li Doped CSH 1.7 Na Doped CSH 1.7 -78.5 -85.0 & Figure 6.
Figure 8 is again especially interesting as it shows that the lithium-doped material shows the same markedly different behaviour as that noted in the
-150 -130 -110 -90 -70 -50 -30 ppm CSH 1.7 Li Doped CSH 1.7 Na Doped CSH 1.7 -78.5 -85.0
). That is the lithium doped C-S-H with a C/S ratio equal to 1.0 exhibits a silica peak shape equivalent to that of a C-S-H with a C/S ratio equal to 1.7. Both the control and the sodium doped C-S-H exhibit a silica peak shaped like a ‘witches hat’, whereas the lithium doped C-S-H (with a C/S ratio equal to 1.0) exhibits a narrower more rounded silica peak shape. This more rounded silica peak shape is characteristic of the C-S-H with a C/S ratio equal to 1.7 as seen in Figure 6.
400 800 1200 1600 2000 2400 2800 3200 3600 4000 CSH 1.0 Li Doped CSH 1.0 Na Doped CSH 1.0 CO3 2- Assigned to CaCO3 TSiO4T 4-Assigned to C-S-H
400 800 1200 1600 2000 2400 2800 3200 3600 4000 CSH 1.7 Li Doped CSH 1.7 Na Doped CSH 1.7 OH -assigned to CH CO3 2- Assigned to CaCO3 TSiO4T 4-Assigned to C-S-H
Figure 9 FTIR results of various doped C-S-H’s with fixed C/S ratio of 1.7
Both of the cation doped materials shown in Figure 9 (C/S=1.7) exhibit increased levels of residual calcium hydroxide (CH), as in the XRD. This high level of residual CH confirms the XRD result, in that the true C/S ratios for these materials are different from the control.
4.4 Microstructural Evaluation
A small amount of each C-S-H system was ground and deposited onto a carbon tape on an aluminum stub and placed into the SEM for characterization. Figure 10 shows an SEM image of the sample prepared at a C/S = 1.0. It shows flakes or foils and shows markedly different microstructure to that seen in Figure 11 showing a sample with a C/S ratio of 1.7. Figure 11 shows thicker and more defined plates; these microstructural differences are interpreted as those of C-S-H I and C-S-H II.
When comparing Figure 11 & Figure 12, C/S = 1.7 and C/S 1.0 with lithium, there are more microstructural similarities than that observed when you compare Figure 10 (C/S = 1.0) and Figure 12 (C/S = 1.0 with lithium). This again agrees with the FTIR and the NMR results; the low C/S ratio C-S-H with lithium is similar to a high C/S ratio material.
Figure 10 SEM image of C/S = 1.0
Figure 11 SEM image of C/S = 1.7 Figure 12 C/S ratio 1.0 with LiOH
5.0 Discussion and conclusions
C-S-H’s with various C/S ratios have been synthesised by reacting CaO and amorphous silica at room temperature for 70 days. Chemical and microstructural behaviour as determined by SEM, NMR, FTIR, & XRD, is consistent with the published literature. These pure materials have been used as a baseline to compare the behaviour of lithium and sodium doped materials.
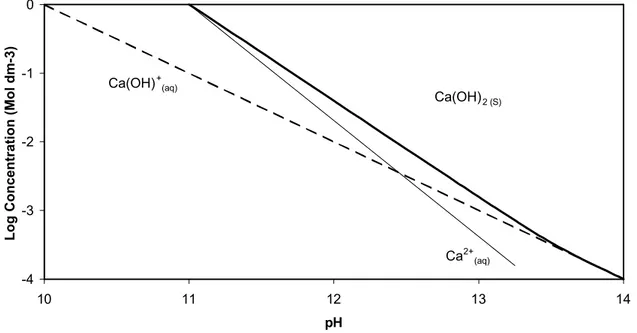
Preparations made with both lithium and sodium hydroxide exhibit signs of excess or un-reacted residual Ca(OH)2. This means that these preparations have
a different effective C/S ratio than those of the pure base line materials. This excess Ca(OH)2 can perhaps be explained by looking at the Ca(OH)2 solubility
diagram (Figure 13). The presence of lithium and sodium hydroxide will increase the pH closer to 14, increasing the likelihood of solid CH.
-4 -3 -2 -1 0 10 11 12 13 14 pH
Log Concentration (Mol dm-3)
Ca(OH)+(aq)
Ca2+ (aq) Ca(OH)2 (S)
Figure 13 Ca(OH)2 solubility diagram after Ottewill W26W
First impressions might lead to the supposition that lithium would be incorporated into the C-S-H on either the same sites as sodium or perhaps the tetrahedral sites (silica). The structural chemistry of the two ions discussed in the introduction suggests that lithium and sodium/potassium will not be incorporated onto the same crystallographic site. Lithium may not exclusively go to tetrahedral sites (silica), but may also go to octahedral sites (calcium). Similarly mixed coordination lithium is observed in lithium manganese oxide spinels T27T. The observation that lithium doped materials at low C/S ratio (1.0) show characteristics similar to C-S-H with a higher C/S ratio of 1.7, tentatively suggests that lithium affects the polymerisation of the silica by promoting de-polymerisation.
This paper adds to the existing body of work suggesting that there is a structural difference between lithium and sodium doped C-S-H materials. This difference may lead to the difference in expansive behaviours. Large expansions have been observed by one of the authors for C-S-H immersed in lithium salt solutions. T28T
Acknowledgements
The authors would like to acknowledge Dr. Pamela Whitfield for discussion of XRD results, Dr. P. E. Grattan-Bellew for discussions on C-S-H, Ms Bussaraporn Patarachao and Dr. S. Lang for help with the NMR spectra, Mr. Peter Collins for the FTIR and Cabosil for supplying the amorphous silica.
References
1. H.F.W.Taylor, Cement Chemistry, Academic Press Ltd, London, 1990.
2. V.S.Ramachandran & J.J.Beaudoin, Handbook of Analytic Techniques in Concrete Science and Technology, Noyes Publications, New York, USA, 2000.
3. H.F.W.Taylor, Hydrated Calcium Silicates: V, Water content of Calcium Silicate Hydrate I, J Chem Soc (London), 33 (1953) 163-171.
4. I.G.Richardson, Tobermorite/jennite- and tobermorite/calcium hydroxide-based models for the structure of C-S-H: applicability to hardened pastes of tricalcium silicate, h-dicalcium silicate, Portland cement, and blends of Portland cement with blast-furnace slag, metakaolin, or silica fume, Cem Concr Res, 34 (2004) 1733-1777.
5. J.D.Birchall, N.L.Thomas, The Mechanism of retardation of setting of OPC by Sugars, British Ceramic Proceedings, 35 (1984) 305-315.
6. E.Bonaccorsi, S.Merlino, H.F.W.Taylor, The crystal structure of jennite, Ca9Si6O18(OH)6.8H2O, Cem Concr Res, 34 (2004) 1481-1488.
7. H.F.W.Taylor, Proposed structure for calcium silicate hydrate gel, J.Am.Ceram.Soc., 69 (1986) 464-467.
8. X.-D.Cong, R.J.Kirkpatrick, 29Si MAS-NMR Study of the Structure of
Calcium Silicate Hydrate, Advanced Cement Based Materials, 3 (1996) 144-156.
9. Lea's Chemistry of Cement and Concrete, P. C. Hewlett (Ed), Arnold, London, UK, 1998.
10. H.Sung-Yoon, F.P.Glasser, Alkali binding in cement pastes Part I. The C-S-H phase, Cem Concr Res, 29 (1999) 1893-1903.
11. S. Diamond, R. S. Barneyback, L. J. Struble, On The Physics and
Chemistry of Alkali-Silica Reaction, in: Proceedings of the Fifth International Conference on Alkali-Aggregate Reaction in Concrete, pp. S252-22 1-11.
12. L.D.Mitchell, J.J.Beaudoin, P.E.Grattan-Bellew, The effects of lithium hydroxide solution on alkali silica reaction gels created with opal, Cem Concr Res, 34 (2004) 641-649.
13. J.S.Lumley, ASR Suppression by Lithium Compounds, Cem Concr Res, 27 (1997) 235-244.
14. W.J.McCoy, A.G.Cauldwell, New approach to inhibiting alkali aggregate expansion, Journal of The American Concrete Institute, 22 (1951) 693-706.
15. X.Feng, M.D.A.Thomas, T.W.Bremner, B.J.Balcom, K.J.Folliard, Studies on lithium salts to mitigate ASR-induced expansion in new concrete: a critical review, Cem Concr Res, 35 (2005) 1789-1796.
16. H.Stade, On The Reaction of C-S-H (Di, Poly) With Alkali Hydroxides, Cem Concr Res, 19 (1989) 802-810.
17. E.Bonaccorsi, S.Merlino, A.Kampf, The Crystal Structure of Tobermorite 14 A (Plombierite), a C-S-H Phase, Journal of The American Ceramic Society, 88 (2005) 505-508.
18. S.Merlino, E.Bonaccorsi, T.Armbruster, The real structure of tobermorite 11 A: normal and anomalous forms,OD character and polytypic modifications, European Journal of Mineralogy, 13 (2001) 577-590.
19. S.Merlino, E.Bonaccorsi, T.Armbruster, Tobermorites: their real structure and order-disorder (OD) character, American Mineralogist, 84 (1999) 1613-1621.
20. X.-D.Cong, R.J.Kirkpatrick, 17O and 29Si MAS NMR Study of β-C2S
Hydration and the Structure of Calcium Silicate Hydrate, Cem Concr Res, 23 (1993) 1065-1077.
21. M.Grutzeck, A.Benesi, B.Fanning, Silicon-29 Magic Angle Spinning Nuclear Magnetic Resonance Study of Calcium Silicate Hydrates, J.Am.Ceram.Soc., 72 (1989) 665-668.
22. J.J.Chen, J.J.Thomas, H.F.W.Taylor, H.M.Jennings, Solubility and structure of calcium silicate hydrate, Cem Concr Res, 34 (2004) 1499-1519.
23. H.Viallis, P.Faucon, J.C.Petit, A.Nonat, Interactions between Salts (NaCl, CsCl) and Calcium Silicate Hydrates, J.Phys.Chem.B, 103 (1999) 5212-5219.
24. K.Nakomoto, Infrared Spectra of Inorganic and Co-ordination Compounds, J. Wiley, New York, 1963.
25. A.H.Delgado, R.M.Paroli, J.J.Beaudoin, Comparison of IR Techniques for the Characterization of Construction Cement Minerals and Hydrated Products, Applied Spectroscopy, 50 (1996) 970-976.
26. R.H.Ottewill, Chemistry of colloidal silicates and cements, Phil.Trans.R.Soc.Lond., A310 (1983) 67-78.
27. M.H.Rossouw, A.de Kock, L.A.de Picciotto, M.M.Thackeray, W.I.F.David, R.M.Ibberson, Structural Aspects of Lithium-Manganese-oxide Electrodes for Rechargeable Lithium Batteries, Mat.Res.Bull., 25 (1990) 173-182.
28. H.Drame, J.J.Beaudoin, L.Raki, A Comparative Study of C-S-H (I) and Portland Cement Paste in Aqueous Salt Solution, J Mat Sci, In press