Publisher’s version / Version de l'éditeur:
Vous avez des questions? Nous pouvons vous aider. Pour communiquer directement avec un auteur, consultez la
première page de la revue dans laquelle son article a été publié afin de trouver ses coordonnées. Si vous n’arrivez
Questions? Contact the NRC Publications Archive team at
PublicationsArchive-ArchivesPublications@nrc-cnrc.gc.ca. If you wish to email the authors directly, please see the first page of the publication for their contact information.
https://publications-cnrc.canada.ca/fra/droits
L’accès à ce site Web et l’utilisation de son contenu sont assujettis aux conditions présentées dans le site LISEZ CES CONDITIONS ATTENTIVEMENT AVANT D’UTILISER CE SITE WEB.
Internal Report (National Research Council of Canada. Institute for Research in Construction), 2000-10-20
READ THESE TERMS AND CONDITIONS CAREFULLY BEFORE USING THIS WEBSITE. https://nrc-publications.canada.ca/eng/copyright
NRC Publications Archive Record / Notice des Archives des publications du CNRC :
https://nrc-publications.canada.ca/eng/view/object/?id=b516cfdd-0170-4427-9532-77daf90974d5 https://publications-cnrc.canada.ca/fra/voir/objet/?id=b516cfdd-0170-4427-9532-77daf90974d5
NRC Publications Archive
Archives des publications du CNRC
For the publisher’s version, please access the DOI link below./ Pour consulter la version de l’éditeur, utilisez le lien DOI ci-dessous.
https://doi.org/10.4224/20386112
Access and use of this website and the material on it are subject to the Terms and Conditions set forth at
Laboratory measurements of the sound insulation of building façade elements
Laboratory Measurements of the Sound Insulation
of Building Façade Elements
J.S. Bradley and J.A. Birta
IRC Internal Report, IRC IR-818
October 2000
Summary
This report provides the results of over 100 laboratory measurements of the sound transmission loss of building façade components. These included various wall and roof constructions along with some windows and a number of tests to evaluate the effects of vents on sound insulation.
The current work is a major component of the IBANA project (Insulating Buildings Against Noise from Aircraft). The complete IBANA project includes both laboratory and field measurements of building façade sound insulation as well as the creation of
computer software to permit the convenient use of this data to design the exterior sound insulation of buildings against aircraft noise.
Tests were performed according to the ASTM E90 procedure that involves building the test partition in an opening between two reverberation chambers. The results give measures of the sound insulation of each façade component for randomly incident sound energy. The OITC (Outdoor-Indoor Transmission Class) was used to give a single-number rating of the sound insulation of each construction against aircraft noise. Many of the tests were carried out as a number of mini-series in which a particular component was varied but other details of the construction were not varied. For example the effects of different exterior wall cladding were investigated on the same basic wall construction.
Walls
• Tests of various wood stud walls had OITC ratings from a low of 25 to a high of 44. Increasing the stud spacing, adding resilient channels, or using a staggered stud configuration all significantly increased the rating of the wall. Combining one of these improvements with additional surface layers to increase their mass produced further improvements in the overall sound insulation.
• The sound insulation of walls with the conventional 406 mm stud spacing and directly attached surface layers is usually limited by a dip in the sound transmission loss at about 125 Hz. The sound insulation rating of these walls can be improved by using a larger stud spacing, by attaching the gypsum board with resilient channels or by using a staggered stud configuration.
Windows
• Manufactured contemporary windows can have sound insulation that is either inferior to or superior to that of the double glazing units that they include. Sliding windows tended to be limited by air leaks. Several better casement windows had sound transmission loss values better than those of the double glazing units.
• All of the double glazing units and complete windows had lower sound transmission loss values than reported in an earlier laboratory study of the same combination of glass and air space.
• Adding a storm window with a sufficiently large air space significantly improved the overall sound insulation of the window.
Roofs
• Wood-joist and wood-truss flat roof constructions tended to have sound insulation ratings similar to the better walls. This is because the shingles provided a heavier surface layer and also because these roofs had a greater cavity depth than the walls. • Sloping roof constructions tended to have better OITC ratings than the flat roofs.
However, when the shingles and OSB of these roofs were replaced with steel sheeting the overall sound insulation was reduced.
• Adding vents to the roofs reduced the OITC ratings by up to 3 points. The effect of vents was less when there was more insulation in the roof cavity and when the gypsum board was directly attached.
• The sound insulation of light-weight steel deck roof systems varied with the amount of pebbles on the roof and the presence of a T-bar ceiling.
Table of Contents
Page
Acknowledgements 4
1. Introduction 5
2. Testing Procedure 7
2.1 Sound transmission loss measurements 7
2.2 Construction details 7
2.3 Single number ratings 8
2.4 The Reverberation chamber test facilities 8
2.5 Validation tests 10
3. Walls 14
3.1 Varied exterior cladding 14
3.2 Varied attachment of exterior cladding 15
3.3 Varied exterior sheathing 16
3.4 Varied stud system (stud size, stud spacing, and staggered studs) 18
3.5 Varied internal insulation 23
3.6 Effect if resilient channels and interior surface layers 25
3.7 Vents 28
3.8 Superior wall constructions 29
3.9 Comparisons with other studies 30
4. Windows 33
4.1 Comparison of double glazing units 33
4.2 Varied window type 34
4.3 Benefits of storm windows 37
4.4 Comparison with other studies 40
5. Roofs 45
5.1 Wood-joist flat/cathedral ceiling roofs 45 5.2 Wood-truss flat/cathedral ceiling roofs 48 5.3 Raised heel wood-truss with shingles 51 5.4 Raised heel wood-truss with steel sheeting 59
5.5 Steel deck flat roof 63
6. Conclusions 65
References 67
Appendix I Advisory Panel 68
Appendix II Explanation of symbols used to describe constructions 69
Appendix III Data 71
Index of constructions by Test ID 178
Acknowledgements
Primary financial support for the IBANA project was provided by Transport Canada, the Department of National Defence and the National Research Council. To date additional funding has been received from Vancouver International Airport Authority. In kind support from Ottawa Airport, Thermo-Cell Industries and from Chantecler Windows is also gratefully acknowledged.
Disclaimer
The contents of this report are the results of tests and analyses carried out in the acoustics laboratory of the Institute for Research in Construction at the National Research Council of Canada. While they are thought to be the best interpretation of the available data, other interpretations are possible and these results may not reflect the policies of either
1. Introduction
This report presents the results of an extensive series of laboratory measurements of the sound insulation of building façade elements. These results include measurements of the sound transmission loss of various wall and roof constructions along with some tests of windows and the effects of various vents. This work is a major component of the IBANA project (Insulating Buildings Against Noise from Aircraft). The complete IBANA project includes both laboratory and field measurements of building façade sound insulation as well as the creation of computer software to permit the convenient use of these data to design the exterior sound insulation of buildings against aircraft noise.
The IBANA project is a result of an earlier comprehensive review of the NEF aircraft noise measure and various aspects of predicting aircraft noise and its effects in Canada [1-3]. One of the conclusions of the review was that improved building sound insulation was a key remedial measure for minimising the impact of aircraft noise. It was further concluded that, in Canada, available technical information and guidelines [4] for achieving improved sound insulation were very much out of date and inadequate. A more specific investigation of current knowledge of building façade sound insulation issues was also completed [5]. This study found that although the basic principles were generally well understood there was almost no available data representative of the sound insulation of modern Canadian building constructions. Further there was only a rough understanding of the relationship between laboratory and field sound insulation data, and existing Canadian guidelines were based on aircraft noise spectra that are not
representative of modern aircraft types.
The IBANA project includes the following key components:
• Laboratory measurements of the sound insulation of various building façade
components including various wall and roof constructions as well as windows and the effects of vents.
• Field measurements of the sound insulation of various configurations of a simple wood frame test house at Ottawa Airport.
• Development of a procedure for conversion between laboratory and field measurements of sound insulation.
• Development of software to enable the more accurate and convenient design of the required sound insulation for buildings exposed to aircraft noise.
• Field validation of the new design procedure.
The IBANA project is a 3-year project, but the bulk of the work is to be completed in the first two years. This report represents the results of the work described in the first bullet above. It also provides the database of sound insulation data to be used in the new software.
The main body of the report discusses the trends shown by the various series of
measurements. It is hoped that this will help readers to more conveniently understand the major trends and to make it possible for them to estimate the likely effects of other
Appendix III tabulates all of the measured sound insulation data. The data for each reported construction fills one single page. This provides a convenient reference for laboratory measurements of the sound insulation of various building façade components representative of modern Canadian constructions. Of course, all constructions currently in use could not be included, but a wide range of common and acoustically relevant constructions were tested. The choice of constructions was helped by comments from the advisory panel listed in Appendix I. The choice was also influenced by a desire to
2. Testing Procedure
2.1 Sound transmission loss measurements
The sound transmission loss measurements given in this report were obtained in laboratory measurements following the standard ASTM E90 procedure [6]. This
procedure involves building the wall or roof to be tested in a special test opening between two reverberant test chambers. High levels of a test noise are produced in the source chamber and the levels of the sound in both the source and receiving reverberation
chambers are measured. The acoustical characteristics of the receiving room are obtained from reverberation time measurements. The sound transmission loss values calculated from these measurements indicate the amount of sound energy transmitted though the test partition as a function of frequency. The test chambers are designed to provide a diffuse sound field in which sound will be incident on the test partition more or less equally from all directions. This is, of course, not the same as for real buildings exposed to the noise from passing aircraft, which will be incident on the building at various specific angles of incidence.
The actual test procedure exceeded the requirements of the ASTM E90 standard in several ways. Although the standard requires measurements to be made in the 1/3 octave bands from 125 to 4k Hz, in this work measurements are reported for the 1/3 octave bands from 50 to 5k Hz. The additional lower frequency measurements are particularly important because typical outdoor sound sources such as aircraft noise contain significant low frequency sound energy. In the laboratory measurements, sound levels were
measured at 9 independent locations in the source and the receiving reverberation chambers. Similarly, reverberation times were measured from the ensemble average of 10 decays at the same 9 independent microphone positions in the receiving chamber. The tests were repeated for both directions of propagation through the test partitions. That is, in one test one reverberation chamber was the source chamber and in the second the other chamber was the source chamber. The results quoted in this report are always the
average of the two tests. In addition to descriptions of each construction, all test results are referred to by their Test ID (e.g. TLA-99-029a) to provide a unique identifier for each result. This also permits the reader to refer to the complete test result details in Appendix III and index.
2.2 Construction details
The details of each construction are described by a series of letters and numbers describing the components of the wall or roof in order from one side to the other. For example the base wall with vinyl siding attached is described as follows:
VIN1_OSB11_WS140(406)_GFB152_G13.
This indicates that starting from the outside there is 1 mm thick vinyl siding (VIN) attached to 11 mm thick OSB sheathing. The wood studs (WS) are 140 mm studs spaced at 406 mm with 152 mm thick glass fibre batt insulation (GFB) in the cavity. The inner surface is a single layer of 13 mm thick gypsum board (G). Descriptions of all of the symbols used are included in Appendix II. The numerical part of the code indicates the thickness or spacing in mm. For the wall and window tests the components are listed in order from the small chamber side to the large chamber side. For the roof tests,
components are listed from the upper chamber to the lower chamber side of the roof. This corresponds to going from the outer surface to the inner surface of the roof.
Some materials were not varied throughout these tests and these common properties are, for brevity, not always repeated in the following discussions. OSB sheathing was always 11 mm thick and only 13 mm thick regular gypsum board was used. All walls and roofs included a polyethylene vapour barrier immediately under the interior gypsum board layers.
2.3 Single number ratings
The E90 procedure provides measured sound transmission loss values in decibels versus 1/3 octave band frequency. Various single number ratings can be calculated from the complete data to give a convenient rank ordering of various constructions. Most commonly, the Sound Transmission Class (STC) is calculated. It is a single number rating obtained by fitting a standard reference contour to the measured transmission loss values according to the rules specified in ASTM E413 [7]. Although the STC rating is widely used, it is only intended for use with typical indoor noises such as speech and typical office sounds. It is not appropriate for rating exterior façade elements to typical outdoor noises that usually contain high levels of low frequency sound.
The ASTM Outdoor-Indoor Transmission Class (OITC) [8] has been developed as a single number rating for exterior façades and typical transportation type noise sources. In this report both STC and OITC are included in Appendix III. However, because STC is not an appropriate single number rating to rank order exterior façade elements, only OITC values are included in the discussions in the text of the following sections. The OITC rating gives the A-weighted reduction of the test partition to a standard outdoor noise spectrum and includes frequencies from 80 to 4k Hz. It is intended that this
standard spectrum be representative of all types of outdoor noises and not necessarily just aircraft noise. Previous comparisons [5] with aircraft noise spectra suggested that the OITC source spectrum has higher levels at both high and low frequency extremes than do typical modern commercial jet aircraft noise spectra. Although these spectral differences might lead to small differences in ranking of various constructions, the OITC rating is used for convenience in the discussions of this report. The new sound insulation design software being developed as part of this project will calculate the A-weighted level reduction for a selected aircraft noise spectrum as well as the standard OITC value.
2.4 The reverberation chamber test facilities
Two different pairs of reverberation chambers were used to perform the sound
transmission loss tests. The transmission loss of windows and all wall constructions were performed in the wall test facility in building M27 at the Montreal Road NRC campus in Ottawa. The floor transmission loss facility in building M59 was used to test the roof constructions. Both facilities have computer-controlled robots to position the
microphone in each room.
The wall test facility consists of two reverberation chambers side by side with movable test frames that can be rolled into position between the two reverberation chambers as illustrated by the sketch in Figure 1. Both chambers are mounted on springs to
the building. The larger of the two chambers is 250 m3 and the smaller is 135 m3. The test frame allows the construction of test walls that are 8 ft. high (2.44 m) by 12 ft. long (3.66 m). The test frames roll into place on heavy steel tracks and are sealed into place between the two chambers with pneumatic seals as well as with foam seals and metal adhesive tape. Both chambers contain diffusing panels to increase the randomisation of sound reflections.
Large Chamber
Small Chamber
Test Frame
Figure 1. Sketch showing the two reverberation chambers of the wall test facility located in building M27.
The two reverberation chambers of the floor test facility are 173 m3 and 170 m3 in volume. One is positioned above the other but they are separately vibrationally isolated. Test frames in which the test floor or roof are constructed roll into place between the two chambers and are sealed in place with pneumatic seals in the same manner as in the wall test facility. The test frame allows the construction of floors (or roofs) that are 12.4 ft (3.785 m) by 15.4 ft (4.700 m) in size. The purpose of the moving test frames is to allow the more efficient construction of test structures outside of the test chambers while other structures are being tested. However, for the sound transmission loss measurements of sloping roof structures included in this report it was necessary to build the roof structure in place inside the reverberation chambers.
Upper Chamber
Lower Chamber
Test Frame
Figure 2. Sketch showing the two reverberation chambers of the floor test facility located in building M59.
2.5 Validation tests
The wall test facility underwent a major renovation immediately prior to the tests reported here. Because of this, a number of extra tests were carried out to verify the acceptable performance of the renovated test facility. Previous experience had shown that exposed portions of the test frame that holds the test walls could create flanking sound transmission paths. Although the test frame was a massive structure made of concrete filled steel sections, the inside surface of the test opening was lined with wood connected to the steel frame by a layer of thin rubber. The test walls were typically about half as thick as the test frame. This left a portion of the wood test frame liner exposed and a potential source of sound radiation of the vibrational energy transmitted through the test wall. This created a potential extra (or flanking) sound transmission path. The importance of this flanking path would be expected to vary with frequency and with the magnitude of the sound transmission loss of the test wall. This flanking path was eliminated by the addition of masking strips that covered the exposed parts of the test frame liner. The masking strips consisted of layers of gypsum board over a layer of glass fibre duct liner material. All of the edges and joints were carefully taped with adhesive metal tape.
The effect of the masking strips is illustrated in Figure 3. This shows the increase (improvement) in transmission loss with the addition of masking strips consisting of one or two layers of gypsum board over glass fibre duct liner. The test wall was the standard base wall consisting of 11 mm OSB on 140 mm studs with a 406 mm spacing, glass fibre thermal insulation in the cavity and 13 mm gypsum board as the other surface layer. These results show that adding masking strips consisting of a single layer of gypsum board improved the wall transmission loss at higher frequencies by up to about 2 dB. The addition of a second layer of gypsum board produced only a very small further improvement. All wall transmission loss tests in this report were performed with
masking strips in place consisting of a double layer of gypsum board. This was assumed to practically eliminate any significant flanking path.
Figure 3. Measured increases in the transmission loss of the base wall with the addition masking strips consisting of either single or double 13 mm layers of gypsum board mounted over glass fibre duct liner material.
Preliminary evaluations also investigated the two types of repeatability of the sound transmission loss measurements. Retest-repeatability indicates the variations that occur when the same test wall construction is re-tested. Rebuild-repeatability measures the variations on completely rebuilding a test wall with the same or new materials and then re-testing that particular wall construction.
Figure 4 illustrates the repeat-repeatability of measurements of the base wall. (11 mm OSB on 140 mm studs with a 406 mm spacing, glass fibre thermal insulation in the cavity and 13 mm gypsum board as the other surface layer). The same wall structure was re-tested in the North test frame 4 times. In the South test frame, a nominally identical wall
-3.0 -2.0 -1.0 0.0 1.0 2.0 3.0 4.0 5.0 63 125 250 500 1000 2000 4000 Frequency, Hz change in TL, dB Single layer Double layer
was re-tested two times. In between each test, the test frame was removed from between the test chambers and returned and the flanking strips remounted. Figure 4 shows the maximum deviations from the average transmission loss values for each test frame. These maximum differences are very small and mostly less than 0.2 dB. Thus repeated tests of the same wall structure can very precisely repeat the same transmission loss values.
Figure 4. Maximum differences in measured sound transmission loss on repeated measurements of the same base wall constructions relative to the mean values. Tests in the North frame included 4 repeats and in the South frame 2 repeats.
Completely rebuilding a wall and re-testing it is expected to lead to larger differences. It is difficult to fasten components together in exactly the same manner each time even in the laboratory. Where different new materials are used, there will be further changes due to small differences in the material properties. If the same materials are used to re-construct a wall, they may have been permanently changed by use in the first
construction. In the M27 wall facility there are two nominally identical test frames that may have small differences that might also influence the measured transmission loss values.
Two different tests of the rebuild-repeatability were carried out and the results are illustrated in Figure 5. In the South test frame the base wall was reconstructed from the same materials but shifted over 40 mm in the test frame. A nominally identical base wall was constructed in the North test frame but using different, new materials. Thus one curve in Figure 5 shows the differences on rebuilding with the same materials, but at a slightly different position, and the other shows the differences when rebuilding in a different test frame with new materials. Thus, in the latter both the materials and the test
-0.4 -0.3 -0.2 -0.1 0.0 0.1 0.2 0.3 0.4 63 125 250 500 1k 2k 4k Frequency, Hz
TLdifference re. mean, dB
North frame South frame
frame were changed and hence this is expected to lead to the largest differences. When the same materials were reused in the same test frame the differences indicated in Figure 5 were mostly less than 1 dB. When both the test frame and the materials were changed differences of up to 2 dB at higher frequencies are indicated in Figure 5.
However, it is usually possible to investigate smaller effects by making only small adjustments to a wall structure rather than completely rebuilding it. For example the effect of an additional layer of gypsum board can be determined more precisely than indicated by the rebuild-repeatability errors indicated in Figure 5 because the basic structure has not changed. Many of the results in this report consist of small series of tests where a particular construction is incrementally modified. The resulting trends in the measured sound transmission loss values generally confirm that such incremental effects can be illustrated more precisely than the rebuild-repeatability errors shown in Figure 5.
Figure 5. Differences in measured sound transmission loss of the base wall construction on completely rebuilding the walls.
-1.0 -0.5 0.0 0.5 1.0 1.5 2.0 2.5 63 125 250 500 1000 2000 4000 Frequency, Hz change in TL, dB
South, New Position Different Frame and Materials
3. Walls
The various wall sound transmission loss measurements are discussed in this section. Each subsection considers the effect of a different component of the wall construction. The
subsections are arranged by wall component in order from the outside surface (exterior cladding) to the inside surface. Many of the tested walls were variations from a base case wall that
consisted of 11 mm OSB on 140 mm studs with a 406 mm spacing, 152 mm glass fibre thermal insulation in the cavity and 13 mm gypsum board as the other surface layer
(OSB11_WS140(406)_GFB152_G13, see Appendix II for symbol descriptions). Many of the constructions consisted of variations of one of these basic components. Where other components were not varied, those components would correspond to this base wall case. For example,
variations of the exterior cladding were all carried out on the base wall construction. Thus these tests only varied the exterior cladding on the same stud system, internal insulation and interior surface. However, other walls were constructed on completely different stud systems. Only walls based on wood stud constructions were included. Each test result is identified by its Test ID. Further information on the tested construction can be found in Appendix III under this same Test ID.
3.1 Varied exterior cladding.
The first component of the exterior walls that was varied was the exterior cladding. Five different types of exterior cladding were tested: vinyl siding, aluminum siding, acrylic stucco (exterior insulation and finish system EIF), cement stucco and brick. All five types of cladding were added to the base wall construction. (OSB11_WS140(406)_GFB152_G13). Figure 6 compares the measured sound transmission loss values. The vinyl and aluminum siding cases are very similar because both materials are very light in weight and do not significantly increase the mass of the wall surfaces. The acrylic stucco tends to produce lower sound transmission loss than the heavier cement stucco material. However, the exterior brick cladding provides the highest transmission loss values because of its much greater mass.
The OITC ratings of these walls vary from 25 to 40 dB. These will be seen to represent the range of OITC values found for most of the wall constructions. Only a few walls have OITC values outside of this range. Thus in comparing other results in this report an OITC of 25 represents a low value for a wall and a value of 40 represents a high OITC value for a wall.
10 20 30 40 50 60 70 80 90 63 125 250 500 1k 2k 4k Frequency, Hz TL, dB
TLA-99-029a -vinyl siding TLA-99-045a -aluminum siding
TLA-99-071a -EIF stucco + expanded polystyrene TLA-99-091a -cement stucco
TLA-99-098a -brick
Test ID Description OITC
TLA-99-029a VIN1_OSB11_WS140(406)_GFB152_G13 25 TLA-99-045a ALM0.6_OSB11_WS140(406)_GFB152_G13 25 TLA-99-071a G13_WS140(406)_GFB152_OSB11_BPAP0.7_EPS25_EIF6 27 TLA-99-091a G13_WS140(406)_GFB152_OSB11_BPAP0.7_STUC9.5 29 TLA-99-098a G13_WS140(406)_GFB152_OSB11_AIR16_BRI89 40
Figure 6. Comparison of measured sound transmission loss values versus 1/3 octave band frequency for varied exterior cladding installed on the base wall
(OSB11_WS140(406)_GFB152_G13).
3.2 Varied attachment of exterior cladding.
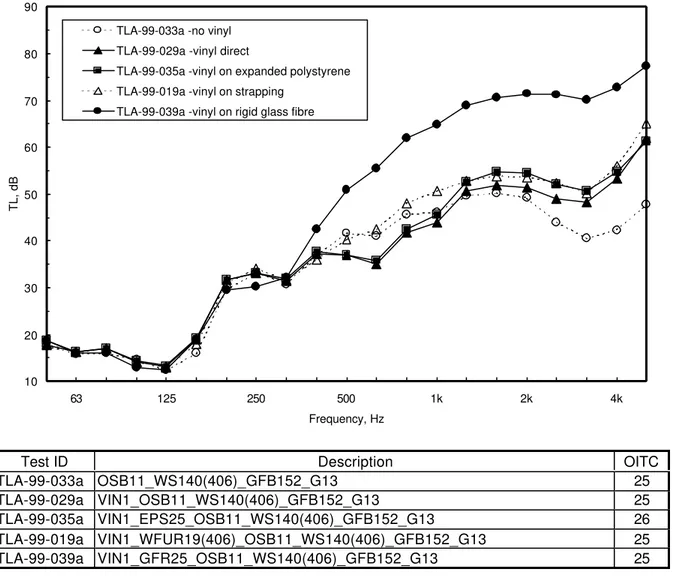
The second feature of walls that was varied was the method of attaching the exterior cladding to the wall system. In these tests vinyl siding was attached to the base wall by various methods. These included having the vinyl siding: directly attached to the OSB; including 19 mm wood strapping between the vinyl siding and the OSB; including a 25 mm layer of expanded
polystyrene insulation between the vinyl siding and the OSB, and including a 25 mm layer of rigid glass fibre insulation between the vinyl siding and the OSB. The resulting sound
transmission loss values are compared in Figure 7. For comparison the measured transmission loss of the base wall without any vinyl siding is also included in this figure.
All of the results in Figure 7 are essentially identical for frequencies up to and including the 315 Hz 1/3 octave band. Adding the vinyl siding to the base wall has a noticeable increase in the sound transmission loss at high frequencies. Adding the vinyl siding either directly to the OSB or by using strapping leads to a small decrease in the measured transmission loss in the 630 Hz
band. However attaching the vinyl siding over a 25 mm layer of rigid glass fibre insulation has the most effect and increases the measured sound transmission loss quite significantly above 400 Hz. In spite of the various differences at mid and higher frequencies, the results in Figure 7 all have essentially the same OITC value. Thus for these walls it is the lower frequency
performance of the walls that limits the rating of the walls against typical outdoor noises and the differences at mid and higher frequencies do not affect the overall rating of the sound insulation of the wall against aircraft noise.
10 20 30 40 50 60 70 80 90 63 125 250 500 1k 2k 4k Frequency, Hz TL, dB
TLA-99-033a -no vinyl TLA-99-029a -vinyl direct
TLA-99-035a -vinyl on expanded polystyrene TLA-99-019a -vinyl on strapping
TLA-99-039a -vinyl on rigid glass fibre
Test ID Description OITC
TLA-99-033a OSB11_WS140(406)_GFB152_G13 25
TLA-99-029a VIN1_OSB11_WS140(406)_GFB152_G13 25 TLA-99-035a VIN1_EPS25_OSB11_WS140(406)_GFB152_G13 26 TLA-99-019a VIN1_WFUR19(406)_OSB11_WS140(406)_GFB152_G13 25 TLA-99-039a VIN1_GFR25_OSB11_WS140(406)_GFB152_G13 25
Figure 7. Comparison of measured sound transmission loss values versus 1/3 octave band frequency for varied method of attaching vinyl siding to the base wall
(OSB11_WS140(406)_GFB152_G13).
3.3 Varied exterior sheathing.
While OSB (Oriented Strand Board) is commonly used for the exterior sheathing of wood frame construction, various wood fibre board products are also used. The acoustical effects of these two types of materials were compared for two different wall constructions. In the first
comparison the measurements of a base wall construction with vinyl siding directly attached to the OSB were compared to measurements of a similar wall construction with the OSB replaced
with wood fibre board exterior sheathing. The comparison of the measured sound transmission loss values in Figure 8 illustrates that the wall with wood fibre board exterior sheathing has a little increased sound transmission loss at mid and high frequencies. These improvements are probably due to the slightly resilient connection between the vinyl siding and the stud system when wood fibre board is used. However, these differences do not influence the OITC rating and hence the walls are expected to provide equivalent sound insulation against aircraft noise. The two types of exterior sheathing were also compared on the same stud system but with an interior surface consisting of two layers of gypsum board mounted on resilient channels. (The effects of resilient channels are discussed in section 3.6 below). Figure 8 shows that adding two layers of gypsum board on resilient channels leads to large increases in the measured sound transmission loss values relative to the two walls with only a single layer of gypsum board and
0 10 20 30 40 50 60 70 80 90 100 63 125 250 500 1k 2k 4k Frequency, Hz TL, dB TLA-99-029a -OSB TLA-99-089a -OSB + RCs TLA-99-104a - wood fibre board TLA-99-111a -wood fibre board + RCs
Test ID Description OITC
TLA-99-029a VIN1_OSB11_WS140(406)_GFB152_G13 25 TLA-99-089a VIN1_GFR25_OSB11_WS140(406)_GFB152_RC13(610)_2G13 35 TLA-99-104a VIN1_WFB13_WS140(406)_GFB152_G13 25 TLA-99-111a VIN1_GFR25_WFB13_WS140(406)_GFB152_RC13(610)_2G13 33
Figure 8. Comparison of measured sound transmission loss values versus 1/3 octave band frequency for walls including 13 mm wood fibre board or 11 mm OSB exterior sheathing. The lower two curves are for varied exterior sheathing on the base wall construction. For the upper two curves the walls also included interior surfaces consisting of two layers of 13 mm gypsum board mounted on resilient channels.
no resilient channels. However, for these two improved walls there is very little difference between the wall with OSB and the other with wood fibre board. The OSB sheathing is heavier (6.9 kg/m2 vs 3.5 kg/m2) and would be expected to lead to a little greater sound transmission loss values. The OITC values in Figure 8 suggest that there is a 2 dB improvement in the OITC rating for the wall with OSB exterior sheathing. This is partly because the OITC standard requires that the OITC values be rounded off to integer values. In this case one value was rounded down and the other rounded up so that the actual difference was really closer to 1 dB and this is really a very minor improvement.
3.4 Varied stud system (stud size, stud spacing, and staggered studs).
Walls were constructed with varied wood stud systems. Both the stud size and the stud spacing were varied. Walls were also constructed with staggered studs where the two different wall surfaces are attached to different sets of studs constructed on the same plate.
0 10 20 30 40 50 60 70 63 125 250 500 1k 2k 4k Frequency, Hz TL, dB TLA-99-021a -2x4 studs TLA-99-029a -2x6 studs
Test ID Description OITC
TLA-00-021a VIN1_OSB11_WS89(406)_GFB89_G13 24 TLA-99-029a VIN1_OSB11_WS140(406)_GFB152_G13 25
Figure 9. Comparison of measured sound transmission loss values versus 1/3 octave band frequency for walls constructed with either 89 mm or 140 mm wood studs both spaced at 406 mm. Both walls had vinyl siding mounted on 11 mm OSB sheathing with glass fibre in the cavity and a single layer of 13 mm gypsum board on the interior surface.
The effect of stud size was examined for variations of the base wall construction with either 89 mm (2” by 4”) or 140 mm (2” by 6”) wood studs with a 406 mm stud spacing. Figure 9
compares the sound transmission loss of these two walls both having vinyl siding as the exterior cladding. Figure 9 shows that the effect of stud size is quite small and the OITC ratings of the two walls are almost identical. The small differences that do occur vary with frequency. From 160 to 500 Hz the wall with the 140 mm studs has slightly higher sound transmission loss, but between 1 and 4 kHz the wall with the 89 mm studs has the higher sound transmission loss. The effect of stud size was also examined for two other walls with higher overall sound transmission loss. These consisted of vinyl siding mounted over 25 mm rigid glass fibre insulation onto the OSB exterior sheathing. They both had glass fibre in the cavity and two layers of gypsum board mounted on resilient channels as the interior surface. The measurements of these walls are compared in Figure 10. For these constructions the wall with the 140 mm (2” by 6”) stud was consistently a little better in almost all 1/3 octave bands and had a little higher OITC rating. This is because the greater stud depth lowers the mass-air-mass resonance
0 10 20 30 40 50 60 70 80 90 100 63 125 250 500 1k 2k 4k Frequency, Hz TL, dB TLA-99-125a -2x4 studs TLA-99-089a -2x6 studs
Test ID Description OITC
TLA-99-125a VIN1_GFR25_OSB11_WS89(406)_GFB89_RC13(610)_2G13 48 TLA-99-089a VIN1_GFR25_OSB11_WS140(406)_GFB152_RC13(610)_2G13 35
Figure 10. Comparison of measured sound transmission loss values versus 1/3 octave band frequency for walls constructed with either 89 mm or 140 mm wood studs both spaced at 406 mm. Both walls had vinyl siding mounted over 25 mm rigid glass fibre insulation on 11 mm OSB sheathing with glass fibre in the cavity and a double layer of 13 mm gypsum board on resilient channels as the interior surface.
frequency a little. Thus for these constructions with structurally isolated surface layers, there is a small advantage for the larger studs.
While the effect of stud size was seen to be quite small, stud spacing is a more important determinant of the overall performance of exterior walls. The effect of stud spacing was
investigated for both 89 mm and 140 mm wood stud walls. The wall constructions were similar to the base case having vinyl siding on OSB sheathing with glass fibre in the cavity and a single layer of gypsum board as the interior surface. Figure 11 compares two walls with 140 mm wood studs having either 406 mm or 610 mm stud spacing. Figure 12 compares the measurements of three walls having 89 mm wood studs and with stud spacings of 305, 406, and 610 mm. In both graphs the largest changes are at lower frequencies. In all of the walls measured in this study, having exterior sheathing and interior gypsum board directly attached to studs with a 406 mm stud spacing, there is a dip in the sound transmission loss at 125 Hz. Increasing the stud spacing shifts this dip to lower frequencies and improves the overall performance of the wall. Thus in Figure 11 increasing the stud spacing from 406 to 610 mm increases the OITC rating from 25 to 31. Similarly in Figure 12, increasing the stud spacing from 305 to 610 mm, increases the OITC
10 20 30 40 50 60 70 63 125 250 500 1k 2k 4k Frequency, Hz TL, dB TLA-99-029a -406 mm spacing TLA-99-121a -610 mm spacing
Test ID Description OITC
TLA-99-029a VIN1_OSB11_WS140(406)_GFB152_G13 25 TLA-99-121a VIN1_OSB11_WS140(610)_GFB152_G13 31
Figure 11. Comparison of measured sound transmission loss values versus 1/3 octave band frequency for walls constructed with 140 mm wood studs spaced at either 406 or 610 mm. Both walls had vinyl siding mounted on 11 mm OSB sheathing with glass fibre in the cavity and a single 13 mm layer of gypsum board as the interior surface.
rating from 23 to 27. That is, in both cases using less material (larger stud spacing) leads to better performance.
The importance of stud spacing does not seem to be generally recognized. This may be because standard tests often only measure down to 125 Hz and hence do not show the low frequency performance of walls. However, the low frequency sound transmission loss often limits the overall performance of the wall and is particularly important when aircraft sounds are the noise source. The cause of the sound transmission loss dip that occurs at 125 Hz for a 406 mm stud spacing has been explained by the work of Lin and Garrelick [15] as the first structural resonance of the framed panel system made up of the surface layers and studs. As illustrated in Figures 11 and 12, the frequency of this resonance can be adjusted by varying the stud spacing. When the stud spacing is large, it may be confused with the mass-air-mass resonance of the wall. (The simple mass-air-mass resonance is caused by the combination of the masses of the two surface layers and the stiffness of the air cavity [equation 4.82, reference 16]. For example, with a 140
10 20 30 40 50 60 70 63 125 250 500 1k 2k 4k Frequency, Hz TL, dB TLA-00-027a -305 mm spacing TLA-00-021a -406 mm spacing TLA-00-025a -610 mm spacing
Test ID Description OITC
TLA-00-027a VIN1_OSB11_WS89(305)_GFB89_G13 23 TLA-00-021a VIN1_OSB11_WS89(406)_GFB89_G13 24 TLA-00-025a VIN1_OSB11_WS89(610)_GFB89_G13 27
Figure 12. Comparison of measured sound transmission loss values versus 1/3 octave band frequency for walls constructed with 89 mm wood studs spaced at 305, 406, or 610 mm. All three walls had vinyl siding mounted on 11 mm OSB sheathing with glass fibre in the cavity and a single 13 mm layer of gypsum board as the interior surface.
mm cavity filled with absorbing material and with 11 mm OSB and gypsum board surface layers, the mass-air-mass resonance should occur at about 60 Hz). However, Lin and Garrelick’s work shows that the simple mass-air-mass resonance only occurs when the two surface layers are structurally separated such as in staggered stud walls (Figure 13) or when resilient channels are used (Section 3.6).
The low frequency structural resonance dips in the sound transmission loss plots of Figures 11 and 12 are eliminated if the interior gypsum board is attached using resilient channels (See section 3.6 for effects of resilient channels). That is, when one of the surface layers is resiliently attached and hence structurally separated, the framed panel system is changed and the primary structural resonance is eliminated. An alternative approach to reducing the mechanical
connection between the two surfaces of the wall is to use a staggered stud system. In this case two sets of 89 mm (2” by 4”) studs were used on a 140 mm plate (2” by 6”). The outer surface layers are attached to one set of studs and the inner surface layers to the other set of studs. The sound transmission loss of staggered stud walls are compared to other walls with the same stud
10 20 30 40 50 60 70 80 63 125 250 500 1k 2k 4k Frequency, Hz TL, dB TLA-00-021a -2x4 studs TLA-99-029a -2x6 studs TLA-00-049a -staggered studs
Test ID Description OITC
TLA-00-021a VIN1_OSB11_WS89(406)_GFB89_G13 24 TLA-99-029a VIN1_OSB11_WS140(406)_GFB152_G13 25 TLA-00-049a VIN1_OSB11_SWS140(406)_2GFB65_G13 33
Figure 13. Comparison of measured sound transmission loss values versus 1/3 octave band frequency for walls constructed with a 406 mm stud spacing. All three walls had vinyl siding mounted on 11 mm OSB sheathing with glass fibre in the cavity and a single 13 mm layer of gypsum board as the interior surface.
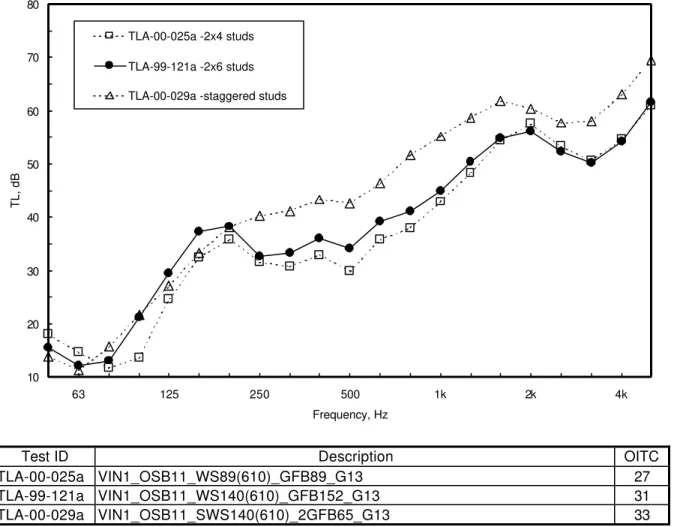
spacing in Figures 13 and 14. For the staggered stud walls, the simple mass-air-mass resonance that occurs at approximately 60 Hz limits the low frequency performance. All walls were constructed using vinyl siding directly attached to 11 mm OSB sheathing, glass fibre insulation in the cavity and a single 13 mm layer of directly attached gypsum board as the interior surface. Figure 13 compares three walls with 406 mm stud spacing. Although the standard 89 mm and 140 mm wood constructions lead to quite similar results, the staggered stud wall is clearly superior. The transmission loss at 125 Hz is particularly improved and the overall performance of the staggered stud wall is superior to the other two walls. The OITC rating of the staggered stud wall is 33 while the other two walls have almost the same OITC ratings (24 and 25). Figure 14 also indicates the superiority of the staggered stud construction. However, for these walls with a larger stud spacing (610 mm) the improvements are not as large. The overall OITC rating of the staggered stud wall is 33 compared to the 31 for the 140 mm stud wall system and 27 for the 89 mm stud wall. The improvements in going to staggered studs are less because the
10 20 30 40 50 60 70 80 63 125 250 500 1k 2k 4k Frequency, Hz TL, dB TLA-00-025a -2x4 studs TLA-99-121a -2x6 studs TLA-00-029a -staggered studs
Test ID Description OITC
TLA-00-025a VIN1_OSB11_WS89(610)_GFB89_G13 27 TLA-99-121a VIN1_OSB11_WS140(610)_GFB152_G13 31 TLA-00-029a VIN1_OSB11_SWS140(610)_2GFB65_G13 33
Figure 14. Comparison of measured sound transmission loss values versus 1/3 octave band frequency for walls constructed with a 610 mm stud spacing. All three walls had vinyl siding mounted on 11 mm OSB sheathing with glass fibre in the cavity and a single 13 mm layer of gypsum board as the interior surface.
structural resonance that is eliminated is replaced by a mass-air-mass resonance at about the same frequency.
3.5 Varied internal insulation.
The effect on measured sound transmission loss of three different types of thermal insulation in the wall cavity were evaluated. It was assumed that thermal and practical requirements for the insulation would normally require the cavity to be completely filled and so only completely filled wall cavities were tested. All of the walls in this study included a thin 0.2 mm polyethylene vapour barrier under the gypsum board to correctly reproduce typical field conditions. Figure 15 compares the measured sound transmission loss values for three different types of cavity
insulation. These were glass fibre, rock fibre and dry blown-in cellulose fibre. These were tested in walls that included resilient channels because these were thought most likely to show
10 20 30 40 50 60 70 80 90 63 125 250 500 1k 2k 4k Frequency, Hz TL, dB TLA-99-093a -cellulose TLA-99-100a -rock fibre TLA-99-102a -glass fibre
Test ID Description OITC
TLA-99-093a VIN1_OSB11_WS140(406)_CFL140_RC13(610)_2G13 35 TLA-99-100a VIN1_OSB11_WS140(406)_RFB140_RC13(610)_2G13 36 TLA-99-102a VIN1_OSB11_WS140(406)_GFB152_RC13(610)_2G13 34
Figure 15. Comparison of measured sound transmission loss values versus 1/3 octave band frequency for walls constructed with a 3 types of cavity insulation. All three walls had vinyl siding directly attached to 11 mm OSB on 140 mm wood studs spaced at 406 mm and with a single 13 mm layer of gypsum board attached via resilient channels as the interior surface.
the expected small effects of different types of cavity insulation. Thus the walls were constructed of vinyl siding directly attached to 11 mm OSB sheathing attached to 140 mm wood studs and with a single layer of gypsum board attached via resilient channels. The results in Figure 15 indicate some small differences for different cavity insulation. The glass fibre material used in these tests led to slightly lower sound transmission loss at most frequencies and this wall had a lower OITC rating. The glass fibre material was also of lower density (9.7 kg/m3) than either the rock fibre (40 kg/m3) or the cellulose fibre (57 kg.m3).
3.6 Effect of resilient channels and interior surface layers.
Increasing the number of layers of gypsum board increases the mass of the interior wall surface and will generally increase the sound transmission loss of the wall. Attaching the gypsum board
10 20 30 40 50 60 70 80 90 63 125 250 500 1k 2k 4k Frequency, Hz TL, dB
TLA-99-029a -single, direct TLA-99-055a -double, direct TLA-99-061a -single + RCs TLA-99-075a -double + RCs
Test ID Description OITC
TLA-99-029a VIN1_OSB11_WS140(406)_GFB152_G13 25 TLA-99-055a VIN1_OSB11_WS140(406)_GFB152_2G13 27 TLA-99-061a VIN1_OSB11_WS140(406)_GFB152_RC13(610)_G13 32 TLA-99-075a VIN1_OSB11_WS140(406)_GFB152_RC13(610)_2G13 34
Figure 16. Comparison of measured sound transmission loss values versus 1/3 octave band frequency for walls constructed with combinations of one or two layers of 13 mm gypsum board with and without resilient channels. All four walls had vinyl siding
directly attached to 11 mm OSB on 140 mm wood studs spaced at 406 mm and with glass fibre insulation in the cavity.
using resilient channels creates a vibration break between the interior and exterior surfaces of the wall and will substantially increase the sound transmission loss of the wall. Walls were tested with both one and two layers of gypsum board with and without resilient channels. In all four cases the wall was constructed with vinyl siding directly mounted on 11 mm OSB sheathing on 140 mm wood studs spaced at 406 mm and with glass fibre insulation in the cavity. The
resulting sound transmission loss values are compared in Figure 16.
The two walls with resilient channels are clearly much superior to the two walls without resilient channels. The walls with resilient channels have OITC ratings of 32 and 34 compared to the 25 and 27 of the two walls without resilient channels. Adding resilient channels leads to increased sound transmission loss values at the critical 125 Hz dip as well as at all higher frequencies. The 125 Hz improvement was explained earlier (Section 3.4). Adding resilient channels eliminates the primary structural resonance [15] but adds a much lower frequency mass-air-mass resonance. The addition of a second layer has a smaller but important effect. This is most marked for the case including resilient channels. This is partly because without resilient channels there may be a significant transmission of energy through the rigid connection to the wood studs which can limit the potential benefits of the added mass.
Resilient channels provide a spring-like connection between the gypsum board and the rest of the wall system. There are different designs of resilient channels that might effect their ability to function as a resilient connection. Three different designs of resilient channels were tested on the same wall construction. The three designs are illustrated in Figure 17. The GP and BM channels had different hole patterns and seemed to feel a little different when flexed. The GP Special channels were the same cross section as the regular GP channels but were specially constructed without holes or extra bends. It was expected that these Special channels might be
GP
GP (Special)
BM
inferior and demonstrate the importance of various holes and extra bends in the design of the resilient channels. The measured sound transmission loss values for walls constructed with these three types of channels are compared to a similar wall without resilient channels in Figure 18. The walls with channels are clearly much superior but the differences among the three types of channels are very small. All walls consisted of vinyl siding directly attached to 140 mm wood studs spaced at 406 mm and with two layers of 13 mm gypsum board attached using the resilient channels.
To better examine the differences among the results for the three types of channels, the results are re-plotted in Figure 19 as the differences in sound transmission loss relative to the case without channels. Figure 19 shows that at many frequencies adding resilient channels leads to improvements of 10 to 15 dB or more. They are particularly helpful at 125 Hz where the
10 20 30 40 50 60 70 80 90 63 125 250 500 1k 2k 4k Frequency, Hz TL, dB TLA-99-055a -no RCs TLA-99-075a -GP TLA-99-077a -BM TLA-99-079a -GP (Special)
Test ID Description OITC
TLA-99-055a VIN1_OSB11_WS140(406)_GFB152_2G13 27 TLA-99-075a VIN1_OSB11_WS140(406)_GFB152_RC13(610)_2G13 34 TLA-99-077a VIN1_OSB11_WS140(406)_GFB152_RC13(610)_2G13 34 TLA-99-079a VIN1_OSB11_WS140(406)_GFB152_RC13(610)_2G13 33
Figure 18. Comparison of measured sound transmission loss values versus 1/3 octave band frequency for walls constructed using three types of resilient channels with a wall constructed without resilient channels. All four walls had vinyl siding directly attached to 11 mm OSB on 140 mm wood studs spaced at 406 mm, with glass fibre insulation in the cavity and with two layers of gypsum board.
-5 0 5 10 15 20 63 125 250 500 1k 2k 4k Frequency, Hz TL change, dB GP BM GP (Special)
Test IDs Description
TLA-99-075a - TLA-99-055a GP TLA-99-077a - TLA-99-055a BM
TLA-99-079a - TLA-99-055a GP (Special)
Figure 19. Incremental effect of three types of resilient channels relative to a similar wall without resilient channels.
performance of walls without channels and with a 406 mm stud spacing is usually most limited. At extremely low frequency (63 Hz) there is actually a small degradation in the transmission loss when channels are added. For the walls with resilient channels, the mass-air-mass resonance of the wall occurs in this band and leads to increased sound transmission in the band.
3.7 Vents.
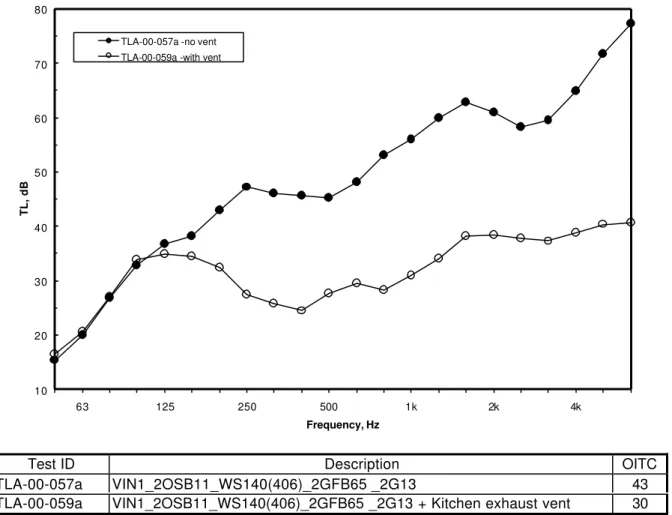
The effect of a typical domestic exhaust fan was tested to determine its effect on the sound insulation of an exterior wall. The unit was a range hood type fan that would normally be located over a stove. The fan exhausted directly through the wall. That is there was no extra duct work. There were two spring-loaded flaps intended to stop air flow back into the house and that would also act to minimise the transmission of sound through the duct. The effect of the added kitchen exhaust fan was tested in a superior wall consisting of a staggered stud
construction that without the vent had an OITC rating of 43. Adding the kitchen exhaust fan decreased the OITC rating to 30. Figure 20 shows that the sound transmission loss at the lowest frequencies was not affected, but at most frequencies the addition of the exhaust fan significantly reduced the effective sound insulation.
This test demonstrates that superior sound insulation cannot be achieved for walls with this type of vent. It would be necessary to add additional duct work with sound absorbing linings or a duct silencer to minimize sound propagation through the exhaust vent.
10 20 30 40 50 60 70 80 63 125 250 500 1k 2k 4k Frequency, Hz TL, dB
TLA-00-057a -no vent TLA-00-059a -with vent
Test ID Description OITC
TLA-00-057a VIN1_2OSB11_WS140(406)_2GFB65 _2G13 43 TLA-00-059a VIN1_2OSB11_WS140(406)_2GFB65 _2G13 + Kitchen exhaust vent 30
Figure 20. Effect of kitchen exhaust fan mounted in a superior wall.
3.8 Superior wall constructions
This subsection compares the performance of several walls that are among the highest overall sound insulation ratings obtained in this study. Brick walls are often thought of as a performance standard desirable in other walls. Figure 21 compares the measured sound transmission loss of three other walls with a wall having exterior brick cladding. The brick wall result (repeated from Figure 6) has an OITC rating of 40. A wall consisting of two layers of gypsum board attached to the base wall via resilient channels and with vinyl siding had an OITC rating of 34. However, the staggered stud wall with single layers of OSB and gypsum board had an OITC rating of 39 and with double layers of both OSB and gypsum board the wall had an OITC rating of 43. Thus it is possible to build walls of comparable or even superior performance to a brick wall.
10 20 30 40 50 60 70 80 90 63 125 250 500 1k 2k 4k Frequency, Hz TL, dB TLA-99-098a - brick TLA-99-075a - RCs
TLA-00-031a - staggered studs TLA-00-045a - RCs + staggered studs
Test ID Description OITC
TLA-99-098a G13_WS140(406)_GFB152_OSB11_AIR16_BRI89 40 TLA-99-075a VIN1_OSB11_WS140(406)_GFB152_RC13(610)_2G13 34 TLA-00-031a VIN1_OSB11_SWS140(610)_2GFB65_2G13 39 TLA-00-045a VIN1_2OSB11_SWS140(610)_2GFB65_RC13(610)_2G13 44
Figure 21. Comparison of measured sound transmission loss values versus 1/3 octave band frequency for four different wall constructions having superior sound transmission loss.
3.9 Comparisons with other studies.
One recent Canadian study tested the sound transmission loss of several wood frame exterior wall constructions [9]. One of these was the same construction as the base wall used in the current study. Figure 22 compares measured sound transmission loss values from both studies for the base wall consisting of 11 mm OSB on 140 mm wood studs spaced at 406 mm with glass fibre in the cavity and 13 gypsum board as the interior surface. Although there are a few larger differences at very low and very high frequencies, the RMS (root mean squared) difference between the two test results is only 2.9 dB and the average difference is 0.4 dB. Some larger differences are to be expected because this comparison includes different construction techniques, materials and different laboratories with possibly small differences in test procedures.
0 10 20 30 40 50 60 70 63 125 250 500 1k 2k 4k Frequency, Hz TL, dB
TLA-99-019a -base wall CMHC177981-7
Test ID Description OITC
TLA-99-019a VIN1_WFUR19(406)_OSB11_WS140(406)_GFB152_G13 25 CMHC177981-7 VIN1_WF25_OSB11_WS140(400)_GFB140_G13 25
Figure 22. Comparison with results from measured sound transmission loss values versus 1/3 octave band frequency from the CHMC study [9] for the base wall construction.
The two studies also both tested one complete wall of the same nominal construction. Figure 23 compares the results for the two tests of these walls that consisted of vinyl siding attached on 19 mm wood furring to 11 mm OSB on 140 mm wood studs spaced at 406 mm with glass fibre insulation in the cavity and a single 13 mm layer of gypsum board as the interior surface. This comparison again shows that the two studies produced quite similar results and the overall RMS difference was only 3.3 dB with an average difference of 0.0 dB.
0 10 20 30 40 50 60 63 125 250 500 1k 2k 4k Frequency, Hz TL, dB
TLA-99-033a -vinyl on base wall CMHC177981-5
Test ID Description OITC
TLA-99-033a OSB11_WS140(406)_GFB152_G13 25
CMHC177981-5 OSB11_WS140(400)_GFB140_G13 25
Figure 23. Comparison of measured sound transmission loss values versus 1/3 octave band frequency with results from the CHMC study [9] for the base wall construction with vinyl siding attached via 19 mm wood strapping.
4. Windows
Windows are usually a critical weak component of the sound insulation of the building façade. Typically windows have lower sound transmission loss than walls and other major façade components. However, extensive work to develop windows with improved sound insulation was beyond the scope of this project. The window sound insulation tests were intended to answer a few specific questions and to provide data for windows typically used in modern Canadian buildings.
Previous research work [10] had established the fundamental importance of the thickness of each layer of glass and the depth of the separating air space. However, the results of one recent study [11] suggested that the sound insulation of contemporary manufactured window units were lower than the results of the older research studies. Most of the earlier work was carried out on laboratory constructions rather than on commercially manufactured window units because the purpose of the earlier work was to develop an understanding of the basic principles influencing the sound insulation of windows. Thus in addition to characterising typical modern Canadian windows, the current tests were intended to determine if there are systematic differences according to the materials and construction of the window frames as well as with the details of the seals of operable windows.
Six different operable windows were tested. Each was approximately 1.2 m by 1.2 m in size. Five of the six windows were made by the same manufacturer but included
different window types and frame constructions. To better understand the effects of the window frames of each type of window, separate tests of the sound insulation of the double glazing units used in the windows were first carried out. All of the sound transmission loss tests of windows and glazing units were conducted with the units installed in a double wall designed to meet the requirements of ISO 140 [12]. This wall was tested to have sound transmission loss more than 10 dB greater than the transmission loss of the window units in each 1/3 octave frequency band.
4.1 Comparison of double glazing units.
The sound transmission loss of six different double glazing units was measured. Each unit was constructed of two layers of 3 mm thick glass with a 13 mm airspace. The double glazing units were 0.451 m by 1.045 m in size. They consisted of combinations of either aluminum or swiggle spacers and either air or argon filled cavities.
The measured sound transmission loss values of the 6 double glazing units are given in Figure 24. They are all seen to have very similar properties with small differences for different types of gas in the cavity. All of the double glazing units have a pronounced dip at 250 Hz, which is thought to be due to the mass-air-mass resonance for this thickness of glass and contained air space. There was no clear effect of the different types of spacers. The units with argon in the cavity have slightly higher transmission loss values at higher frequencies. The argon gas would be expected to shift the mass-air mass resonance of the glazing units but this is not evident from results in Figure 24. However, these differences do not have a significant effect on the OITC ratings and all of the units have essentially the same rating.
10 20 30 40 50 63 125 250 500 1k 2k 4k Frequency, Hz TL, dB TLA-99-197a -aluminum-air TLA-99-201a -aluminum-air TLA-99-203a -swiggle-air TLA-99-205a -swiggle-air TLA-99-209a -aluminum-argon TLA-99-207a -swiggle-argon
Test ID Description OITC
TLA-99-197a aluminum-air 22 TLA-99-201a aluminum-air 22 TLA-99-203a swiggle-air 22 TLA-99-205a swiggle-air 22 TLA-99-209a aluminum-argon 23 TLA-99-207a swiggle-argon 22
Figure 24. Comparison of measured sound transmission loss values versus 1/3 octave band frequency for 6 double glazing units.
4.2 Varied window type.
The six window units were installed in the ISO filler wall and were each tested twice. The first test evaluated the normally closed condition of the operable window and the second condition evaluated the window with any possible air leaks sealed with tape. The six windows are described in Table 2 below and all contained double glazing units with two layers of 3 mm glass separated by a 13 mm air space. All of the windows, except the aluminum casement window, were made by the same manufacturer as the six double glazing units described in the section above.
The measured sound transmission loss values of the 6 windows are given in Figures 25 and 26 and the OITC ratings for all cases are compared in Table 1. Figure 25 shows the results with all seals taped and Figure 26 shows the results for the normally closed (and
not taped) condition of the windows. There are more variations among the results in Figure 26 because of the additional effects of less than perfect window seals. The results for the 6 different windows in Figure 25 are quite similar and have OITC ratings of from 24 to 26. The range in OITC values is inflated slightly due to rounding off of the OITC values to the nearest integer. The windows are actually all close to an OITC of 25 except for two that are slightly inferior (the vinyl double slider and the aluminum casement windows). The overall OITC ratings are all limited by the poor low frequency performance of the windows with this combination of glass and air space.
Taped Not Taped
Type Construction
Test ID OITC Test ID OITC
Double slider Vinyl TLA-99-159a 24 TLA-99-157a 23 Casement Vinyl clad
wood
TLA-99-175a 26 TLA-99-173a 25
Casement Wood TLA-99-163a 25 TLA-99-161a 25
Slider Vinyl TLA-99-151a 25 TLA-99-149a 25
Casement Vinyl TLA-99-145a 25 TLA-99-143a 25
Casement Aluminum TLA-99-179a 24 TLA-99-177a 23
Table 1. Summary of the 6 window units that were tested for seals taped or not taped.
There are some detailed differences among the six results in Figure 25. There is a dip at 250 Hz for 4 of the 6 windows as observed for the double glazing units in Figure 24. However, for the results of the two sliding windows this dip appears to be one band higher at 315 Hz. There are larger differences at higher frequencies. Above 500 Hz the aluminum casement window and the two sliding windows tend to have inferior
performance. However, the wood casement window, the vinyl casement window and the vinyl clad wood casement window had quite similar higher frequency performance that was superior to the other windows.
10 20 30 40 50 63 125 250 500 1k 2k 4k Frequency, Hz TL, dB
TLA-99-159a -vinyl double slider TLA-99-175a -vinyl clad casement TLA-99-163a -wood casement TLA-99-151a -vinyl slider TLA-99-145a -vinyl casement TLA-99-179a -aluminum casement
Test ID Description OITC
TLA-99-159a vinyl double slider 24
TLA-99-175a vinyl clad casement 26
TLA-99-163a wood casement 25
TLA-99-151a vinyl slider 25
TLA-99-145a vinyl casement 25
TLA-99-179a aluminum casement 24
Figure 25. Comparisons of measured sound transmission loss values versus 1/3 octave band frequency for 6 operable windows with all seals taped.
The comparisons shown in Figure 26 indicate that two of the windows seemed to have inferior window seals. Tests of the vinyl double slider showed it to be quite inconsistent. Pushing on the window prior to a test could significantly change the results. The
aluminum casement window also had obviously decreased performance when the seals were not taped. In spite of their considerably degraded higher frequency performance the overall OITC ratings only decreased by 1 OITC point. Thus, window seals can degrade the overall performance, but even the windows with better seals are poor barriers to aircraft noise because the combination of glass and air space does not allow for improved low frequency sound insulation.
10 20 30 40 50 63 125 250 500 1k 2k 4k Frequency, Hz TL, dB
TLA-99-157a -vinyl double slider TLA-99-173a -vinyl clad casement TLA-99-161a -wood casement TLA-99-149a -vinyl slider TLA-99-143a -vinyl casement TLA-99-177a -aluminum casement
Test ID Description OITC
TLA-99-157a vinyl double slider 23
TLA-99-173a vinyl clad casement 25
TLA-99-161a wood casement 25
TLA-99-149a vinyl slider 25
TLA-99-143a vinyl casement 25
TLA-99-177a aluminum casement 23
Figure 26. Comparisons of measured sound transmission loss values versus 1/3 octave band frequency for 6 operable windows with all seals not taped.
4.3 Benefits of storm windows.
Although improved windows can be designed having thicker layers of glass and larger air spaces between the two layers of glass, this can be an expensive option where otherwise satisfactory windows already exist. The incremental effect of adding a conventional aluminum storm widow was tested to evaluate this less expensive renovation technique for improved sound insulation. The aluminum storm window unit was added to three of the windows. In each case there was no attempt to tape any of the window seals.
Table 2 below gives the resulting OITC ratings for the windows with and without an additional storm window. In most cases the storm window unit was simply added to the outside of the window frame creating a 25 mm air space between the glass of the storm window and that of the main window. For the aluminum casement window the frame
was also built out to create a 76 mm air space between the glass of the storm window and that of the main window. The results in Table 2 show that adding the storm window with a 25 mm air space increased the overall OITC rating by 1 to 4 OITC points. Adding the storm window with a 76 mm air space increased the OITC rating of the aluminum casement window from 23 to 30.
Window Window Not
Taped Window + Storm, 25 mm air space Window + storm, 76 mm air space Aluminum casement 23 25 30 Vinyl slider 25 26 Double slider 23 27
Table 2. OITC ratings of the windows with and without added storm windows.
The measured values of sound transmission loss versus frequency for the aluminum casement window with and without an added storm window are given in Figure 27. Adding a storm window with a 25 mm air space leads to a useful improvement in the mid- and high-frequency sound transmission loss. Adding the storm window with a 76 mm air space causes this improvement to extend to lower frequencies. If one calculates the expected mass-air-mass resonance frequency for 13, 25 and 76 mm air spaces, the resonance frequency decreases from approximately 270 to 200 and to 110 Hz with the increasing air space. Clearly an even larger air space would lead to further improvements.
10 20 30 40 50 63 125 250 500 1k 2k 4k Frequency, Hz TL, dB
TLA-99-177a -no storm window TLA-99-185a -storm window at 25 mm TLA-99-187a -storm window at 76 mm
Test ID Description OITC
TLA-99-177a no storm window 23
TLA-99-185a storm window at 25 mm 25
TLA-99-187a storm window at 76 mm 30
Figure 27. Comparisons of measured sound transmission loss values versus 1/3 octave band frequency for the aluminum casement window with and without an added storm window.
Adding the storm window with only a 25 mm air space leads to small improvements in the overall OITC rating because the low frequency performance of the window is not greatly improved. That is, there is little improvement in the low frequency region where the sound transmission loss of the original window is least satisfactory to begin with. The effect of the storm window with a 25 mm air space is explored further in Figure 28. This figure shows the difference in measured sound transmission loss values when the storm window was added with a 25 mm air space to three different windows. For all three windows the incremental effects are quite similar with modest improvements at higher frequencies and some small negative improvements at lower frequencies. That is at around 125 Hz the added storm window degrades the performance of the original window for this case of a 25 mm air space. Adding a storm window can be an
economical technique for improving the overall sound insulation of a window. However, to provide significantly improved sound transmission loss the air space between the original window and the added storm window should be 76 mm or more.