Publisher’s version / Version de l'éditeur:
Vous avez des questions? Nous pouvons vous aider. Pour communiquer directement avec un auteur, consultez la première page de la revue dans laquelle son article a été publié afin de trouver ses coordonnées. Si vous n’arrivez pas à les repérer, communiquez avec nous à PublicationsArchive-ArchivesPublications@nrc-cnrc.gc.ca.
Questions? Contact the NRC Publications Archive team at
PublicationsArchive-ArchivesPublications@nrc-cnrc.gc.ca. If you wish to email the authors directly, please see the first page of the publication for their contact information.
https://publications-cnrc.canada.ca/fra/droits
L’accès à ce site Web et l’utilisation de son contenu sont assujettis aux conditions présentées dans le site LISEZ CES CONDITIONS ATTENTIVEMENT AVANT D’UTILISER CE SITE WEB.
IOP Conference Series: Materials Science and Engineering, 609, 3, pp. 1-7,
2019-11-23
READ THESE TERMS AND CONDITIONS CAREFULLY BEFORE USING THIS WEBSITE. https://nrc-publications.canada.ca/eng/copyright
NRC Publications Archive Record / Notice des Archives des publications du CNRC :
https://nrc-publications.canada.ca/eng/view/object/?id=37fe94cb-bd11-4f7e-b229-3eae129c2285 https://publications-cnrc.canada.ca/fra/voir/objet/?id=37fe94cb-bd11-4f7e-b229-3eae129c2285
NRC Publications Archive
Archives des publications du CNRC
This publication could be one of several versions: author’s original, accepted manuscript or the publisher’s version. / La version de cette publication peut être l’une des suivantes : la version prépublication de l’auteur, la version acceptée du manuscrit ou la version de l’éditeur.
For the publisher’s version, please access the DOI link below./ Pour consulter la version de l’éditeur, utilisez le lien DOI ci-dessous.
https://doi.org/10.1088/1757-899X/609/3/032021
Access and use of this website and the material on it are subject to the Terms and Conditions set forth at
Residential balanced ventilation and its impacts on indoor pressure,
ventilation and IAQ
IOP Conference Series: Materials Science and Engineering
PAPER • OPEN ACCESS
Residential balanced ventilation and its impacts on indoor pressure,
ventilation and IAQ
To cite this article: B Ouazia et al 2019 IOP Conf. Ser.: Mater. Sci. Eng. 609 032021
View the article online for updates and enhancements.
Content from this work may be used under the terms of theCreative Commons Attribution 3.0 licence. Any further distribution of this work must maintain attribution to the author(s) and the title of the work, journal citation and DOI.
Published under licence by IOP Publishing Ltd
IAQVEC
IOP Conf. Series: Materials Science and Engineering 609 (2019) 032021
IOP Publishing doi:10.1088/1757-899X/609/3/032021
1
Residential balanced ventilation and its impacts on indoor
pressure, ventilation and IAQ
B Ouazia1,*, D Won1, D Aubin1, C Arsenault1, S So1, W Yang1
1 National Research Council Canada, Ottawa, Ontario, Canada * Boualem.ouazia@nrc-cnrc.gc.ca
Abstract. This paper presents results from a project on the assessment of the indoor air quality (IAQ) benefits
that might accrue from the use of a balanced ventilation system. The study compared the whole-building pressure, IAQ and ventilation performance of energy recovery ventilation (exhausting from kitchen and bathrooms) with that of exhaust-only ventilation (continuous exhaust from master bathroom). The side-by-side comparisons included various indoor mixing scenarios (no mixing, partial mixing and continuous mixing) using the NRC’s twin research houses. The side-by-side testing showed that balanced ventilation (energy recovery ventilation) was superior as a whole-house ventilation strategy, compared to unbalanced ventilation (single-point exhaust ventilation). It was superior because of the positive indoor pressure (1 to 3 Pa), higher air change rate (6% to 34%), uniform inter-zonal air flows, lower concentration of formaldehyde (by 37% to 70% in winter and 6% to 34% in summer), lower concentration of VOCs in winter (alpha-Pinene by 26% to 89% / Toluene-d8 (dTol) by 8% to 76%) and in summer (α-Pinene by 87% to 339% / Toluene-d8 by 45% to 88% / Heptane by 40% to 91% / Benzaldehyde by 35% to 406%), and as expected lower whole-house heating/cooling and ventilation energy consumption by up to 8.5%.
1. Introduction
A residential building’s indoor air can theoretically contain various types of contaminants to which the occupants could be exposed. The combination of air-sealed building enclosures and controlled mechanical ventilation is an effective means to reduce energy consumption while providing improved IAQ and comfort in residential buildings. Ventilation is the process of supplying air and/or removing air from a space for the purpose of controlling air contaminants levels, humidity, or temperature. It is an important contributor to the health and comfort of an indoor environment. While source control is an essential first step toward limiting exposure to indoor pollutants, adequate ventilation (paired with infiltration) is a critical means of establishing and maintaining IAQ. Adequate ventilation and efficient air distribution are a prerequisite for acceptable IAQ. Air entering the building is usually a mixture of ventilation supply air – which is the desired portion – and the infiltrating air, which is caused by the outside weather conditions and the frequent negative pressure in the home [1]. When investigating pressure differences between a home and outdoor, or between a home and attached garage, we usually find only small differences up to around five Pascals. Even very small differences of a few Pascals are enough to generate airflows between indoors and outdoors (outdoor, garage, attic, etc.). These airflows can transport contaminants adjacent zones where the IAQ is unknown. Canadian homes are often at negative indoor pressure relative to their attached garages and the ambient air, particularly during the winter. The negative pressure differential may be due in part to the use of unbalanced mechanical ventilation systems. Therefore, it is deemed important to balance ventilation in residential homes to prevent areas from being pressurized or depressurized and this could be achieved by using a heat or energy recovery ventilation system. This balancing reduces opportunities for contaminant transport between the home’s adjoining spaces. An NRC research team initiated this research project to
IAQVEC
IOP Conf. Series: Materials Science and Engineering 609 (2019) 032021
IOP Publishing doi:10.1088/1757-899X/609/3/032021
2
demonstrate and quantify the potential IAQ-related benefits of using balanced ventilation system. This study is intended to help better understanding of whole-building ventilation system effectiveness and distribution in R-2000 homes, which is critical to promoting the best IAQ, low-energy and high value ventilation solutions. The study is an experimental investigation comparing exhaust-only ventilation and a balanced energy recovery ventilation in a side-by-side testing using a twin-detached houses in Ottawa, Ontario at the National Research Council Canada. This paper presents some results from both heating and cooling seasons side-by-side testing periods.
2. Experimental method
The Canadian Centre for Housing Technology (CCHT) twin houses and the side-by-side testing methodology enabled a whole-house evaluation of the IAQ impact of balanced (ERV) ventilation as compared to exhaust-only ventilation in a Canadian context. A series of experiments were performed to obtain data for two residential ventilation systems (balanced ventilation system and exhaust-only ventilation system) with and without mixing. The criteria of performance used included, (1) building air leakage characterization (fan depressurization tests), (2) HVAC characterization (ventilation systems airflows), (3) building pressure characterization (differential pressure to outdoor, attic and garage), (4) perfluorocarbon (PFT) tracer gas tests (house and zone air change rates), (5) aldehyde and Volatile Organic Compound (VOC) sampling, and (6) whole-house energy consumption.
2.1. CCHT Houses
The CCHT [2] features twin research houses to evaluate the whole-house performance of new technologies in side-by-side testing. The twin houses are a typical 2–storey wood-frame house, with 210 m2 liveable area, built to the R-2000 standard. A single centrally located programmable thermostat controls both the space heating and cooling systems. At time of construction, the house had an air tightness characteristic of 1.5 ach @ 50 Pa – 30% below the R-2000 requirement. An important and unique feature of the twin house facility is the simulated occupancy system, with over 60 on/off events per day. The system is based on home automation technology and simulates the activities of a family of two adults and two children. Simulated events included the operation of major appliances (dishwasher, stove, washer & drier), lights, and water draws (shower, bath, kitchen sink). Incandescent bulbs were used to simulate heat gains from humans (60 W per adult, 40 W per child) at various locations in the house. The CCHT research houses are equipped with a data acquisition system (DAS) consisting of over 250 sensors and 23 meters (gas, water and electrical), reading the sensors every 5 minutes and provides hourly averages. The DAS captures a clear history of the house performance in terms of temperature, humidity and energy consumption and a complete set of weather data available from a nearby weather station.
2.2. Side-by-side testing
The CCHT houses are identical with ERV’s operating in both houses. The houses were modified by incorporating an exhaust fan installed in the master bathroom (MBR) of both houses. The existing ERVs were installed as partially dedicated systems with direct connection of ERV supply air stream to the Furnace return plenum and stale air exhausted from kitchen and bathrooms. A series of experiments were performed to obtain data for two residential ventilation systems, one balanced ventilation using an ERV and one unbalanced ventilation using exhaust-only, either with or without mixing. Experiments were also performed to obtain data for the two houses without mechanical ventilation as baseline comparison of the ventilation systems. Four side-by-side comparisons have been evaluated. Baseline Test conducted to benchmark all measured parameter with no ventilation and space conditioning systems operating, and where all intake and exhaust vents were sealed externally.
Mechanical Ventilation Test with Partial Mixing conducted with central air distribution mixing
system, with central system fan cycle of 48 minutes OFF and 12 minutes ON. Mechanical Ventilation
Test without Mixing conducted without central air distribution mixing system (furnace fan OFF and
goes ON only when there is call for heating). Mechanical Ventilation Test with Continuous Mixing conducted with central air distribution mixing system (furnace fan ON at low speed and goes on high speed when there is call for cooling). Daily run time for mechanical systems was continuous for ERV
IAQVEC
IOP Conf. Series: Materials Science and Engineering 609 (2019) 032021
IOP Publishing doi:10.1088/1757-899X/609/3/032021
3
and exhaust-only fan from master bathroom. The furnace fan operation varied from not operating and ON only when there is a call for heating or cooling (AUTO MODE), partial operation (cycling between 48 mins OFF and 12 mins ON) and continuous at low speed and at high speed when there is a call for heating or cooling).
Table 1. Side-by-side experimental design.
Test # Type House 1 (M24-B) House 2 (M24-C)
1 Baseline No mechanical ventilation No mechanical ventilation
2 Partial mixing Exhaust ON / ERV OFF ERV ON / Exhaust OFF
3 Partial mixing ERV ON / Exhaust OFF Exhaust ON / ERV OFF
4 No mixing ERV ON / Exhaust OFF Exhaust ON / ERV OFF
5 No mixing Exhaust ON / ERV OFF ERV ON / Exhaust OFF
6 Continuous mixing Exhaust ON / ERV OFF ERV ON / Exhaust OFF
7 Continuous mixing ERV ON / Exhaust OFF Exhaust ON / ERV OFF
The exhaust ventilation flow rate from master bathroom was adjusted to meet the required ventilation rate set by ASHRAE Standard 62.2 [3] calculated for the size of the CCHT houses and set at 95 cfm for both exhaust fan and ERV.
2.3. Performance and measurements
The testing approach was a combination of air leakage characterization (fan depressurization tests), envelope differential pressures (with respect to outdoor, attic and garage), perfluorocarbon tracer gases (PFT’s) to determine zone air change rates, multi-zone sampling of VOCs and aldehydes to determine the indoor air quality impacts as function of the ventilation system operation, and finally impact on whole building energy consumption. The ambient test conditions, such as flow rates through ventilation system components (exhaust fan and ERV), temperature distributions in various zones throughout the house and weather conditions were continuously monitored and recorded during each test to establish the complete experimental context for each test’s results. Airtightness is the fundamental house property that impacts infiltration (movement of air through leaks, cracks, or other adventitious openings in the building envelope). It was necessary to characterize the airtightness of the two houses. This was accomplished by conducting a fan depressurization test using an orifice blower door according to the ASTM test method E 779-03 [4]. The blower tests were done during the baseline test to confirm that the two houses have similar air leakage for accurate comparisons in term of the impact of ventilation strategy on the IAQ. The house’s indoor pressure was characterized by continuously measuring the differential house envelope pressures using bi-directional Veris PX Series differential pressure transducer sensors with data loggers. The differential pressures were measured on all floors (basement, first floor and second floor) in designated zone and facades with respect to outside, garage and attic.
A passive Perfluorocarbon Tracer (PFT) gas method [5] was used to measure the air change rates and inter-zonal flow values in both houses. For all tests cases described in Table 1, six unique PFTs were released in different zones of the house (garage, attic, master bedroom, second bedroom, kitchen/living area and basement) expected to behave as reasonably well-mixed zones. Each zone contained two or three tracer gas emitters and at least one sampler tube (CATS – capillary adsorption tube). For each test, identical tracers were used in the same zones. The temperature in each zone was recorded to allow for adjustment of the temperature dependent source release rate and CATS uptake rate. In addition to PFTs, three VOCs α-pinene (aPin), deuterated toluene (tolune-d8; dTol) and heptane (Hep) were deployed to determine the difference in indoor air quality for different ventilation settings. The actual source rate was determined based on the weight difference of a source before and after each test. PFT sources were placed in four zones (basement, 1st floor, 2nd floor, and master bedroom). PFTs and VOCs were sampled with sorbent tubes filled with Carbopack B (CB). CB tubes were deployed in duplicates in each zone (basement, 1st floor – kitchen, 2nd floor – bedroom 2 and master bedroom) for passive sampling with the sampling side tubes left open for 7 days. CB tubes were analyzed by NRC’s analytical chemistry laboratory with the thermal desorption/gas chromatography/mass spectrometry (TD/GC/MS) system. Formaldehyde (HCHO) passive sampling was conducted in the basement (unfinished), main floor (dining area), master bedroom (second floor),
IAQVEC
IOP Conf. Series: Materials Science and Engineering 609 (2019) 032021
IOP Publishing doi:10.1088/1757-899X/609/3/032021
4
attic, garage and outdoor of each house and during the 7 test cases. Formaldehyde/Aldehydes passive sampling was done using three 2, 4-dinitrophenylhydrazine (DNPH) cartridges; one for field blank and two for duplicate samples. Two openings of cartridges were left open for 7 days. At the end of the sampling period, the DNPH cartridges were sent to NRC’s chemical lab for analysis. Changes in house performance due to the two ventilation systems were also addressed through comparison of energy, in addition to ventilation and IAQ of the two houses. The recorded whole-houses energy consumptions included; heating energy consumption (furnace natural gas consumption), furnace fans electrical consumption, exhaust fans electrical consumption and dual core ERV fans electrical consumption.
3. Results and analysis
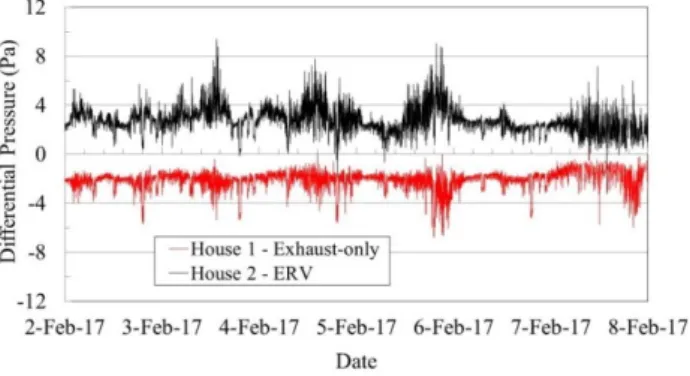
The ACH50 value is the number of air changes that will occur in one hour with a 50 Pa pressure difference being applied uniformly across the building envelope. The measured ACH50 values were 1.79 h-1 in House 1 and 1.73 h-1 in House 2. The airtightness of both research houses is essentially the same, with a 3.4% difference. The ERVs installed in both houses were well balanced and the exhaust fans in master bathrooms (in both houses) were set to continuously exhaust the same airflow as the ERV units. This study included measurement of the envelope differential pressure between the indoor and the outdoors. A positive reading of the indoor pressure means that the indoor is pressurized and a negative value means the house is depressurized. The differential pressures were measured for all tested cases and a typical weekly plot for test 5 done with no mixing is presented in Figure 1. The measured average envelope differential pressures to outdoor (including adjacent zones) and to only outdoor (excluding attic and garage) are presented in Table 2 and Table 3.
Figure 1. House differential pressures from Test 5.
Table 2. Average measured indoor pressures to outdoor (including adjacent zones).
House Test 1 Test 2 Test 3 Test 4 Test 5 Test 6 Test 7
M24-B (Baseline) +0.6 (Exhaust) -1.5 (ERV) +0.7 (ERV) +0.8 (Exhaust) -1.8 (Exhaust) -2.5 (ERV) +0.2 M24-C (Baseline) +0.7 (ERV) +2.8 (Exhaust) -1.3 (Exhaust) -0.9 (ERV) +2.8 (ERV) +0.3 (Exhaust) -1.6
Table 3. Average measured indoor pressures to outdoor (excluding adjacent zones).
House Test 1 Test 2 Test 3 Test 4 Test 5 Test 6 Test 7
M24-B (Baseline) +0.5 (Exhaust) -2.9 (ERV) +1.0 (ERV) +1.2 (Exhaust) -2.4 (Exhaust) -2.5 (ERV) +0.1 M24-C (Baseline) +0.3 (ERV) +2.2 (Exhaust) -1.7 (Exhaust) -1.4 (ERV) +2.8 (ERV) +0.1 (Exhaust) -1.3
Except for Baseline test where the two houses were without mechanical ventilation, the results for all tests with mechanical ventilation have shown that the house with an ERV had an overall indoor positive pressure showing that the house was slightly pressurized. The house with an exhaust-only had an overall indoor negative pressure, showing that the house was depressurized.
The source emission rates for all PFTs and VOCs were the same. The concentrations of PFTs and VOCs measured in all tests deployed outside master bedroom were relatively homogeneous in three
IAQVEC
IOP Conf. Series: Materials Science and Engineering 609 (2019) 032021
IOP Publishing doi:10.1088/1757-899X/609/3/032021
5
floors, except in MBR with door to the rest of the house closed and door to the master bathroom where the exhaust-only fan is installed open, showing much higher concentration compared to other locations. This shows that chemicals from other parts of the house were transported to MBR, but chemicals generated in MBR were removed with limited mixing into the house. Therefore, it was considered that the house was relatively well mixed except for MBR. The concentrations of PFTs and VOCs deployed outside the MBR were higher in the house with exhaust-only ventilation compared to those in the house with ERV, regardless of mixing conditions. It indicates that the air quality in a house with ERV was better than that in a house with exhaust-only ventilation. The air change rates calculated from the PFT concentrations and emission rates (assuming the house is well-mixed single zone) and the percent difference between tested ventilation systems are presented in Table 4.
Table 4. Air change rate (h-1) for a whole-house.
House Test 1 Test 2 Test 3 Test 4 Test 5 Test 6 Test 7
M24-B (Baseline) 0.06 (Exhaust) 0.28 (ERV) 0.34 (ERV) 0.38 (Exhaust) 0.38 (Exhaust) 0.19 (ERV) 0.22 M24-C (Baseline) 0.07 (ERV) 0.33 (Exhaust) 0.29 (Exhaust) 0.36 (ERV) 0.49 (ERV) 0.28 (Exhaust) 0.14
Percent Difference1 9% 15% 16% 6% 28% 47% 58%
1 (ACHERV – ACHEXH)/ACHEXH*100
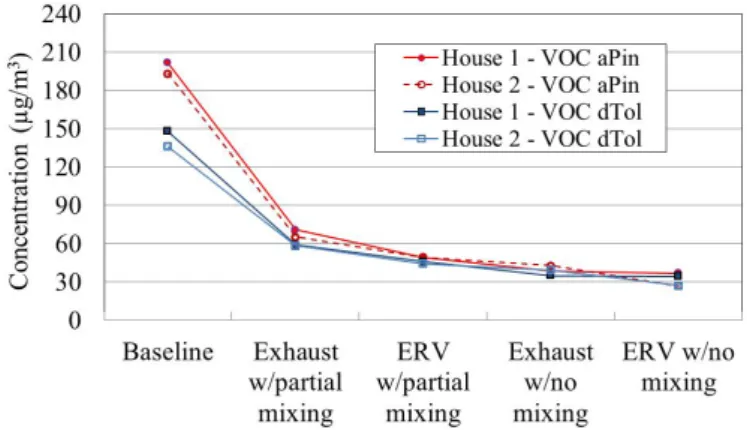
The baseline test (Test 1) shows that the air change rates in both houses were similar under the same conditions, i.e., when there was no ventilation and no mixing. The air change rate in the house with ERV was greater than that with exhaust-only ventilation by 6 to 28% in heating season 2016/17 regardless of the mixing condition (no or partial mixing), and by 47 to 58% in cooling season 2017. The whole-house mean concentration of the two deployed VOCs, α-pinene (aPin) and deuterated toluene (tolune-d8; dTol), measured during Baseline and the four winter side-by-side tests are illustrated graphically in Figure 2. All tested ventilation systems reduced the aPin and dTol concentrations below the Baseline concentrations, which were roughly 5-7 times higher. ERV system with no mixing reduced the indoor aPin and dTol concentrations the most. For both houses operated with an ERV (balanced ventilation) system regardless of the mixing conditions (no mixing, partial mixing) showed a 14% to 31% reduction in aPin concentration and a 13% to 29% reduction in dTol concentration over exhaust-only (unbalanced) ventilation system.
Figure 2. Average indoor α-pinene and deuterated toluene concentration by ventilation system type. The whole-house mean indoor concentrations of Formaldehyde by ventilation system are illustrated graphically in Figure 3. The measured outdoor formaldehyde concentrations beside the twin houses located in Ottawa were 2.4-2.6 μg/m3. All tested ventilation systems reduced the formaldehyde concentration below the Baseline concentration, which was roughly 14 times higher than measured outdoor. Exhaust-only ventilation reduced the indoor formaldehyde concentration the least, regardless of the mixing condition (no mixing, partial mixing). However, ERV without mixing showed a significant reduction in formaldehyde concentration over ERV with partial mixing because ERV exhausted un-mixed stale air directly from kitchen and bathroom on the Main floor and bathrooms in on the Second floor. Balanced ventilation (ERV) system reduced the indoor formaldehyde
IAQVEC
IOP Conf. Series: Materials Science and Engineering 609 (2019) 032021
IOP Publishing doi:10.1088/1757-899X/609/3/032021
6
concentration for all tests regardless of mixing condition or heating/cooling season by 6% to 85% over exhaust-only (unbalanced) ventilation system. The highest reduction of formaldehyde was seen during Tests 4 and 5 done with houses operating without mixing.
Figure 3. Average indoor Formaldehyde concentration by ventilation system type.
Whole-house energy analysis took into account the small difference in energy performance of the twin houses when both are operating under benchmark conditions, with an ERV. The expected whole-house space heating and ventilation consumption in benchmark configuration (i.e. expected consumption if operating the benchmark ERV) was calculated first then from this, the overall energy saving when operating the house with exhaust-only is calculated. Savings was calculated by subtracting the measured whole-house energy consumption with exhaust-only experiment consumption from the calculated whole-house energy consumption with ERV benchmark consumption. The average weekly energy savings when operating the ERV compared to running the benchmark ERV for heating season varied between 3.6% to 8.5%, and for cooling season varied between 2 % to 3%, despite that the exhaust fan electrical use was less than the ERV electrical use. 4. Conclusions
The side-by-side testing showed that balanced ventilation system with ERV exhausting stale air directly from kitchen and bathrooms was superior to a single-spot exhaust ventilation system (exhaust from master bathroom), as a whole-house ventilation strategy with slightly positive indoor pressure, improved IAQ and energy saving (up to 8.5%). The PFT testing and analysis was required to compare the air change rates which were higher for a house operated with balance ventilation system by 6% to 28%. The ERV system showed a significant reduction in formaldehyde concentration over exhaust-only systems by 6% to 85% regardless of the mixing condition. In terms of VOCS, the ERV system showed also a significant reduction in deployed VOCs (aPin, dTol, Hep) concentrations over exhaust-only ventilation system, 14% to 339% in aPin, 13% to 88% in dTol, 40% to 91% in Hep and 35% to 406% in BenzA. The study also confirmed that a balanced ventilation system is more energy efficient with a weekly energy savings between 3.9% and 8.5%. This research provides justification for the installation of a balanced ventilation system in homes and supports credit for fully distributed whole-building ventilation systems.
References
[1] Russel M 2005 LBNL 57730. Lawrence Berkeley national laboratory
[2] Canadian Centre for Housing Technology’s (CCHT) twin research houses operated by NRC, CMHC and NRCan (http://www.nrc-cnrc.gc.ca/eng/solutions/facilities/ccht.html)
[3] ASHRAE Standard 62.2 2017 Ventilation and Acceptable Ondoor Air Quality in Low-Rise
Residential Buildngs
[4] ASTM 2003 American Society for Testing and Materials’ Test Method E 779-03
[5] Russell N Dietz and Edgar A. Cote 1982 Air filtration measurements in a home using a
convenient perfluorocarbon tracer technique. Department of Energy and Environment,