Publisher’s version / Version de l'éditeur:
Vous avez des questions? Nous pouvons vous aider. Pour communiquer directement avec un auteur, consultez la première page de la revue dans laquelle son article a été publié afin de trouver ses coordonnées. Si vous n’arrivez pas à les repérer, communiquez avec nous à PublicationsArchive-ArchivesPublications@nrc-cnrc.gc.ca.
Questions? Contact the NRC Publications Archive team at
PublicationsArchive-ArchivesPublications@nrc-cnrc.gc.ca. If you wish to email the authors directly, please see the first page of the publication for their contact information.
https://publications-cnrc.canada.ca/fra/droits
L’accès à ce site Web et l’utilisation de son contenu sont assujettis aux conditions présentées dans le site
LISEZ CES CONDITIONS ATTENTIVEMENT AVANT D’UTILISER CE SITE WEB.
Research Report (National Research Council of Canada. Construction),
2014-10-24
READ THESE TERMS AND CONDITIONS CAREFULLY BEFORE USING THIS WEBSITE. https://nrc-publications.canada.ca/eng/copyright
NRC Publications Archive Record / Notice des Archives des publications du CNRC :
https://nrc-publications.canada.ca/eng/view/object/?id=80bf4868-5f78-439c-a6de-c5c94cd51586 https://publications-cnrc.canada.ca/fra/voir/objet/?id=80bf4868-5f78-439c-a6de-c5c94cd51586
NRC Publications Archive
Archives des publications du CNRC
For the publisher’s version, please access the DOI link below./ Pour consulter la version de l’éditeur, utilisez le lien DOI ci-dessous.
https://doi.org/10.4224/21275339
Access and use of this website and the material on it are subject to the Terms and Conditions set forth at
Characterization of fires in multi-suite residential dwellings: summary
report
Characterization of Fires in Multi-Suite Residential
Dwellings
Summary Report
Project Title: Characterization of Fires in Multi-Suite Residential
Dwellings
Authors:
Alex Bwalya, Eric Gibbs, Gary Lougheed,
Ahmed Kashef
Date:
24
thOctober, 2014
Construction Portfolio
Fire Safety
i
i
Preface
This report summarizes the research work conducted in the Characterization of Fires in Multi-Suite Residential Dwellings (CFMRD) project.
The CFMRD project was a collaborative undertaking with industry, provincial governments and city authorities that was initiated by NRC-IRC in 2006 to study fires in low-rise multi-suite residential dwellings of light-frame construction. The project was undertaken due to the need to:
a) Address the lack of realistic design fires, which are required to aid the development of methods for achieving performance-based solutions to fire problems, and;
b) Further the understanding of how fires in residential buildings sometimes cause fatalities and substantial property losses, as revealed by fire statistics.
The CFMRD project focused on fires in dwellings, such as apartments, semi-detached houses, duplex houses, townhouses or row houses, secondary suites and residential care facilities as these fires have a potentially greater impact on adjacent suites. To this end, the fully-developed phase of a fire was of particular interest since there is a greater potential for the building assemblies
enclosing the room of fire origin to be damaged by high temperatures during this period. The main objectives of the project were:
1. To conduct fire experiments to characterize fires originating in various living spaces within multi-suite dwellings.
2. To conduct numerical simulations of various fire scenarios in order to interpolate and extend the data beyond that obtained in the experimental studies.
3. To produce a set of realistic design fires for multi-suite dwellings from the test data. 4. To develop an analytical method that can be used to calculate design fires for
multi-suite dwellings.
The research approach employed in the project utilized literature reviews, surveys to determine typical configurations and combustibles, computer simulations and fire experiments. In Phase 1 of the project, fire experiments were conducted in a room calorimeter to determine the combustion
characteristics of individual typical household furnishings found in living spaces that have a high incidence of fires. In Phase 2, fire experiments were conducted in fully-furnished rooms simulating residential bedrooms, a living room, a main floor, a secondary suite and a residential care bedroom.
ii
ii
Numerical modelling of fire development, using suitable fire models, was conducted in Phase 1 to assist in the design and instrumentation of the full-scale fire experiments as well as to study the effect of various parameters, such as the ventilation conditions and geometry on the development of the fire.
NRC gratefully acknowledges the financial and technical support of the Project Consortium, which consisted of representatives from the following participating organizations:
Canadian Automatic Sprinkler Association
Canadian Concrete Masonry Producers Association Canadian Furniture Manufacturers Associations The Canadian Wood Council
City of Calgary - Development and Building Approvals City of Calgary - Fire Department
FPInnovations Gypsum Association Masonry Worx
Ontario Ministry of Municipal Affairs and Housing
Ontario Ministry of Community Safety and Correctional Services (Office of the Fire Marshal) Régie du Bâtiment du Québec
iii
iii
Abstract
This report summarizes the research work that was conducted in the Characterization of Fires in Multi-Suite Residential Dwellings (CFMRD) project. The CFMRD project was a collaborative undertaking with industry, provincial governments and city authorities that was initiated by NRC Construction in 2006 to study fires in low-rise multi-suite residential dwellings of light-frame construction. The project focused on fires that can occur in apartments, semi-detached houses, duplexes, row houses, secondary suites, and residential care facilities, since these types of fires have a potentially greater impact on adjacent suites.
The research approach employed in the project utilized literature reviews, surveys (to determine typical configurations and combustibles), computer simulations and fire experiments. Bench-scale cone calorimeter tests and full-scale fire tests were conducted to determine the combustion
characteristics of typical household furnishings found in living spaces that have a high incidence of fires. The furnishings were individually tested in a room calorimeter (Phase 1) and collectively tested in realistically furnished and well-instrumented simulated residential rooms (Phase 2). Numerical modelling of fire development, using the NIST Fire Dynamics Simulator (FDS), was conducted at various stages to assist in the design and instrumentation of the full-scale fire tests as well as to study the effect of various parameters, such as the ventilation conditions, geometry, and fire load (density and composition) on the development of the fires. Finally, analytical work was carried out to:
a) Evaluate the use of existing methods for calculating quantities such as time to flashover, ventilation-controlled heat release rate (HRR), post-flashover fire temperatures and duration of the fully-developed phase (onset of decay).
b) Develop and propose methods for calculating fire properties where existing methods were inadequate.
In the survey, typical furnishings that constituted a significant portion of the movable fire load were identified and values of fire load densities were calculated for rooms such as: kitchens, dining rooms, living rooms and bedrooms. The average fire load densities in various rooms were estimated to be: kitchens - 807 MJ/m2; dining rooms - 393 MJ/m2; living rooms - 412 MJ/m2;
iv
iv
594 MJ/m2. Although kitchens had the highest fire load density the actual fire load (heat content) was found to be lower than that for bedrooms, which had higher values due to their larger floor area and high calorific value due to the presence of furnishings, such as mattresses and carpeting. In Phase 1 of the project, 36 experiments were conducted to determine the burning characteristics of typical residential furnishings, particularly those that are frequently first-ignited items, such as upholstered seating furniture and beds. The experimental facility included a 16 m2 test room with a window opening, which represented an average-sized living room or bedroom in a multi-family dwelling. The furnishings tested included: mattresses, bedclothes, bed assemblies, upholstered seating furniture, clothing arrangements, books, plastic audio and video media and storage cases, toys, shoes and a computer workstation configuration. Numerous instruments were placed
throughout the test facility to measure the HRR, heat flux, temperature, and fire effluent (smoke density and concentration of gaseous combustion products such as carbon dioxide and carbon monoxide).
The experiments in Phase 1 showed that variations in the configuration of a bed assembly (e.g. bunk bed vs. mates’ bed vs. a standard posture box configuration) and the amount of polyurethane foam (PUF) affected the rate of fire growth and intensity of the resulting fires, as well as the time to reach flashover conditions in the test room. Twin-size mattresses produced peak HRRs of
approximately 3,800 kW and the maximum room temperature was approximately 980°C. The HRRs of bed assemblies of various sizes and configurations ranged from 1,800 kW for a twin bed, to 6,250 kW for a bunk bed. The maximum temperature and heat flux recorded in the experiments
were 1,071°C and 221 kW/m2, respectively. Upholstered chairs and sofas had HRRs ranging from
630 kW for an ottoman, to 3,360 kW for a two-seat sofa. Temperatures were proportional to the peak HRR (and exposure time) given that the room dimensions and wall lining materials remained constant.
In Phase 2, the findings from Phase 1 were used to design and conduct 14 highly structured full-scale tests in a one-storey test facility that was designed to represent a single storey of a multi-family dwelling, such as a main floor or second storey, having a floor area of approximately 48 m2. This permitted a flexible array of test configurations simulating fully furnished bedrooms, living rooms, main floor, a secondary suite and a residential care bedroom. The main floor is considered to be the floor with the main entrance to the dwelling that is at or nearest to the ground level. The main floor usually contains the kitchen and living room areas.
v
v
Flashover typically occurred in less than five minutes. It occurred in as little as 140 seconds in fires started with a strong flame in highly combustible furnishings, such as sofas and beds. The mean maximum hot layer temperature for all of the tests was 1,110
°
C (with a standard deviation of 54°
C) taken over an average post-flashover period of 1,020 s (and standard deviation of 252 s).Instantaneous peak temperatures in the range of 1,050
°
C to 1200°
C were recorded shortly afterflashover had occurred.
It was found that there were considerable differences in HRR profiles, and peak values varied widely for the resulting post-flashover fires since the HRR is a strong function of ventilation, among other variables such as fuel load composition. For instance, peak HRR values varied from
2,793 kW to 9,230 kW (mean of 5,847 kW and standard deviation of 2,122 kW), whereas the mean
maximum temperatures only varied from about 1,036
°
C to 1,203°
C.One of the main conclusions was that, in rooms lined primarily with gypsum board, regardless of other variables (such as, ventilation, fuel load, ignition method and room size), the mean maximum hot layer temperatures during the post-flashover period fell within a narrow range of approximately 1,050
°
C to 1200°
C. However, test variables and particularly ventilation, first-ignited-item and composition of the fuel load had a significant effect on the time of attainment and duration of the fully-developed phase (defined in this work as stage R4), during which the mean maximum temperature occurs. The mean maximum temperature during the fully-developed phase and the duration of stage R4 (over which it is calculated) are considered to be the appropriate measure of fire severity since temperature is the thermodynamic result of the HRR in a given room fire, while the duration defines the exposure time. Another main conclusion was that the primary bedroom scenarios within this research resulted in the most severe fire conditions of the scenarios tested since they had a large floor area and therefore contained the greatest amount of combustible materials.The one test incorporating a residential sprinkler system had a rapid extinguishment of the fire. The sprinkler activated within 50 seconds and the temperatures did not exceed 120
°
C. A fire starting in a oil-filled pot on the stove, in a layout simulating a main floor with a kitchen and living room,developed much more slowly (9 minutes to flashover) than one where the fire originated in a sofa in the same main floor configuration (3 minutes to flashover).
vi
vi
Extensive analytical work was carried out to evaluate selected existing correlations for calculating the growth phase, flashover, ventilation controlled HRR, post-flashover temperatures and fire duration against the test data. Further work was conducted to develop the basis of a computation model to calculate the peak temperature and the duration of the fully-developed phase. As a result, methods were proposed for calculating the time to reach the mean maximum temperature, duration of the post-flashover phase and the mean maximum temperature.
The results of this research provided valuable knowledge about the effect of key parameters such as window size and first-ignited-items on the outcome of the fire. The test results revealed that there was a significant variation in fire severity within a single room due to the complexity of the fire dynamics, which makes it difficult to completely describe the fires using average values of key fire properties. Therefore, it was concluded that the issue of prescribing or selecting a design fire required additional contextual details in order to select the appropriate combination of governing parameters, such as fire load density and composition, room size, ventilation settings and ignition scenario. However, the results from this research provide valuable insight into the interaction of governing parameters, their impact on the outcome of the fire and methods for calculating fire properties, as discussed in the analysis of results in Part 2 of the project report.
Finally, a web-based experimental fire data management application (the CFMRD database application) was developed for the management of experimental data generated from the project and potential public dissemination of the data. In addition to processing the raw data, the database application stores the raw and processed data, test photographs and videos, and other related documents in an Oracle database, and permits users to navigate the database using an internet browser. Users are able to view photographs, videos and graphs of the test results through specially designed web pages.
vii vii
Contents
1 Introduction ... 1 1.1 Research Objectives ... 1 1.2 Research Methodology ... 2 2 Survey of Dwellings ... 3 2.1 Conclusions ... 4 2.2 Reference Publications: ... 6 3 Computer Simulations ... 6 3.1 Reference Publications. ... 94 Phase 1 Tests: Combustion Characteristics of Individual Furnishings ... 11
4.1 Conclusions ... 13
4.2 Reference Publications ... 15
5 Phase 2 Tests – Post-flashover Room Fires ... 17
5.1 Test Wall Sections ... 22
5.2 Fuel Loads ... 25
5.3 Test Procedure ... 26
5.4 Results ... 26
5.5 Stages of Fire Development ... 27
viii
viii
6 Conclusions ... 33
6.1 Summary of Calculation Methods for Peak Temperature and Time to Peak ... 37
6.1.1 Duration of Stage R3 ... 38
6.1.2 Peak temperature in stage R4 ... 40
6.2 Scope for Future Research and Application of the Results ... 44
6.3 Reference Publications ... 45
7 Data Base of Experimental Results ... 46
7.1 Organization of the CFMRD Experimental Database ... 46
7.2 System Architecture ... 47
7.3 Appearance and Capabilities of the CFMRD Database Application... 48
8 Acknowledgments ... 51
9 References ... 53
Appendix A. List of CFMRD Publications 55
ix
ix
Abbreviations
CFMRD Characterization of Fires in Multi-Suite Residential Dwellings FL Fire load energy (MJ)
FLED Fire load energy density (MJ/m2)
GWB Gypsum board
HRR Heat Release Rate (kW/m2)
O.C. On center
OSB Oriented strand board
PCF Primary combustible furnishing PRF Post-flashover Room Fire PUF Polyurethane foam
SCF Secondary combustible furnishing
TC Thermocouple
Characterization of Fires in Multi-Suite Residential Dwellings
Summary Report
Alex C. Bwalya, Eric Gibbs, Gary Lougheed and Ahmed Kashef
1
Introduction
This report summarizes the research work carried out in the Characterization of Fires in Multi-Suite Residential Dwellings (CFMRD) project. The CFMRD project was a collaborative undertaking with industry, provincial governments and city authorities that was initiated by NRC Construction in 2006 to study fires in low-rise multi-suite residential dwellings of light-frame construction. The project was undertaken due to the need to:
a) Address the lack of realistic design fires, which are required to aid the development of methods for achieving performance-based solutions to fire problems, and
b) Improve the understanding of how fires develop in residential buildings.
The CFMRD project focused on fires in dwellings, such as apartments, semi-detached houses, duplex houses, townhouses or row houses, secondary suites and residential care facilities as these fires were believed to have a potentially greater impact on adjacent suites. The study was focused on three types of living spaces in a residential building – the living room, bedroom and kitchen – that statistically have been shown to have a high incidence of fatal fires. Although the project sought to study fires in all of the aforementioned areas, there was a greater focus on fires in bedrooms and living rooms, in which the first-ignited-item was a primary combustible furniture (PCF) item ignited by a flaming ignition source, since it was known beforehand that the resulting fires would develop rapidly to flashover and hence pose the greatest hazard to life safety and structural building elements than would fires originating in other areas containing largely secondary combustible furnishings (SCFs), such as kitchens, for instance. PCFs include items such as
upholstered seating furniture and bed assemblies, which have long been recognized as the main combustibles that constitute the frequently-first-ignited items in many fatal residential fires. SCFs consist of all other types of combustible contents, such as hard furniture, surface finishes (including flooring), clothing, paper and plastic articles that would be subsequently ignited at flashover and add fuel to a fire initiated by igniting a PCF. When PCFs are the first-ignited item, they are known to give rise to rapidly developing fires due to the flammability of the polyurethane foam (PUF) that is the dominant combustible constituent most often used in their manufacture.
1.1 Research Objectives
1. To conduct fire experiments to characterize fires originating in various living spaces within multi-suite dwellings;
2. To conduct numerical simulations of various fire scenarios in order to interpolate and extend the data beyond that obtained in the experimental studies;
3. To produce a set of realistic design fires for multi-suite dwellings from the experimental data;
4. To develop an analytical method that can be used to calculate design fires for multi-suite dwellings.
1.2 Research Methodology
The research approach employed in the project utilized literature reviews, surveys (to determine typical configurations and combustibles), computer simulations and fire experiments. Bench-scale cone calorimeter tests and full-scale fire experiments were conducted to determine the combustion characteristics of typical household furnishings found in living spaces that have a high incidence of fires. The furnishings were individually tested in a room calorimeter (Phase 1) and collectively tested in realistically furnished and well-instrumented simulated residential rooms (Phase 2). Numerical modelling of fire development, using the NIST Fire Dynamics Simulator (FDS) [1], was conducted at various stages to assist in the design and instrumentation of the full-scale fire experiments as well as to study the effect of various parameters, such as the ventilation conditions, geometry, and fire load on the development of the fire. To maximize the return of information from the project, the scope was expanded to include the installation of realistically constructed wall sections in the test rooms to represent interior and 1 hr rated partitions. The wall sections were used to evaluate the actual impact of the fires on realistic boundaries. In addition, one test was conducted with a residential sprinkler installed in the test room to evaluate its effectiveness in controlling a room fire. Although these two additions to the project scope did not directly contribute to the achievement of the main objectives of the project, they were considered to be valuable to the general objective of characterizing fires in multi-suite residential dwellings. Finally, analytical work was carried out to:
a) Evaluate the use of existing methods for calculating quantities such as time to flashover, ventilation-controlled heat release rate (HRR), post-flashover fire temperatures and duration of the fully-developed phase (onset of decay).
b) Develop and propose methods for calculating fire properties where existing methods were inadequate.
2
Survey of Dwellings
The survey was primarily based on measurements and photographic information obtained from real-estate websites. In addition to quantifying movable combustible contents, an important objective of the survey was to determine the similarities in combustible contents and configurations of the residential dwellings selected for this research. The survey provided an insight into the types and quantity of combustible contents found in residential dwellings, as well as floor configurations and other information that is pertinent to fire issues. Typical furnishings that constitute a significant portion of the movable fire load (were identified and values of fire load densities were calculated for rooms such as: kitchens, dining rooms, living rooms and bedrooms.
The average fire load densities in various rooms were estimated to be: kitchens – 807 MJ/m2;
dining rooms – 393 MJ/m2; living rooms – 412 MJ/m2; basement living rooms – 288 MJ/m2
; primary
bedrooms – 534 MJ/m2; and, secondary bedrooms – 594 MJ/m2. Although kitchens had the highest
fire load density the actual fire load (heat content) was found to be lower than that for bedrooms, which had higher values due to their larger floor areas and higher calorific values of contents, such as mattresses and carpeting.
Table 1 shows the calculated fire load densities for six rooms. The results show that kitchens had a significantly higher fire load density (mean of 807 MJ/m2) than any other area in a home due to a combination of the heavy wooden cabinets and a small floor area. This result is in good agreement with the results of a survey of single-family dwellings conducted in the USA [2], in which the highest fire load densities were found in kitchens and storage areas, although the values were reported to be higher than 1,000 MJ/m2.
Table 1. Movable fire load densities for various room [3, 4].
Room Mean Area (m2) Mean FLED (MJ/m2) Standard Deviation (MJ/m2) Minimum (MJ/m2) Maximum (MJ/m2) 95th Percentile Sample Size Mean FL (MJ) Kitchen 9.8 807 123 420 1244 940 515 7,908 Secondary bedroom 10.5 594 146 107 1,000 846 129 6,237 Primary Bedroom 16.6 534 125 249 920 753 347 8,864 Living room 17.6 412 127 106 897 610 397 7,251 Dining room 9.7 393 132 119 901 576 292 3,812 Basement living room 23.2 288 96 103 633 450 130 6,682
The 95th percentile value of fire load density—a value exceeded by only 5% of the survey
population—has great significance in fire safety engineering in so far as designing buildings and structures against fire scenarios having a potentially severe impact. Some design guides
recommend using at least a 90th percentile fire load density from representative surveys [5].Since the fire load density has a direct bearing on fire duration, given identical fire development
characteristics and floor area, the 95th percentile (or 90th percentile) value better reflects the inherent fire hazard and is often referred to as a credible but severe fire load density [6]. In this research, the fuel loads were designed on the basis of the 95th percentile fire load density to achieve conservative fire conditions. Assuming a normal distribution, the 95th percentile value is often approximated to be 1.64 times the standard deviation plus the mean. However, in the present case, the distributions were not strongly normal; therefore the 95th percentile value was calculated to be consistent with each distribution.
Since the area of different rooms varies greatly, it was concluded that the fire load density alone may not be a particularly good indicator of the likely impact of a fire given that a large room, with a lower fire load density, may contain a greater overall quantity of combustible materials (greater fire load energy) than much smaller rooms having high fire load densities, as shown by the comparison of rankings based on mean fire load density (FLED) and fire load energy (FL), which is given in Table 2. While the primary bedroom ranks third in terms of fire load density, it ends up in first position in terms of fire load energy. Another interesting case is the secondary bedroom, which drops from second position (FLED ranking) to fifth position in the FL ranking order. Under
comparable fire growth and ventilation conditions, rooms with greater fire load energy are likely to result in fires having a longer duration and a more severe impact.
Table 2. Ranking of rooms based on the mean FLED and FL.
Mean FLED (MJ/m2) FL (MJ) Kitchen 1 2 Secondary bedroom 2 5 Primary Bedroom 3 1 Living Room 4 3 Dining Room 5 6
Basement Living Room 6 4 FLED: Fire load density; FL: Fire load energy.
The results of the survey were valuable in providing the basis for designing the test facility and fire experiments for the CFMRD project.
1) The main floor in a residential dwelling was of the open-concept design (not compartmented), whereas the upper floor(s) containing bedrooms were highly
compartmented. Basements had a combination of an open-concept layout with some degree of compartmentation depending on their usage.
2) Residential care bedrooms had floor areas having a comparable room size (of about
10 m2) to secondary bedrooms and contain similar types of residential furnishings. However, the actual moveable fire load (excluding flooring) in residential care bedrooms was less than in secondary bedrooms.
3) Although there was insufficient information on secondary suites, it was assumed (based on a few floor plans that were collected) that they are apartments of reduced dimensions, with the living room, dining room, kitchen and bedrooms located on the same level.
4) Primary bedrooms and main-floor living rooms had a mean floor area of about 16 m2,
whereas basement living rooms had larger floor areas with a mean of around 23 m2.
Kitchens, dining rooms and secondary bedrooms had comparable floor areas of about 10 m2.
5) The fire load density and composition of combustible contents varied according to the type of room. The kitchen, dining room and living room had a higher composition of wood compared to bedrooms due to the popularity of hardwood flooring in living and dining rooms, and the presence of heavy wooden cabinets in kitchens.
6) Bedrooms had fire loads consisting of a significant amount of textiles compared to other rooms. The use of mate’s beds and bunk beds likely results in significantly greater combustible fire loads compared with other bed types.
7) The average fire load densities in various rooms were estimated to be (95th percentile values in brackets): Kitchens – 807 (940) MJ/m2; dining rooms – 393 (576) MJ/m2; living rooms –
412 (610) MJ/m2; basement living rooms – 288 (450) MJ/m2; primary bedrooms –
534 (753) MJ/m2; secondary bedrooms – 594 (846) MJ/m2. Although kitchens had the
highest fire load density the actual fire load (heat content) was found to be lower than that for bedrooms, which had higher values due to their larger floor area and high calorific value of contents, such as mattresses and carpeting.
8) The fire load density alone does not provide a complete picture of the associated fire hazard since parameters such as floor area and composition of the fire load can affect the total heat energy content and its rate of release during a fire, assuming that other parameters remain identical.
9) Windows in living rooms were typically larger (mean of 1.9 m wide x 1.3 m high) than bedroom windows (mean of 1.1 m high x 1.3 m high).
2.2 Reference Publications:
The following publications document the results of the survey:
1. Bwalya, A., Lougheed, G., Kashef, A. and Saber, H. 2008. "Survey Results of Combustible Contents and Floor Areas in Canadian Multi-Family Dwellings", Institute for Research in Construction, National Research Council Canada, Research Report, IRC-RR-253, Ottawa, Canada.
2. Alex C. Bwalya, Gary Lougheed, Ahmed Kashef and Hamed Saber. January, 2010. "Survey Results of Combustible Contents and Floor Areas in Canadian Multi-Family Dwellings", Fire Technology, Vol.46, No.1, p.1-20.
3
Computer Simulations
Numerical simulations were conducted in order to study the effect of ventilation settings on fire development in a room with the following dimensions: 4,200 mm long, 3,800 mm wide and 2,400 mm high. Eleven different ventilation scenarios (with opening factors ranging from 0.01 to 0.08 m1/2) were considered in the simulations using the NIST FDS [1], a fire model based on computational fluid dynamics (CFD) solution techniques. The opening factor, Fo is given by:
o o o T F A H A (3.1)
where Ao (m) is the area of the opening and Ho (m) is the height of the opening, and AT (m2) is the
total internal surface area of the enclosing surfaces.
The objective of the fire simulations was to gain insight into the effect of the size, number and location of ventilation openings on fire development, as well as to help identify suitable locations for installing certain types of instruments. In the simulations, both ventilation-controlled and
fuel-controlled fires were considered. A fuel package consisting of a polyurethane mock-up sofa and two wood cribs underneath it was used in all of the scenarios. The masses of the polyurethane and wood cribs in the fuel package were 8.3 kg and 86.7 kg, respectively. Detailed discussions of the simulations (assumptions, results and analysis) have been published elsewhere [7 - 11]. The results of the computer simulations revealed interesting flow patterns across the window openings, which highlighted the need to install velocity probes at specific locations to better determine the location of the neutral plane, for instance.
The CFD fire modelling efforts culminated in a detailed study of the different mechanisms of thermal decomposition of solid combustible materials, specifically wood and polyurethane
simulated (shown in Figure 2) was conducted with a mock-up sofa that was constructed with six blocks of flexible polyurethane foam (PUF) placed on a metal frame, with each block measuring 610 mm long x 610 mm wide and 100 mm or 150 mm thick. The total mass of PUF was 9.34 kg
and its density was about 32.8 kg/m3. The 150 mm thick foam blocks were used for the backrest
and the 100 mm thick foam blocks for the seat cushions. The wood cribs were made with spruce lumber pieces, each measuring 38 mm x 89 mm x 800 mm and had a total mass of 47.5 kg. The
lumber pieces were evenly spaced in rows of six and stacked to a height of 356 mm.
Figure 1. Illustration of the layout of the fuel package used in the CFD simulation.
Figure 2. Actual fire experiment in progress in the test room with a window opening of 1,500 x 1,500 mm.
The mechanism used for the degradation of PUF materials consisted of a series of complex steps made up of competitive reactions, independent reactions, and consecutive reactions. The melting behavior of the polyurethane foam and its effect on the fire growth and spread was also
investigated. Additionally, the key parameters that affected the evaporation rate of the melt and subsequent fire spread and growth were explained [12].
A simple mathematical model was developed to predict the plume height of a pool fire as a function of the HRR for the different types of polyurethane foams. In the study, two approaches were
examined to determine the suitable method to use for the modelling effect of melting on fire growth and spread. In the first approach, it was assumed that the burning surface of the sofa produced fuel particles when its temperature reached the melting temperature. In the second approach, a liquid pool fire was considered on the catch surfaces underneath the sofa. Based on the current
capabilities of FDS version 5, it was found that the first approach produced the best results. In order to investigate the importance of accounting for the melt on the fire growth and spread, two numerical simulations were conducted with and without considering a liquid pool fire as a result of melt and dripping of polyurethane foam. The results of these simulations indicated that the
the ignition, growth and spread fire regimes was neglected. Conversely, when the effect of the melt was taken into account, the predicted HRR was in good agreement with the measured HRR in the different fire regimes (ignition, growth and spread, fully-developed and early stage of decay
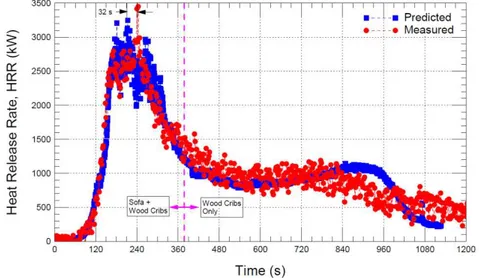
regime), as shown in Figure 3. The maximum predicted HRR (~3,250 kW) was 6% lower than the
maximum measured HRR (~3,450 kW). Since the experimental HRR was measured in an open calorimeter, and the predicted HRR was calculated inside the room, the maximum predicted HRR occurred at 213 s, while the maximum measured HRR occurred 32 s later (at 244 s). This is consistent with tests that have shown that placing a PCF in a room can cause a more rapid fire development. Furthermore, results showed that the trend of both the predicted and measured temperatures during the different fire regimes was approximately the same although there was a time lag between the predicted and measured temperatures.
Figure 3. Comparison of the measured and predicted HRR vs. time profiles.
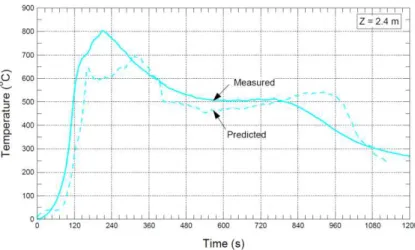
The results of temperature predictions, which are given in Table 3, show that the predicted and measured peak temperatures at different elevations above the floor (0.4, 0.9, 1.4, 1.9 and 2.4 m) were in good agreement with the measured temperatures. The calculated temperature profiles are compared with measured results in Figures 4 and 5. The predicted peak temperature at Z = 1.9 m
was ~12% (692°C, reached at 310 s) lower than the measured temperature (787°C, reached at
206 s, Figure 4). At the ceiling (Z = 2.4 m), the predicted peak temperature was 705°C (reached at
308 s), which was ~12% lower than the measured temperature (804oC, reached at 212 s, Figure 5).
In general, the CFD model predicted the experimental measurements of the temperatures at different elevations above the floor with reasonably good accuracy.
Table 3. Comparison of measured and calculated temperatures.
Figure 4. Comparison between measured and predicted average temperatures of the four trees (trees 1 – 4) at a height (Z) of = 1.9 m.
Figure 5. Comparison between measured and predicted average temperatures of the four trees (trees 1 – 4) at a height (Z) of = 2.4 m.
3.1 Reference Publications.
1. Saber, H.H., Kashef, A., Bwalya, A.C., and Lougheed, G.D. 2010. "Numerical and
experimental investigations of fire behaviour due to polyurethane foam and wood cribs in a medium-sized residential room", NRC Institute for Research in Construction, Research Report No. 291, Ottawa, Canada.
2. Saber, H., Kashef, A., Bwalya, A., Lougheed, G., and Sultan, M. 2008. "A Numerical Study on the Effect of Ventilation on Fire Development in a Medium-Sized Residential Room ",
Institute for Research in Construction, National Research Council Canada, Research
Report, IRC-RR-241, Ottawa, Canada.
3. Saber, H.H., Kashef, A., Bwalya, A.C. and Lougheed, G.D. 2008. "Analyses of Post-Flashover Fires in a Medium-Sized Residential Room under Different Ventilation
Conditions", Institute for Research in Construction, National Research Council Canada, Research Report, IRC-RR-264, Ottawa, Canada.
4. Saber, H.H., Kashef, A., Bwalya, A.C. and Lougheed, G.D. 2008. "Post-Flashover Compartment Fire for Different Fire Ventilation Settings in A Medium-Sized Residential Room", ASME International Mechanical Engineering Congress and Exposition -
Proceedings of IMECE2008, Boston, Massachusetts, USA.
5. Saber, H.H. and Kashef, A. 2008. "Post-Flashover Compartment Fire for Different Fire Ventilation Settings in A Medium-Sized Residential Room", 16th Annual Conference of the CFD Society of Canada: 09 June 2008, Saskatoon, Saskatchewan, Canada.
6. Saber, H.H. and Kashef, A. 2008. "CFD Simulations for Different Fire Ventilation Scenarios in A Room", 5th NRC Symposium on Computational Fluid Dynamics and Multi-Scale Modeling, Ottawa, Canada.
4
Phase 1 Tests: Combustion Characteristics of Individual Furnishings
In Phase 1 of the project [13], 36 fire experiments were conducted with various individual furnishings in a well-instrumented 16 m2 room to capture the effect of radiation feedback and other room effects on fire behaviour. The dimensions of the room were 3,800 mm wide x 4,200 mm long x 2,400 mm high, and it had a 1,500 mm x 1,500 mm window opening. The furnishings tested included mattresses, bed clothes, bed assemblies, upholstered seating furniture, clothing
arrangements, books, plastic audio and video media and storage cases, toys and a computer workstation setup. The objectives of Phase 1 were to:
a) Determine the burning characteristics of a range of primary and secondary combustible furnishings in a room environment;
b) Select suitable PCFs (particularly first-ignited items) for use in Phase 2 of the project; and c) Develop information on calorific values and various other aspects of combustion behaviour
to aid the design of experiments in Phase 2.
The test room was instrumented with load cells, heat flux gauges, thermocouples and velocity probes in order to take the following measurements: mass loss, total heat flux on gauges installed flush with the internal surfaces (floor, walls and ceiling), temperatures at numerous locations and gas velocities in the window opening. The smoke from the room was collected using a hood system in order to measure the HRR and optical density of the smoke.
Twin-size mattresses (weighing 12.5 kg to 23.1 kg) produced peak HRRs of approximately
3,800 kW and the maximum room temperature was approximately 980
°
C. The HRRs of bedassemblies of various sizes (weighing 42.5 kg to 86.5 kg) and configurations ranged from 1,800 kW for a 86.5 kg twin bed, to 6,250 kW for a 56.7 kg bunk bed. The maximum temperature and heat flux recorded in the experiments were 1,071
°
C and 221 kW/m2, respectively. Upholstered chairs and sofas had HRRs ranging from 630 kW for a 12.6 kg Ottoman, to 3,360 kW for a 44.3 kg two-seat sofa. Since the configuration of test room (room dimensions and wall lining materials) was constant, temperatures were linearly proportional to the peak HRR (and exposure time) until the ventilation-limit (approximately 4,100 kW) was reached.In tests with clothing (41.1 kg), toys (15.6 kg), shoes (29.0 kg), books (66.2 kg), computer
workstation (68.6 kg) and CD and DVD media (48.3 kg), the peak HRRs ranged from 440 kW for a bookcase to 2,045 kW for toys. Furnishings containing a large amount of rigid thermoplastics, such as shoes and media cases produced very dense smoke even at low HRRs. The experimental results from this phase of the project are summarized in Table 4.
Table 4. Summary of experimental results in Phase 1 of the project.
Test ID HRRmax THR ODMmax HC ̅
mf
Q
Q
mwc
T
(kW) (MJ) (OD/m) (MJ/kg) (°C) (kW/m2) (kW/m2) (° C) 05-SI-03 (Mattress) 1,808 (174)1 144 (5.4)2 0.4 26.7 594 (101)3 [722 SE]4 10 39 (20)3 [67 SW CS]4 18 06-SI-01 (Mattress) 3,790 (234) 257 (12.5) 1.3 20.6 835 (54) 899 SE] 42 98 (32) [138 W wall] 18 07-SI-02 (Mattress) 2,238 (258) 250 (9.3) 0.6 26.9 728 (135) [860 SE] 13 55 (27) [92 SW CS] 18 08-SI-04 (Mattress) 3,757 (278) 328 (13.3) 1.7 24.6 924 (40) [978 NW] 87 111 (28) [160 W wall] 18 09-SI-25 (Chair) 1,843 (185) 461 (27.3) 0.4 18.8 590 (91) [713 SW] 12 35 (16) [40 S wall] 15 10-SI-24 (Chair) 1,818 (206) 625 (30.1) 0.8 21.9 582 (25) [620 SE] 15 33 (10) [46 NE CS] 22 11-SI-08 (Bed clothes) 268 (466) 123 (5.25) 0.1 23.4 119 (5) [126 SW] 0.6 2.5 (1) [3.8 SW CS] 15 12-SI-07 (Bed clothes) 388 (582) 102 (6.5) N/A 15.7 195 (10) [204 SE] 1.6 5.4 (2) [7.9 SW CS] 15 13-SI-15 (Clothing) 1,855 (118) 942 (32.1) 0.2 25.4 542 (60) [598 SW] 12 34 (13)3 [49 SW CS]4 21 14-SI-06 (Mattress) 3,796 (233) 282 (10.5) 2.4 26.9 905 (41) [956 SW] 46 100 (33) [129 N wall] 20 15-SI-27 (Chair) 906 (178) 152 (7.3) 0.4 20.8 308 (33) [346 NW] 6 14 (6) [25 SW CS] 16 16-SI-16 (Wardrobe) 1,529 (622) 1,662 (89.8) 0.4 20.8 680 (34) [710 SE] 16 40 (24) [88 SW CS] 17 17-SI-75 (Bed clothes) 210 (756) 47 (3.7) .2 12.9 116 (18) [143 NW] .5 2.6 (1) [4.3 SW CS] 19 18-SI-36 (TV set) 93 (220) N/A5 (0.5) 0.2 N/A 42 (1) [43 NW] <1 <1 23 19-SI-83(Bed clothes) N/A N/A .2 N/A
130 (5) [137 SW] .<1 3.1 (1) [4.6 W wall] 26 20-SI-19 (CD/DVDs) 1,294 (415) 1,229 (35.8) 1.3 28.9 442 (23) [473 NW] 7 21 (8) [33 W wall] 25 21-SI-10 (Bed assembly) 2,978 (394)1 773 (35.8)2 0.9 21.5 826 (87)3 [933 SE]4 25 77 (28)3 [99 W wall]4 29 22-SI-22 (Toys) 2,048 (66) (15.9) 408 1.4 25.7 603 (55) [667 SE] 14 41 (16) [65 SW CS] 20 23-SI-76 (Bed assembly) 3,358 (332)1 595 (32.5)2 1.3 18.3 891 (41)3 [942 SW]4 20 95 (37) [140 W wall] 18 24-SI-18 (shoes) 1,229 (244) (20.7) 529 1.0 25.6 375 (4) [379 NW] 8 26 (20) [69 SW CS] 23 25-SI-20 (Books) 443 (2,162) 881 (47.7) 0.1 18.5 183 (9) [197 NE] 2 7 (5) [16 SW CS] 23
Test ID HRRmax THR ODMmax HC ̅ mf
Q
Q
mwc
T
(kW) (MJ) (OD/m) (MJ/kg) (°C) (kW/m2) (kW/m2) (° C) 26-SI-26 (chair) 2,710 (142) 481 (27.8) 0.8 17.4 635 (44) [691 SW] 20 73 (27) [102 W wall] 25 27-SI-11 (Bed assembly) 2,052 (388) 1,309 (N/A) 0.2 N/A 621 (67) [708 SW] 16 59 (30) [102 S wall] 14.5 28-SI-05 (Mattress) < 200 (67) N/A (3.0) 0.05 N/A 41 (4) [47 SW] N/A 0.8 (0.2) [0.9 NE C] 18 29-SI-12 (Bed assembly) 3,971 (247) 809 (40.7) 2.6 20.6 1,026 (21) [1,057 NE] N/A 173 (32) [223 S Wall] 18 30-SI-83 (Bed clothes) 197 (378) 56 (3.3) 0.2 17.0 111 (4) [115 SE] <1 3.9 (2) [4.9 S wall] 19 31-SI-13 (Bed assembly) 3,762 (466) 835 (47.9) 2.7 18.2 1,052 (16) [1,071 NE] 128 177 (26) [221 S Wall] 20 32-SI-14 (Bed assembly) 6,258 (248) 957 (38.7) 2.4 21.4 1,003 (39) [1,061 NE] 89 167 (36) [221 E CS] 24 33-SI-21 (workstation) 1,794 (433) 1,180 (54.0) 0.9 24.1 635 (72) [740 SW] 24 64 (28) [104 S wall] 24 34-SI-12 (Bed assembly) 1,912 (293) 853 (43.3) 0.8 20.4 583 (56) [629 SW] 18 35 (9) [51 SW CS] 17.7 35-SI-04 (Mattress) 3,351 (336) 265 (13.1) 1.9 20.2 749 (151) [921 SE] 29 66 (32) [129 SW CS] -24 36-SI-29 (Ottoman) 631 (509) 73 (6.4) 0.3 11.4 149 (56) [183 SW] 3 10 (4) [16 SW CS] -24 40-SI-31 (Loveseat) 3,364 (189) 595 (37.1) 1.7 16.0 739 (190) [910 SW] 19 83 (52) [165 SW CS] -4 41-SI-32 (sofa) 3,170 (217) 886 (49.0) >2.0 18.1 800(191) [1006 SE] 23 94 (43) [144 SW CS] -4 42-SI-85 (Bed assembly) 1,812 (564) 615 (22.1) 0.4 24.6 452 (45) [493 SW] 20 26 (8) [36 W wall] -20.0 43-SI-33 (Futon) 447 (1,008) 297 (16) 0.05 18.1 113 (62) [149 SE] 1 5 (1) [6 SW CS] -13 44-SI-12 (Bed assembly) 2,703 (442) 700 (40.1) 1.0 17.5 836 (236) [892 NE] 39 79 (22) [106 W wall] 2THR – Total heat released; ODMmax – Peak optical density per meter; ̅ – Maximum average room temperature (of four TC trees); HC – Effective heat of combustion; Q mf – Maximum heat flux at floor level; Q mwc– Maximum average heat flux on the walls and ceiling;
T - Ambient temperature; SW C: SW ceiling location; W wall: West wall; N wall – North wall; NE C – NE ceiling location; 1
Time to reach the peak HRR (s); 2 Mass loss (kg); 3 Standard deviation (SD); 4Tmax or Q max and its location. 5 N/A: Not available due to instrumentation malfunction or other omission.
4.1 Conclusions
1. Four of the mattresses tested were capable of causing flashover in the 16 m2 room and three of the mattresses produced significantly higher peak HRRs of approximately
3,800 kW, with peak room temperatures of approximately 980° C. An innerspring mattress (SI-06) was selected for use in tests in Phase 2 of the project because it had a rapid rate of fire growth and the highest peak HRR.
2. The addition of bed clothes (to a mattress) and other components that make up a complete bed assembly caused a reduction in the rate of fire growth and peak HRR by as much as 11%, i.e. a mattress alone placed on a supporting frame without bed clothes resulted in a more severe fire than was the case with a bed assembly using the same mattress. 3. The fires grew in size and intensity with the increase in bed assembly size from twin to
double. There was an 18% increase in peak HRR (3,358 kW to 3,971 kW) and the effect on other quantities was: 100% increase in smoke density; 12% increase in peak room
temperature (942°C to 1,057°C); 59% increase in peak total radiation measured by the
heat flux gauges, a significant increase given that thermal radiation is proportional to the fourth power of absolute temperature (on the Kelvin scale). Based on these results, it is likely that there was also an increase in the emissivity of the hot gases.
4. A number of tests demonstrated that bed clothes had a noticeable influence on fire growth. It was found that the bed assemblies had lower peak HRRs than their corresponding mattresses. Tests 29 and 31 demonstrated that a change of bed clothes had a significant influence on the fire growth rate.
5. In a test with a bunk bed assembly, it was found that excessive amounts of PUF resulted in lower temperatures in the test room since the fire environment became severely under-ventilated. For the purpose of this project, such a bed assembly would be unnecessarily onerous with regards to collecting the excessive amount of smoke using the hood system. Therefore, either a double or queen bed assembly was selected to be used in studying the fully-developed room fire behaviour.
6. A mate’s bed was found to have a much lower peak HRR (39% lower than a bed assembly
using a posture box foundation) since the wooden (particleboard) base restricted the burning area and air entrainment. Although the total amount of heat released was much greater than a bed assembly with a posture box (elevated about the floor), the latter poses a more critical fire hazard given that it caused flashover to occur earlier.
7. A bed assembly using a mattress and foundation that was compliant with the 16CFR1633 open flame test standard [14] was found to significantly reduce and delay the peak HRR. Although a peak HRR of 1,573 kW was measured, the temperatures in the room were well below 600oC indicating that flashover did not occur.
8. A reduction in the window size (from 1,500 mm x 1,500 mm to 1,400 mm x 1,200 mm) in a test with a double bed assembly resulted in a 16% reduction in the peak room
temperatures. This is in agreement with other published results from fire tests and fire models [15, 16], although the extent of the temperature reduction depends on the specific configuration of the compartments in question.
9. A chair (SI-26) having a peak HRR of 2,710 kW was selected, from a set of four, to be used in tests in Phase 2 of the project. In subsequent tests with two- and three-seat sofa versions of the chair, it was found that the two-seat sofa had the highest peak HRR of 3,364 kW, which was attributed to the greater effect of radiation feedback from the armrests than in the case of a three-seat sofa (peak HRR of 3,170 kW) where the armrests are further apart. The chair had the shortest time (142 s) to reach the peak HRR, followed by the two-seat sofa (189 s).
10. In a test with a Futon mattress, it was found that the cotton filling material provided strong resistance to combustion due to the protective effect of the char and the measured peak HRR was less than 500 kW. This result may not reflect the combustion behaviour of all Futon mattresses, since there are types that are manufactured entirely with PUF and polyester fibres as the filling materials.
11. For the tests conducted with secondary combustible furnishings:
a. Clothing and stuffed toys resulted in extremely rapid fire growth, when there was unrestricted air flow around the test arrangement, due to the presence of low density and loosely packed (or stuffed) polyester materials.
b. Furnishings containing a large proportion of rigid plastics, such as shoes, CD and DVD media packages and a computer workstation, produced very dense smoke, although the peak HRRs hardly exceeded 2,000 kW when the products were tested as individual items or in small groups.
c. The collapse of sample configurations (e.g. wardrobe, bookcases and clothing arrangements) was observed to be a factor that contributed to the earlier onset of the decay phase and increased its duration.
d. A TV set with a cathode ray tube was found to be not easily ignitable due to the fact that the housing materials met UL94 HB [17] flammability test standards. Although the set contained an insignificant amount of combustible materials (~ 5.2 kg; ~ 15% of the total mass), the smoke produced at lower HRRs was very dense.
4.2 Reference Publications
1. Bwalya, A., Gibbs, E., Lougheed, G., Kashef, A., and Saber, H. 2008. "Design of a Single-Room Heat Release Rate Calorimeter for the Characterization of Fires in Multi-Suite Residential Dwellings Project", Institute for Research in Construction, National Research Council Canada, Research
Report, IRC-RR-267, Ottawa, Canada.
2. Bwalya, A., Lougheed, G., and Kashef, A. 2010. "Characterization of Fires in Multi-Suite Residential Dwellings: Phase 1 - Room Fire Experiments with Individual Furnishings", Institute for Research in
Construction, National Research Council Canada, Research Report, IRC-RR-302, Ottawa, Canada.
3. Bwalya, A.C., Gibbs, E., Lougheed, G., Kashef, A., and Saber, H. 2009. "Combustion of non-open-flame resistant Canadian mattresses in a room environment", Fire and Materials 2009: 11th
International Conference, San Francisco, USA.
4. Bwalya, A.C., Gibbs, E., Lougheed, G., and Kashef, A. 2011. "Combustion Characteristics of Residential Bed Assemblies of Various Sizes and Configurations Tested in a Room Environment", Fire and Materials 2011: 12th International Conference, San Francisco, USA.
5
Phase 2 Tests
– Post-flashover Room Fires
5.1 Test Facility
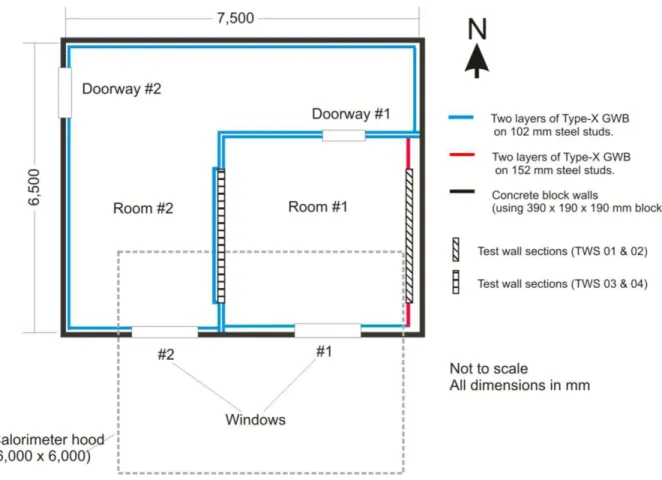
In Phase 2 of the project, the fire experiments (tests) were conducted in a specially constructed one-storey test facility, which was designed to represent a single storey of a multi-family dwelling, such as a main floor or second storey, having a floor area of approximately 48 m2. Figures 6 and 7 show the schematic illustration and photograph of the test facility, respectively. The test facility and HRR calorimeter hood were located inside a large fire-testing hall. The exterior walls of the facility were constructed around a concrete slab foundation using 390 mm wide x 190 mm high x 190 mm deep concrete blocks. The HRR calorimeter consisted of a 6,000 mm x 6,000 mm square sheet-metal hood with a vertical exhaust duct having a diameter of 1,320 mm, as shown in Figure 8. A sheet-metal skirt was installed around the perimeter of the hood to help direct smoke and hot gases into the hood and maintain good accuracy of measurements.
Figure 7. Photograph of the one-storey facility. Figure 8. Calorimeter hood and exhaust duct.
The test facility permitted a flexible array of test configurations to be constructed, such as: single
rooms with floor dimensions of 3,800 x 4,200 mm (area: 16 m2) or 3,200 x 3,500 mm (area:
11.2 m2), multiple rooms or a single large room covering the entire 48 m2 floor area to simulate a main floor of a multi-family dwelling, for example. All of the rooms had a ceiling height of 2,440 mm. For single-room tests conducted in Room #1, Doorway #1 was either sealed off, using
non-combustible materials, or left open, depending on the objectives of the test.
The fuel load in the tests consisted of real residential furnishings and all of the fires were initiated with a flaming ignition source resulting in rapidly developing fires in all 13 tests where the first-ignited item was a PCF. In order to study a kitchen fire, direct impingement on a PCF was not done. A more realistic ignition source, a stove-top oil fire, was used. Without direct impingement on a PCF, the growth of the fire was less rapid. The matrix of 14 tests was developed in consultation with members of the project consortium at the bi-annual Progress Review and Planning Meetings. The tests were derived from six main layouts to explicitly evaluate the effect of ventilation, fuel load density and composition, ignition location, and sprinklers on the room fire. Tenability was studied by conducting a multi-room experiment in which fire effluent from the room of origin was allowed to flow into an adjacent room. Two tests were devoted to studying fires in residential care dwellings (bedrooms) and secondary suites, which were considered to have similar configuration of
furnishings to those in regular dwellings.
The tests were well-instrumented, with approximately 130 to 150 data measurement points (channels of data) used per test, in order to obtain the following measurements:
a) HRR;
b) Room and solid-surface temperatures; c) Heat flux;
d) Concentrations of O2, CO2 and CO gases at various locations;
e) Gas flow velocities in the window openings and the exhaust duct; and; f) Static pressure.
The HRR and room temperatures were two of the most important measurement quantities given their role in defining the potential of a fire to cause damage to the surrounding building elements by thermal-induced degradation.
A larger number of the tests (eight out of 14 tests) were conducted in bedroom settings because the survey results showed that bedrooms contained significantly greater fire load energy content in addition to the fact that fire statistics show that the greatest number of fatalities occur in bedrooms. The secondary bedroom was of interest because it had the highest FLED amongst all of the rooms that contained a large amount of upholstered furniture.
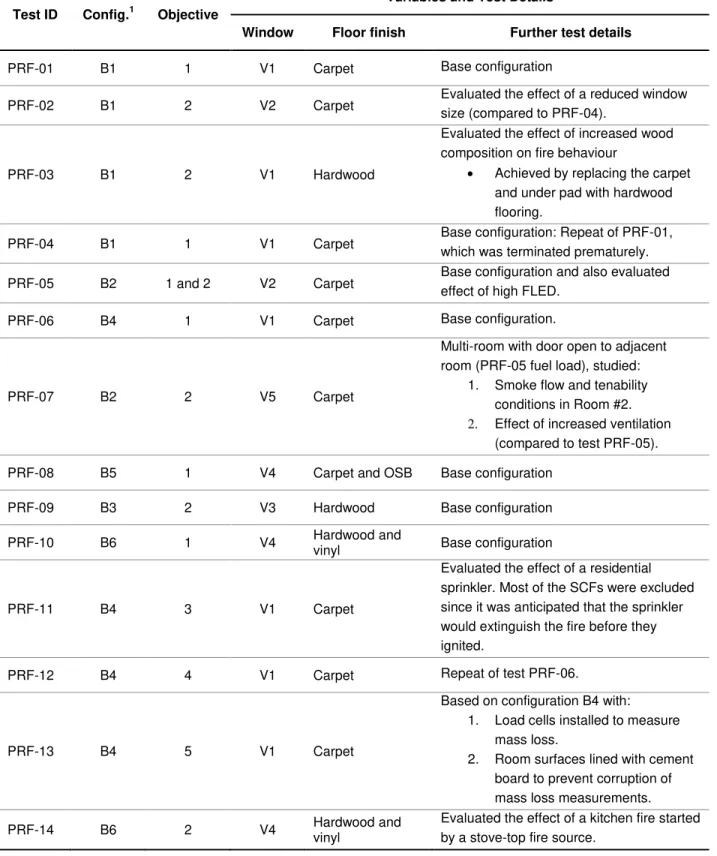
5.1.1 Fire Tests
The 14 room fire tests were based on six distinct room layouts (referred to as “base configurations”) simulating the following residential rooms and configurations: 1) primary bedroom; 2) secondary bedroom #1; 3) secondary bedroom #2; 4) living room; 5) secondary suite, and; 6) main floor. The secondary bedroom #2 simulated a lower bedroom fuel load and smaller window size found in some residential care dwellings. Details of these base configurations can be found in Table 5. The definitions of these residential rooms and configuration was provided in a separate report [3], which covered the residential survey results [4]. Table 6 lists the windows sizes and their corresponding theoretical ventilation-limited HRRs, which varied from approximately 1,500 kW to 6,900 kW (ventilation factors ranging from 1 to 2.76 m5/2, respectively). The ventilation factor, Fv, is the
product of the area of the window and the square root of its height (F =A Hv o o). Window V1 was
chosen to be the best reference-case size (i.e. resulted in the highest room temperatures) after a series of preliminary fire simulations and experiments that were conducted with various window sizes [7].
The test matrix was designed to achieve the following objectives:
1) Objective #1: Characterize fire behaviour in each of the five base configurations (project objective #1).
2) Objective #2: Evaluate the effect of the following parameters: ventilation, fire load composition, FLED (project objective #2).
3) Objective #3: Evaluate the effect of using a residential sprinkler (project objective # 1). 4) Objective #4: Determine the repeatability of the measurements. Repeatability is the
assessment of the measurement variability found when the same test is repeated using the same apparatus under identical conditions.
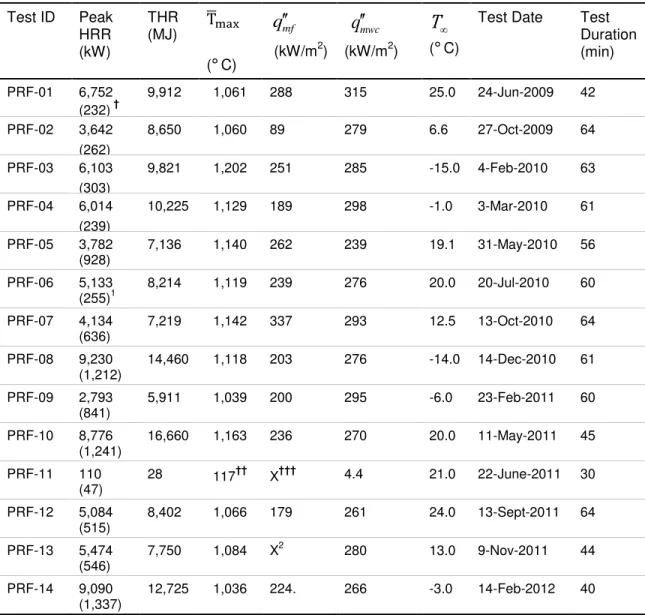
5) Objective #5: Determine the progressive mass loss during a test (project objective #2). Table 7 provides the full list of the tests conducted, indicating some of the key variables. Only one test (PRF-13) was conducted with load cells installed to measure the rate of mass loss during the test.
Table 5. Base configurations of PRF Tests.
No. Base configuration Floor dimensions (floor area) Tests
B1 Primary bedroom 3.8 x 4.2 m (16.0 m2) PRF-01, -02, -03, -04 B2 Secondary bedroom #1 3.2 x 3.5 m (11.2 m2) PRF-05, -07
B3 Secondary bedroom #2 3.2 x 3.5 m (11.2 m2) PRF-09
B4 Living room 3.8 x 4.2 m (16.0 m2) PRF-06, -11, -12, -13
B5 Secondary suite Bedroom: 3.8 x 4.2 m (16.0 m
2 ) Living room: 3.4 x 6.3 m (21.4 m2) PRF-08 B6 Main floor (living/dining/kitchen) 7.3 x 6.3 m (46.0 m 2 ) PRF-10, -14
Table 6. Window sizes used in the Tests.
Window ID Dimensions Width x Height (m) FV (m 5/2)1 HRRv2 (kW) Tests #1 #2 V1 1.5 x 1.5 - 2.76 4,140 PRF-01, -03, -04, -06, -11, -12, -13 V2 1.4 x 1.2 - 1.84 2,760 PRF-02, -05 V3 1.0 x 1.0 - 1.00 1,500 PRF-09 V4 1.5 x 1.5 1.4 x 1.2 4.56 6,840 PRF-08, -10, -14 V5 1.4 x 1.2 0.7 x 1.2 2.76 4,140 PRF-07 1
Ventilation factor (F =A Hv o o ) where Ao (m) = sum of openings and Ho (m) = average of heights; 2
Theoretical ventilation-limited HRR calculated assuming a combustion efficiency of 100%: HRRv = 1500 x Fv
Table 7. Summary of the setup and variables for the Tests.
Test ID Config.1 Objective
Variables and Test Details
Window Floor finish Further test details
PRF-01 B1 1 V1 Carpet Base configuration
PRF-02 B1 2 V2 Carpet Evaluated the effect of a reduced window size (compared to PRF-04).
PRF-03 B1 2 V1 Hardwood
Evaluated the effect of increased wood composition on fire behaviour
Achieved by replacing the carpet and under pad with hardwood flooring.
PRF-04 B1 1 V1 Carpet Base configuration: Repeat of PRF-01,
which was terminated prematurely. PRF-05 B2 1 and 2 V2 Carpet Base configuration and also evaluated effect of high FLED.
PRF-06 B4 1 V1 Carpet Base configuration.
PRF-07 B2 2 V5 Carpet
Multi-room with door open to adjacent room (PRF-05 fuel load), studied:
1. Smoke flow and tenability conditions in Room #2. 2. Effect of increased ventilation
(compared to test PRF-05).
PRF-08 B5 1 V4 Carpet and OSB Base configuration
PRF-09 B3 2 V3 Hardwood Base configuration
PRF-10 B6 1 V4 Hardwood and vinyl Base configuration
PRF-11 B4 3 V1 Carpet
Evaluated the effect of a residential sprinkler. Most of the SCFs were excluded since it was anticipated that the sprinkler would extinguish the fire before they ignited.
PRF-12 B4 4 V1 Carpet Repeat of test PRF-06.
PRF-13 B4 5 V1 Carpet
Based on configuration B4 with: 1. Load cells installed to measure
mass loss.
2. Room surfaces lined with cement board to prevent corruption of mass loss measurements.
PRF-14 B6 2 V4 Hardwood and
vinyl
Evaluated the effect of a kitchen fire started by a stove-top fire source.
1
The fire was initiated on the first-ignited-item using the appropriate ignition method given in Table 8. The first-ignited-item and ignition sources were selected in Phase 1 of the project [13].The planned duration of each test was 1 hour.
Table 8. Ignition sources used in the tests.
First ignited item
Tests (PRF no.)
Ignition source Strength Reference Standard
Bed assembly 01, 02, 03, 04, 05, 07, 08
T-burner 9 kW (6.6 L/min) for 50s positioned 0.47 m from the head-side
Developed in Phase 1 [13].
Two-seat sofa (loveseat)
06, 11, 12, 13 Square-burner 19 kW (13.0 L/min) for 80s ASTM 1537 [18] Oil pan simulating
stove-top fire
14 Heated
cooking oil in oval roaster
Approximately 60 kW Ad hoc
It is acknowledged that the ignition sources listed in Table 8 are severe in comparison to realistic igniters such as matches, cigarette lighters and candles, which are often mentioned in many fire statistics as the major causes of residential fires. However, it is common practice in the fire research community to use ignition sources similar to those listed in Table 8 for the benefit of standardization and repeatability. Weaker ignition sources may affect the time to ignition; however, it is believed that the post-ignition phase, during which the fire becomes self-sustaining, is the most important period in studying fire behavior and hence the reason for selecting stronger ignition sources that ensure ignition. A study on the influence of ignition sources on HRR in a furniture calorimeter [30] compared propane burners with ignition strengths ranging from 1.7 kW to 30 kW and found that the burning behavior of the burning items was similar regardless of the type of burner used. As well, the repeatability was better when a stronger ignition source was used. In that study they considered a HRR of 50 kW to be the fire size that can be detected by persons who are not fully alert or those who are further away from the burning item or a fire detector. Therefore, the period before sustained ignition occurs is considered to be relatively unimportant to the assessment of burning behavior and can be accounted for by appropriately modifying the time to ignition or attainment of the experimental HRR at ignition. The above methods have also been supported by Babrauskas and Peacock [31] who stated that although fire deaths are mainly caused by the inhalation of toxic gases, HRR was still the best indicator of fire hazard and that the relative toxicity of combustion gases, and delays in the ignition time as measured by small flame tests, had been shown to have a minor effect on the development of the fire hazard.
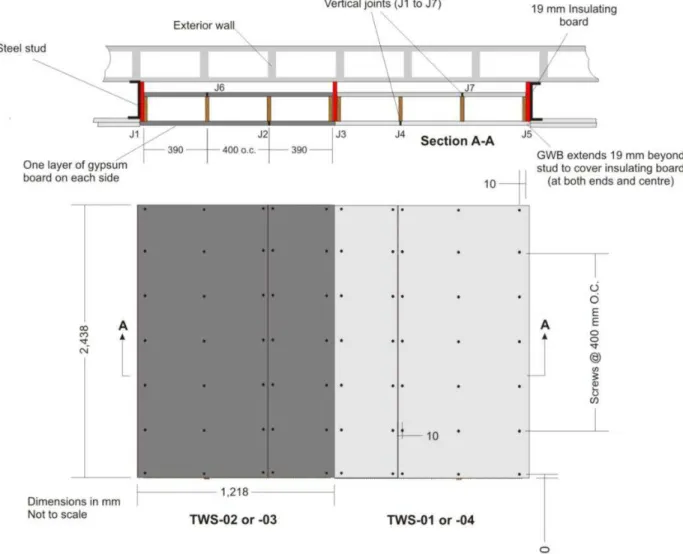
5.1.2 Test Wall Sections
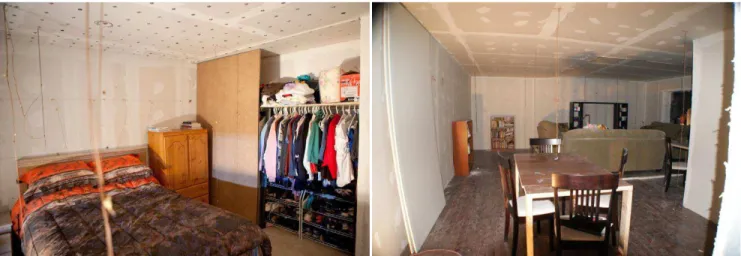
To evaluate the impact of the fires on realistic boundaries, Test Wall Sections (TWS), constructed with non-load bearing wood-frame wall specimens, were installed in many of the tests. Figure 9 shows the construction details of the TWS. Each TWS was constructed with 38 mm x 89 mm wood studs with a spacing of 400 mm o.c. between the central studs and 390 mm from the centre of each of the central studs to the end of the outer studs, as shown in Figure 9. Therefore, the width of the framing of each TWS was 1,180 mm and the height was 2,438 mm. TWS 01 and 03 were lined with a single layer of regular 12.7 mm GWB on each side of the framing and TWS 02 and 04 were lined with a single layer of 15.9 mm Type X GWB on each side of the framing. For all TWSs, the gypsum board (GWB) was applied parallel to the wood studs with vertical joints (J1, J2, ...., J7) located as shown in Figure 9. TWS 01 and 03 represented interior partition walls (not rated), whereas TWS 02 and 04 represented a wall assembly that would achieve a 1 h fire resistance rating in the ASTM E119 or CAN/ULC S101 standard furnace tests [19, 20]. The photograph in Figure 10 shows how TWS 01 and 02 were installed in an actual test setup, and Figure 11 shows a photograph of
TWS 03 and 04. One major deviation from the setup used in the standard furnace tests is that there was cavity between the test wall sections and the exterior wall that was not vented. Although, the TCs used to assess failure were installed under insulation pads on the unexposed side, it is likely that they experienced a faster temperature rise due to the reduced convection and radiation heat losses from the unexposed surface to the outside environment. Therefore, the results are not directly comparable to those from standard E119 or CAN/ULC S101 due to the differences explained above.
Figure 9. Construction details of Test Wall Sections showing the fire-exposed side.
Figure 10. Photograph showing location of TWS-01 and -02 in one of the tests (setup in Test PRF-04).
Figure 11. Photograph showing location of TWS 03 and 04 in one of the tests (setup in Test PRF-04).
5.1.3 Fuel Loads
The furnishings were selected in Phase 1 of the project [13], to cover a range of combustible household items identified in a residential survey [3, 4]. Details of the fuel load, such as total mass, estimated material composition and FLED, are given in Table 9 and were explained in Part 1 of the final project report [21]. Figures 12 and 13 are photographs illustrating the layout of the furnishings in Tests PRF-04 and PRF-10, respectively. Where available, calorific values measured in Phase 1 were used to calculate the FLED. Fuel load quantities included combustible structural elements (such as, OSB sub-floor and wood framing for test wall sections) that were expected to be involved in the fire. Detailed information about the mass of individual furnishings used in each test is given in Part 1 of the final project report [21].
Table 9. Quantity and composition of the fuel load used in the tests.
Test no. Window Estimated Material Mass Composition (%) Total Mass FLED HCavg
W P T TP NC Kg MJ/m2 MJ/Kg PRF-01 V1 58.6 2.4 26.5 10.1 2.5 790.5 869.0 18.0 PRF-02 V2 60.1 2.3 25.5 9.7 2.4 809.2 910.6 18.1 PRF-03 V1 73.6 1.8 16.4 6.2 1.9 1,000.8 976.1 15.8 PRF-04 V1 62.2 2.2 23.7 9.5 2.3 791.1 914.5 17.7 PRF-05 V2 59.9 3.5 19.1 14.1 3.3 677.8 999.3 17.1 PRF-06 V1 60.3 11.7 6.2 17.4 4.4 714.2 680.3 16.0 PRF-07 V5 57.7 3.7 20.1 14.9 3.5 642.8 962.6 17.4 PRF-08 V4 65.6 7.0 16.3 10.6 2.0 1,403.2 617.3 16.6 PRF-09 V3 79.7 0.8 9.4 6.8 3.3 618.5 750.7 14.1 PRF-10 V4 89.1 4.2 0.1 5.7 0.9 1,878.5 535.2 13.5 PRF-11 V1 70.1 0.0 5.7 9.9 4.3 414.6 404.9 16.4 PRF-12 V1 61.0 11.3 5.8 18.5 3.5 707.0 682.6 16.0 PRF-13 V1 61.1 11.3 5.8 18.4 3.5 710.0 685.6 16.0 PRF-14 V4 89.9 4.3 0.1 5.7 0.9 1,882.3 535.2 13.5
FLED: Fire load energy density; W: Wood P: Paper; T: Textiles; TP: Thermo-plastics; NC: Non-combustible, eg. Metal; HCavg: mean theoretical heat of combustion.
While every effort was made to ensure accuracy of the fuel loads in tests using the same base configuration, it was not possible to achieve exactly the same combustible mass in each test due to normal variations in the mass of furnishings and measurement errors. The variation in mass
Figure 12. Layout of furnishings in Test PRF-04 showing queen-size bed assembly, clothing closet and armoire door chest.
Figure 13. Layout of furnishings in Test PRF-10 showing dining table and chairs, hardwood floor finish and living room furniture.
5.1.4 Test Procedure
The fire was initiated on the first-ignited-item (listed in Table 8) using the appropriate ignition method given in Table 8. The planned duration of each test was one hour from ignition. The tests were terminated by extinguishing the fire with a water hose (and compressed air foam in one case: Test PRF-13) after reaching one of the following criterion:
1) One hour had elapsed;
2) A safety concern had occurred: It was determined that the fire had breached the ceiling membranes (two or three layers of GWB depending on the type of ceiling design) when:
a) A temperature of 300°C was measured in the roof joist space;
b) Ignition of the roof surface (with visible flames) was observed.
The remaining mass of unconsumed fuel load was not measured since it was mixed with a considerable quantity of GWB that fell off the ceiling either during the test or at the time of extinguishment.
5.2 Results
Table 10 summarizes the test results: HRR, total heat released, mean maximum room
temperatures and peak heat flux. Five tests (PRF-01, -05, -10, -13 and -14) were terminated early
due to safety concerns, usually due to the temperatures in the roof joist space exceeding 300°C.
The graphical results for all of the measurement points are given in Part 1 of the project report [21]. A detailed analysis of all of the fire tests with conclusions regarding the effect of parameters such as: ventilation, composition of the fuel load, fire load density, room size, ignition scenario