https://doi.org/10.4224/40001227
Vous avez des questions? Nous pouvons vous aider. Pour communiquer directement avec un auteur, consultez la première page de la revue dans laquelle son article a été publié afin de trouver ses coordonnées. Si vous n’arrivez pas à les repérer, communiquez avec nous à PublicationsArchive-ArchivesPublications@nrc-cnrc.gc.ca.
Questions? Contact the NRC Publications Archive team at
PublicationsArchive-ArchivesPublications@nrc-cnrc.gc.ca. If you wish to email the authors directly, please see the first page of the publication for their contact information.
https://publications-cnrc.canada.ca/fra/droits
L’accès à ce site Web et l’utilisation de son contenu sont assujettis aux conditions présentées dans le site LISEZ CES CONDITIONS ATTENTIVEMENT AVANT D’UTILISER CE SITE WEB.
READ THESE TERMS AND CONDITIONS CAREFULLY BEFORE USING THIS WEBSITE. https://nrc-publications.canada.ca/eng/copyright
NRC Publications Archive Record / Notice des Archives des publications du CNRC :
https://nrc-publications.canada.ca/eng/view/object/?id=8688a83d-0d5c-457d-9e47-61d1faaf2fe6
https://publications-cnrc.canada.ca/fra/voir/objet/?id=8688a83d-0d5c-457d-9e47-61d1faaf2fe6
NRC Publications Archive
Archives des publications du CNRC
For the publisher’s version, please access the DOI link below./ Pour consulter la version de l’éditeur, utilisez le lien DOI ci-dessous.
Access and use of this website and the material on it are subject to the Terms and Conditions set forth at
Consistent ice-crushing physics at small and large scales: from ice
skating to ice-induced vibration of structures
Consistent Ice-Crushing Physics at Small and Large Scales:
From Ice Skating to Ice-Induced Vibration of Structures
Robert Gagnon
Ocean, Coastal and River Engineering
National Research Council of Canada
St. John's, NL, Canada
Ocean, Coastal and River Engineering
Conceptual Model for Ice Crushing
(
Based on in situ experimental observations
)
Crushing apparatus with mirror for viewing the contact zone during experiments. (From Gagnon, 1994a)
Stainless steel crushing platen showing the configuration of pressure and temperature sensors and the liquid sensor. (From Gagnon, 1994a)
Schematic of the medium scale indentation apparatus used in the trench at Hobson’s Choice in 1990. (From Gagnon, 1998)
Frontal view of the flat rigid indentor showing the positions of the viewing window and the pressure sensors. (From Gagnon, 1998)
(a) Conceptual schematic of the ice
crushing test method; (b) Top view of
ice-holder; (c) Side view. (from Gagnon
and Bugden, 2007)
Schematics of the crushing platen (a) and
pressure sensor working principle (b).
(from Gagnon and Daley, 2005).
Ocean, Coastal and River Engineering
Images from three early studies of ice crushing behavior showing high pressure zones consisting of relatively intact ice
encompassed by low pressure pulverized/extruded ice. (Left) From Fransson and Olofsson, POAC 1991; (Center) From
Riska, POAC 1991; (Right) From Gagnon and Molgaard, Annals of Glaciology, 1991.
Ocean, Coastal and River Engineering
Figure 1. A pattern of sequential ice fractures in a two-dimensional ice
formation that is crushed by a plate from the top. Each fracture produces a
spall. (Reproduced from Daley 1992).
Lab Data
Sections of the displacement, pressure and load data from a test using the crushing
apparatus. (From Gagnon, 1994b)
Ice Crushing
Field Data
Time series of displacement (a), piston/diaphragm pressure sensor output (b), PVDF pressure sensor output (c) and load (d) for a segment of Ice Island test Tfr4. The displacement data has not been corrected to account for the ice compliance. The correction would make the gently sloping plateaus almost horizontal. (From Gagnon, 1998)
Lab Data
A section of the liquid sensor data from a test using the crushing apparatus. The test, and time segment, is the same as in the previous figure. (From Gagnon, 1994b)
Ocean, Coastal and River Engineering
1. High-speed imaging
– Thick section crushing lab test (side view)
Crushing Test
2. Very high-speed imaging
– Ice pyramid crushing (view through crushing platen)
Midas / fasttest_02b_C001S0001
Crushing Friction of Ice
a b A B G H cFig. 1. Schematics showing aspects of the ice behavior during the crushing-friction experiments.
(a) Schematic showing the essential characteristics of ice crushing against a flat rigid surface. (b) A 2D schematic depicting ice crushing against a platen surface with square columns. The ice has both a vertical and a horizontal component of movement relative to the crushing platen, where the resultant movement is as indicated. (c) A 3D schematic showing a small portion, a unit area containing one square column, of the view of the ice and platen shown in Fig. 1b. The schematic depicts the time-averaged general flow characteristics of the self-generating squeeze-film slurry as it moves from high-pressure regions, where it is generated, into the lower-pressure gap space and eventually out through the gap exits where low-pressure crushed ice is present. From Gagnon (2016).
Gap-exit flow to low-pressure region
Vertical ice movement
Square column
Platen Base
Platen sliding direction relative to ice Hard-zone ice
Squeeze-film slurry layer exerting high pressure on platen surface
Slurry flow lines
Low pressure slurry-filled gap
Slurry flow lines
Gap filled with ice/liquid slurry
Wet crushed ice (soft zone)
Intact ice (hard zone)
Horizontal ice movement
Vertical ice movement Resultant ice movement
Squeeze-film ice/liquid slurry layer
Crushing platen
1 mm
2 mm Vertical ice movement
Wet crushed ice (soft zone)
Intact ice (hard zone)
Squeeze-film ice/liquid slurry layer
Crushing platen Flow direction
Crushing Friction of Ice
a
A
b
B
C
D
E
F
G
H
Fig. 2. Test apparatus photographs. (a) Photograph of the crushing-friction test setup. (A)
Vertically-oriented test-frame load cell for measuring the normal load; (B) Mirror; (C) Acrylic
crushing-platen; (D) Ice specimen in ice holder; (E) Rail-car assembly; (F) Load cell used to
measure the horizontal friction force; (G) Linear actuator used to slide the rail-car and ice sample
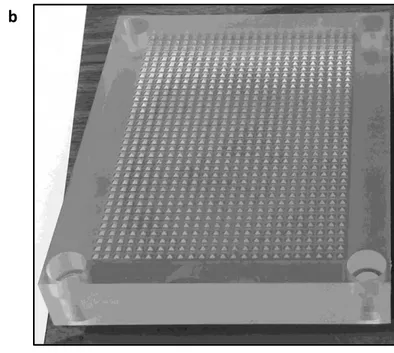
horizontally; (H) High-speed imaging camera. (b) Photograph of the acrylic platen with the array
of small regular square pyramids on its surface (platen dimensions: 166 mm x 129 mm x 25
mm). The pyramids were 1 mm in height and 2 mm wide at the base. The space between each
adjacent pyramid was 2 mm. The arithmetic average of the high-roughness profile for the surface
of the platen was 0.075 mm. From Gagnon (2016).
Crushing Friction of Ice
Fig. 3.
Main friction coefficient results for the tests
using the crushing platen with the array of square
pyramids.
(Top)
Friction
coefficient
versus
horizontal sliding speed. Tests corresponding to three
vertical crushing rates and five horizontal sliding
rates were conducted. The included data points
corresponding to the tests conducted using the two
flat steel plates represent averages of two tests in
each case, where the vertical crushing rate and
horizontal sliding speed were both set at 10 mm/s.
Scatter in the data, that is inherent in ice crushing
and friction experiments, amounted to about ± 15%.
(Bottom)
Friction coefficient versus gap
cross-sectional area. Granular ice was used for all tests
shown in this figure. From Gagnon (2016).
Crushing Friction of Ice
µ = n w P A / (A
max
L) = n w P H
2
V
h
/ (2 V
c
A
max
L) = V
h
/ V
c
x C
onstant
Where µ is the coefficient of friction, n is the number of square columns in the
hard-zone area, w is the area of a column face, P (~ 55 MPa) is the slurry
(squeeze-film) pressure on a column face on which ice is encroaching, L is the
normal crushing load, A
max
is a certain constant area, A is the cross-sectional
area of the gap where A
max
> A, H is the height of a column, V
h
is the
horizontal sliding speed and V
c
is the vertical crushing rate. Typical values for
the two unknown quantities in the equation, n and A
max
, are the mutually
Schematic illustrating the coupled Molikpaq–ice sheet system during dynamic interaction. The spring constant and mass of the Molikpaq are treated as fixed quantities whereas the spring constant and mass of the ice sheet are treated as effective quantities that vary according to the ice spalling frequency that is directly proportional to the ice sheet speed. Panel (a) shows a highlysimplified rendition of the situation where a mass (i.e. the mass of the structure combined with the effective mass of the ice) is situated be-tween two springs (one for the structure and one for the ice) and the ends of the springs are fixed. Panel b shows the complete situation where movement of the far-field ice is included along with the spall-induced surges of the structure and ice towards each other and the associated energy dissipation. Structure damping of the Molikpaq is also included.