HAL Id: hal-02369533
https://hal.archives-ouvertes.fr/hal-02369533
Submitted on 25 May 2020HAL is a multi-disciplinary open access archive for the deposit and dissemination of sci-entific research documents, whether they are pub-lished or not. The documents may come from teaching and research institutions in France or abroad, or from public or private research centers.
L’archive ouverte pluridisciplinaire HAL, est destinée au dépôt et à la diffusion de documents scientifiques de niveau recherche, publiés ou non, émanant des établissements d’enseignement et de recherche français ou étrangers, des laboratoires publics ou privés.
Variations in benthic foraminiferal assemblages in the
Tagus mud belt during the last 5700 years: Implications
for Tagus River discharge
Pierre-Antoine Dessandier, Jérôme Bonnin, Bruno Malaizé, Clément Lambert,
Rik Tjallingii, Lisa Warden, Jaap Sinninghe Damsté, Jung-Hyun Kim
To cite this version:
Pierre-Antoine Dessandier, Jérôme Bonnin, Bruno Malaizé, Clément Lambert, Rik Tjallingii, et al.. Variations in benthic foraminiferal assemblages in the Tagus mud belt during the last 5700 years: Implications for Tagus River discharge. Palaeogeography, Palaeoclimatology, Palaeoecology, Elsevier, 2018, 496, pp.225-237. �10.1016/j.palaeo.2018.01.040�. �hal-02369533�
1
Variations in benthic foraminiferal assemblages in the Tagus mud belt during the last 5700 years: Implications for Tagus River discharge
Dessandier Pierre-Antoinea,$, Bonnin Jérômea, Malaizé Brunoa, Lambert Clémentb, Tjallingii Rikc,#, Warden Lisac, Sinninghe Damsté Jaap Sc,d, Kim Jung-Hyunc,§.
aUMR-EPOC 5805 CNRS, Université de Bordeaux, Allée Geoffroy St. Hilaire, 33615 Pessac,
France
bLemar UMR 6539, Université de Bretagne Occidentale, IUEM Technopôle Brest-Iroise, rue
Dumont d'Urville - 29280 Plouzané, France
cNIOZ Royal Netherlands Institute for Sea Research, Department of Marine Microbiology and
Biogeochemistry, and Utrecht University, NL-1790 AB Den Burg, The Netherlands
dUtrecht University, Department of Geosciences, Faculty of Earth Sciences, PO Box 80.021,
Utrecht, The Netherlands
$Current address: CAGE—Center of Arctic Gas Hydrate, Environment and Climate, Department of Geology, UiT University of Norway, Tromsø, Norway
#Current address: Climate Dynamics and Landscape Evolution, GFZ German Research Centre for Geosciences, Potsdam, Germany
§Current address: Korea Polar Research Institute, 26 Songdomirae-ro, Yeonsu-gu, Incheon
21990, South Korea
*Corresponding author:
Email: pierre-antoine.dessandier@uit.no
2
Abstract
1
We analyzed a 10-m sediment core retrieved at 82 m water depth off the coast of the
2
Tagus River (Western Iberian Margin, Portugal) to investigate a linkage between variations in
3
benthic foraminiferal assemblages and Tagus River discharge over the last 5700 years. Benthic
4
foraminiferal assemblages were studied at high resolution in combination with the stable carbon
5
and oxygen isotopic composition of fossil shells of Nonion scaphum, bulk and molecular
6
organic matter properties (TOC, TN, C/N ratio, 13CTOC, 15Nbulk, and BIT index), magnetic
7
susceptibility, and XRF analyses. Three periods of environmental changes were identified: 1)
8
high Tagus River discharge in 5750-2200 calendar year before present (cal yr BP), 2) lower
9
discharge characterized by intense upwelling conditions (2250-1250 cal yr BP), and 3) both
10
intense upwelling and Tagus River discharge (1250 cal yr BP-present). The data reveal
11
alternating intense upwelling periods, as shown by the dominance of Cassidulina carinata,
12
Valvulineria bradyana, or Bulimina marginata, whereas periods of increased river discharge
13
are indicated by increase of N. scaphum, Ammonia beccarii, and Planorbulina mediterranensis.
14
The Tagus River discharge was the strongest during the first period, transporting riverine
15
material further offshore and preventing the establishment of a mud belt on the mid-shelf
16
(around 100 m depth). During the second period, a decrease in Tagus River discharge favored
17
the formation of the Tagus mud belt and strongly influenced the benthic environment by
18
creating an organic matter stock. During the third period, intense upwelling and increased Tagus
19
River discharge were recorded by benthic foraminiferal distribution, with an increase of
20
terrestrial elements present in the mud belt. Furthermore, our results showed that variations in
21
benthic foraminiferal assemblages corresponded to the well-known climatic periods in the study
22
area, such as the Roman Period, the Dark Ages, the Medieval Warm Period, and the Little Ice
23
Age. Our study strongly suggests that benthic foraminiferal assemblages can be used as a
bio-24
indicator to trace the influence of past river discharge.
3
Key words: Holocene, Portuguese Margin, Paleo-reconstruction, North Atlantic Oscillation
26
27
1. Introduction
28
In the last decades, benthic foraminiferal assemblages have often been used in
29
paleoceanography to investigate biostratigraphy, paleobathymetry, and abiotic conditions, such
30
as temperature, salinity, and pH (Jorissen et al., 2007 and references therein). The TROX model
31
(Jorissen et al., 1995) established that oxygen concentration and organic matter content in the
32
sediment are the major environmental controls on the distribution of benthic foraminifera in
33
marine sediments. Subsequent studies emphasized the importance of the quality of the organic
34
matter for the composition of living benthic foraminifera faunas in various marine environments
35
(e.g., Goldstein and Corliss, 1994; Suhr et al., 2003; Fontanier et al., 2005, Goineau et al., 2011,
36
Dessandier et al., 2015). Benthic foraminifera are known to bloom following high marine algal
37
production (e.g., Kitazato et al., 2000). After a phytoplankton bloom, benthic foraminifera
38
respond rapidly to the increased influx of fresh organic matter (Fontanier et al., 2003).
39
Terrestrial input may also impact the organic matter supply and its quality and thereby may
40
partly control the benthic foraminiferal distribution in continental shelf sediments. This is
41
particularly true for river-dominated shelves where living benthic foraminifera have been
42
identified to respond to river inputs (e.g., Mendes et al., 2004; Mojtahid et al., 2009; Goineau
43
et al., 2011).
44
Dessandier et al. (2016, 2018) have shown through studies on living and dead faunas
45
that some species could be used as bio-indicators of river discharge and upwelling intensity in
46
the Portuguese Margin. During the last millennia, these environmental conditions were
47
influenced by rapid climatic changes (Abrantes et al., 2005, Lebreiro et al., 2006). Within the
48
Quaternary, the Holocene is characterized by relatively stable climatic conditions with
49
millennial-scale variability (Bond et al., 1997). The solar variability superimposed on long-term
4
changes in insolation seems to be one of the most likely important forcing mechanisms for the
51
rapid climate changes over the Holocene (Mayewski et al., 2004). The North Atlantic
52
Oscillation (NAO) was also described as a major factor for the variability of climate in Europe
53
(Wanner et al., 2001), which played an important role in the control of the upwelling intensity
54
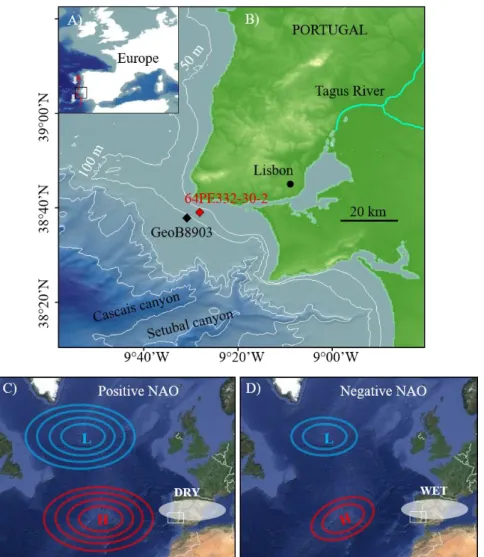
and humidity of the Iberian Peninsula (Abrantes et al., 2005; Lebreiro et al., 2006; Fig. 1). The
55
NAO is an atmospheric process characterized by a seesaw between the Icelandic low and the
56
Azores high pressures. The positive mode (NAO+) is characterized by well-developed
57
Icelandic low and Azores high pressures, associated with stronger westerlies over the eastern
58
North Atlantic and the European continent. The negative mode (NAO-) is characterized by a
59
rather weak pressure seesaw and reduced westerlies (Wanner et al., 2001). The last millennia
60
were marked by short-scale climatic changes, mainly controlled by solar activity and NAO-like
61
processes. Several such periods of short-scale changes were identified, among them the Roman
62
Period (RP; e.g., Lamb, 1985), the Dark Ages (DA; e.g., Keigwin and Pickart, 1999), the
63
Medieval Warm Period (MWP), the Little Ice Age (LIA; deMenocal et al., 2000; Trouet et al.,
64
2009), and a warming during the twentieth century determined by instrumental temperature
65
measurements of the last two centuries. The major climatic changes, MWP and LIA, have been
66
described as controlled by NAO+ and NAO-, respectively (Lebreiro et al., 2006; Trouet et al.,
67
2009). The nature and chronology of these events are still debated (Desprat et al., 2003; Ortega
68
et al., 2015; Swingedouw et al., 2015), but the influence of these abrupt changes on the rainfall
69
and upwelling intensity has been observed in the Iberian Margin (Abrantes et al., 2005;
Bartels-70
Jónsdóttir et al., 2006). During the NAO- mode, the Iberian Margin is marked by increased
71
humidity, which is responsible for strengthened riverine discharge (Bernárdez et al., 2008). The
72
NAO+ mode is characterized by an increase in Iberian coastal upwelling (Lebreiro et al., 2006).
73
Another oscillation, called the Atlantic Multidecadal Oscilllation (Kerr, 2000), was also
5
described as a controlling factor of rainfall during the last century that had a greater influence
75
on the American continent, Sahel, and northern Europe (Knight al., 2006).
76
We tested the applicability of these benthic foraminifera as bio-indicators of past
77
upwelling intensity and changes in river discharge on a late Holocene sediment sequence from
78
the Tagus prodelta. We used a multiproxy approach based on organic parameters (total organic
79
carbon [TOC], total nitrogen [TN], C/N ratio, 15Nbulk, and13CTOC), XRF data, benthic
80
foraminiferal assemblages, and carbon and oxygen stable isotopes of benthic foraminifera to
81
compare climatic changes of the late Holocene with river regime change. The branched
82
isoprenoid tetraethers (BIT) index was measured in the core that was previously published in
83
Warden et al. (2016) and compared with our reconstruction. We applied our reconstruction on
84
a paleoclimatological record never studied at this water depth, under the influence of the Tagus
85
River, and provided a new dataset to improve understanding of the effect of NAO-like processes
86
during the Holocene.
87
88
2. Study area
89
Our study area was located at the mid-shelf off the Tagus River mouth, on the western
90
Iberian Margin (Fig. 1) which is a narrow (20–34 km) shelf (Dias et al., 2002) that extends from
91
37ºN to 42ºN latitude. The shelf break is located at 140 m depth, on the outer continental shelf
92
and slope, and three main submarine troughs (the Cascais Canyon, Lisbon Canyon, and Setùbal
93
Canyon) are related to geological features (Jouanneau et al., 1998). The regional hydrodynamic
94
regime is driven by the influence of wave action, tidal and rip currents, and storm surges, which
95
plays a role in determining the particle size distribution on shelf sediments (Oliveira et al.,
96
2007). However, the Tagus area is protected against swell from the northwest (Jouanneau et al.,
97
1998). Sandy deposits occur on the inner shelf, where there are high-energy littoral currents.
98
The dominant regional surface current (the Portugal Coastal Counter Current) flows southward
6
and transports material from the shelf to the deep ocean during winter storms (Vitorino et al.,
100
2002b). The outer shelf is affected by internal waves, especially during periods when water
101
masses are stratified, resulting in the deposition of large bodies of sandy and gravelly sands
102
(Jouanneau et al., 1998). The export of terrestrial sediment and nutrients along the shelf is
103
predominantly influenced by sediment supplied by three main rivers: the Douro, Tagus, and
104
Sado (Jouanneau et al., 1998; Dias et al., 2002). At around 100 m water depth, the finest
105
particles are deposited in accumulation areas, called the mud belt (or mud patch). The mud belt
106
lies beyond the line where seasonal thermal stratification of surface waters occurs, especially
107
off the mouths of the Douro and Tagus rivers (Jouanneau et al., 1998; Dias et al., 2002). These
108
accumulation zones are composed of mixed sources of marine, estuarine, and terrestrial organic
109
matter (Schmidt et al., 2010). Winter storms can remobilize the sediment and transport it
110
northward by the action of bottom currents (Dias et al., 2002; Vitorino et al., 2002a), eventually
111
depositing it on the mid-shelf mud belt between 50 and 130 m water depth (Vitorino et al.,
112
2002b).
113
The Eastern North Atlantic Central Water (ENACW) is a slope current characterized by
114
a decrease of salinity under the surface currents, with a minimum of 35.6 at 450–500 m water
115
depth (Oliveira et al., 2007). The ENACW is upwelled during summer. Between May and
116
September, the Azores high-pressure system is driven closer to the coast. Together with the
117
associated northerly winds, this atmospheric system makes the colder, less salty, and
nutrient-118
enriched subsurface water (60–120 m water depth) rise to the surface along the Iberian Margin
119
(Fiúza, 1983). This upwelling leads to an increased productivity in the summer along a
50-km-120
wide zone. The main upwelling front is oriented along the bathymetry off the 100 m isobath in
121
the northern part of the Iberian Peninsula; it then turns slightly offshore and southward (Peliz
122
et al., 2002). Most of the primary producers, especially cyanobacteria and diatoms, that are
123
dominant in the Iberian Margin increase during upwelling events (Tilstone et al., 2003). Active
7
upwelling periods have a large impact on marine trophic conditions in this area (Fiúza, 1983)
125
and are characterized by maximal organic carbon exports to the seafloor (Jouanneau et al.,
126
1998). Periods of strong Iberian river discharge that occur during phases when upwelling is
127
reduced are characterized by a substantially increased export of continental nutrients, which
128
triggers phytoplankton production (Prieto et al., 2009; Rodrigues et al., 2009). To a lesser
129
extent, phytoplanktonic blooms occur in November and between April and May (Ferreira and
130
Duarte, 1994). In winter, the Azores high-pressure system moves south, which results in
131
southerly winds and downwelling conditions that lead to the deposition of sediments on the
132
shelf (Frouin et al., 1990). Upwelling activity and fluvial discharge are consequently the two
133
major parameters controlling the marine biology on the Iberian Shelf (Lebreiro et al., 2006) due
134
to their impact on the deposition of organic matter, which is important for benthic organisms.
135
The Tagus is the longest (1,008 km) Iberian river in the central part of the Peninsula and
136
has a large mesotidal estuary with an area of 340 km2 (Vale and Sundby, 1987). The Tagus
137
watershed is about 80,600 km2 and has an annual mean water discharge of 360 m3 s-1 (Jouanneau
138
et al.,1998), with strong seasonal changes in discharge from 1 to 2,200 m3 s-1 (Atlas Nacional
139
de España), controlled by maximal rainfall in winter (Aguiar and Ferreira, 2005; Azevedo et
140
al., 2008). The Tagus River flows were largely modulated by the NAO during the last century
141
(Trigo et al., 2004) and the last millennia (e.g., Abrantes et al., 2005; Bartels-Jónsdóttir et al.,
142
2006; Lebreiro et al., 2006). The river discharge also controls the input of chlorophyll
143
associated with phytodetritic material in the marine environment and the water column
144
stratification (Relvas et al., 2007).
145 146
3. Material and methods
147
Core 64PE332-30-2 was obtained in March 2011 during the Pacemaker 64PE332 cruise
148
on board the R/V Pelagia (38°39’04’’N, 9°28’13’’W). This 978-cm Kullenberg piston core
8
was retrieved from the Tagus mud belt at 82 m water depth (Fig. 1). Sediment slices 1 or 2 cm
150
thick were sampled every 10 cm, dried, weighted, and washed through 63 and 150 µm sieves.
151
For this study, 101 samples of >150 µm benthic foraminifera were handpicked and placed in
152
Chapman cells before taxonomic identification under a stereomicroscope. After splitting using
153
an Otto microsplitter, a minimum of 250 specimens were counted. Diversity indices (Shannon
154
[S] and Evenness indices) were calculated using the PAleontological STatistics (PAST)
155
software (Version 2.14; Hammer et al., 2001). The benthic foraminiferal number (BFN), which
156
represents the number of individuals per analyzed dry sediment mass, was calculated for all
157
samples.
158
Isotopic analyses were performed on monospecific samples of the benthic foraminiferal
159
species Nonion scaphum, which is present all along the core and is typical of the Iberian mud
160
belt (Dessandier et al., 2015; 2016), at the EPOC laboratory, University of Bordeaux. This
161
species was observed alive below the oxygen penetration, between 1 and 2 cm depth in the mud
162
belt area (Dessandier et al., 2016), suggesting that it may reflect subsurface sediment pore water
163
rather than bottom water conditions. However, we compared only the data measured on the
164
same species in every sample, avoiding any bias from the early diagenesis effect for
165
environmental reconstruction. For each sample, three or four specimens were handpicked and
166
dissolved in acid via the Micromass Multiprep autosampler system. The resulting carbon
167
dioxide gas was analyzed against the international reference standard NBS 19 (13C = + 1.96
168
‰ / PDB and 18O = ‒ 2.20 ‰ / PDB) using an Optima Micromass mass spectrometer.
169
Measurements were taken for each depth horizon (1 cm) in triplicate to reduce uncertainties.
170
The analytical precision was better than 0.05 ‰ for δ18O and 0.03 ‰ for δ13C.
171
The age model for the sediment core, modified according to Warden et al. (2016), was
172
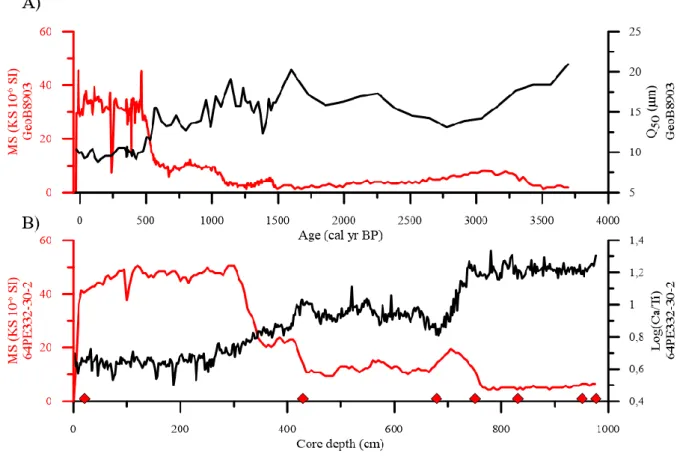
based on the magnetic susceptibility (MS) and seven accelerated mass spectrometry (AMS) 14C
173
radiocarbon dates (Table 1). The MS record of Core 64PE332-30-2 was compared with that of
9
Core GeoB 8903 (Abrantes et al., 2008), which was also retrieved in the Tagus prodelta at ~100
175
m water depth (Fig. 1). Table 1 summarizes the 14C AMS dating points of the two cores
176
considered in this study. Because of the low number of dating points in the upper part of Core
177
64PE332-30-2, we compared our record of MS and age model with Core GeoB 8903, which
178
had a substantial number of 14C AMS dating points in the upper section (Figs. 2 and 3). The
179
MS was measured on board at 5-cm intervals using a Bartington MS meter with a 12-cm
180
diameter loop. The final age model was achieved by a linear interpolation between each AMS
181
14C age. The 14C data calibration was made via the program CALIB V0.6 with the Marine13
182
calibration curve (Stuiver and Reimer, 1993), using the common reservoir age of 400 years
183
because no regional effect on reservoir age is known in our sampling area (Abrantes et al.,
184
2005). AMS 14C ages and the dating points of GeoB8903 were converted to cal yr BP.
185
Core 64PE332-30-2 was scanned with an Avaatech XRF core scanner at NIOZ at 1-cm
186
resolution. Detailed bulk-chemical composition records acquired by XRF core scanning allow
187
accurate determination of stratigraphical changes and assessment of the contribution of the
188
various components in lithogenic and marine sediments (Stuut et al., 2014). The XRF core
189
scanner uses energy dispersive fluorescence radiation to measure the chemical composition of
190
the sediment as element intensities in total counts or counts per second (Tjallingii et al., 2007).
191
After cleaning and preparation of the archive-halve core surface and covering with SPEX Certi
192
Ultralene® foil, the core was measured at both 10 kV and 30 kV. Element intensities are
193
presented as log ratios that are normally distributed and linearly related to log ratios of element
194
concentration (Weltje and Tjallingii, 2008). Terrestrial exports, such as metals or contaminants,
195
are indicated mainly by Fe/Ti and Pb/Ti ratios. The Zr/Rb ratio serves as a grain size indicator
196
(Taylor, 1965), and the Br/Cl ratio indicates organic sediment (Ziegler et al., 2008).
197
Sediments were freeze-dried and ground before the geochemical analyses. TN and δ15N
198
were measured with a Thermo-Scientific Flash 2000 Elemental Analyzer interfaced at NIOZ.
10
The analyses were determined at least in duplicate and the analytical error was, on average,
200
smaller than 0.1 wt. % for the TN content. The TOC content, the stable carbon isotopic
201
composition of TOC (δ13C
TOC), and BIT data were previously published by Warden et al.
202
(2016). The C/N ratio was calculated as the division of TOC/TN.
203
A principal component analysis (PCA) was performed on 22 samples of normalized
204
environmental and faunal data, using PRIMER version 6.0 software (Clarke and Warwick,
205
1994) to compare the response of the faunal and environmental parameters. The two major PCA
206
scores were plotted to define the different phases of the reconstruction.
207 208
4. Results
209
4.1. Sedimentological features and age model
210
The final age model of Core 64PE332-30-2 (Fig. 3) revealed that the sedimentation rates
211
were increasing over time, with a first phase of ~0.06 cm/yr-1 from 5750 to 2200 cal yr BP. In
212
a second phase, 2200-present, the sedimentation rate was ~ 0.52 cm yr1. The MS record and
213
grain size distribution of the Core GeoB 8903 were plotted as a function of age, and the MS
214
and Ca/Ti record of Core 64PE332-30-2 were plotted as a function of core depth (Fig. 2).
215
Similar trend signals in the MS records were identified in the two cores, and the Ca/Ti record
216
measured by XRF showed a similar trend to the grain size record of core GeoB 8903. The MS
217
record showed three phases, with the first characterized by an increase of MS at 770 cm
218
sediment core depth, the second a larger increase at around 400 cm, and the third a more stable
219
trend until the end. This trend was opposite that of the Ca/Ti content, which revealed two
220
successive decreases of values at the same depths.
221 222
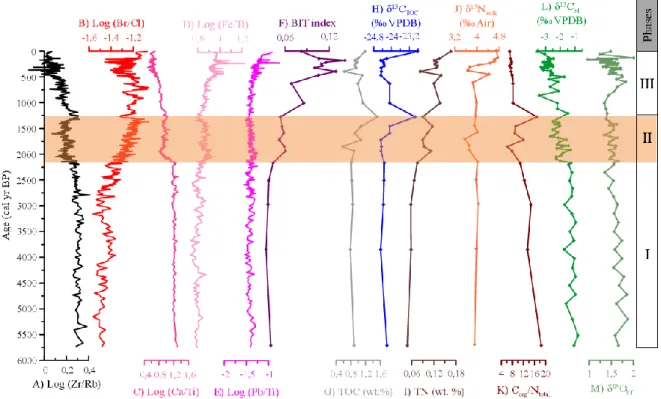
4.2. Environmental change phases
11
XRF, organic matter, and benthic foraminiferal isotopes data are plotted in Fig. 4. Three
224
phases appeared following the environmental changes, mainly determined by the XRF ratios.
225
Phase I (575-2250 cal yr BP) was characterized by high Zr/Rb and Ca/Ti counts, while the
226
Br/Cl and Fe/Ti counts were low. The BIT index was low and stable (below ~ 0.04), the TOC
227
content was also stable at around 0.9 wt. %, 13CTOC was about ‒ 24.3 ‰, and 15Nbulk was
228
about + 3.9 ‰ (Warden et al., 2016). The TN was the only organic parameter that slightly
229
increased during this phase, from 0.04 to 0.08 wt. % (Warden et al., 2016). The C/N ratio
230
showed an opposite trend, with a clear decrease from 18 to 11. Both the carbon and oxygen
231
stable isotope composition of N. scaphum slightly decreased during this interval, 18Obf from +
232
1.7 to + 1.4 ‰ and 13Cbf from ‒ 1.1 to ‒ 1.2 ‰.
233
Phase II (2250-1250 cal yr BP) was characterized by a rapid decrease in Ca/Ti and Zr/Rb
234
counts, a strong increase in Br/Cl counts, and a slight increase in Fe/Ti. The BIT index increased
235
slightly, to 0.06. The TOC, 13CTOC, and C/N ratio reached high values at the end of the period
236
(around 1.5 wt. %, ‒ 23.0 ‰, and 16, respectively) after a large increase. TN and 15Nbulk
237
showed a smaller increase; TN moved from 0.9 to 0.13 wt. % and 15Nbulk from + 3.6 to + 3.9
238
‰. Isotopes measured on benthic foraminifera became more variable at the beginning of the
239
period, and this trend continued until the end of the record. The decrease in 13bf observed in
240
phase I was stronger, and 18O
bf remained fairly constant.
241
Phase III (1250 cal yr BP-present) was characterized by a continued decrease of Ca/Ti
242
counts and a large decrease of Zr/Rb counts. Br/Cl counts were also unstable and lacking any
243
clear trend. The Fe/Ti and Pb/Ti counts from Phase III showed an increase until the end of the
244
record, especially during the last 500 years for Pb/Ti, after a stable trend during the two previous
245
phases. They both peaked at 250 cal yr BP, when Br/Cl decreased. The TOC content, 13CTOC,
246
and C/N ratio decreased, to 1.2 wt. %, ‒ 24 ‰, and 8, respectively. The 13CTOC and TOC
247
increased during the last 200 years, reaching ‒ 28.8 ‰ and 1.2 wt. %, respectively. TN and
12
15N
bulk were roughly constant before a large increase at the end of the period, reaching 0.17 %
249
and + 4.7 ‰, respectively. The 18Obf increased at the beginning from + 1.3 to + 1.8 ‰ and
250
decreased until + 1.5 ‰ at the end; 13Cbf showed the opposite trend, with a large decrease from
251
‒ 1.5 to ‒ 3.5 ‰. The C/N ratio was slightly decreasing from the start of this period until the
252
present. Conversely, the BIT index was progressively increasing, reaching 0.12, but dropped in
253
the most recent sediment horizon analyzed.
254 255
4.3. Benthic foraminiferal distribution over the last 5750 years
256
Fig. 5 shows percentages of the major species (> 5 %). Based on the distribution of these
257
dominant taxa, three different phases could be identified. The first phase does not map to the
258
environmental phases and ends at 2500 cal yr BP. During this phase (5750-2500 cal yr BP), N.
259
scaphum and Ammonia beccarii dominated, making up 30 and 18 % of the total species,
260
respectively. Planorbulina mediterranensis and Bolivina spathulata were relatively abundant
261
as well, with each ~10 % of the population. A. beccarii was particularly dominant (10-20 %)
262
between 5750 and 4750 cal yr BP and then quickly decreased to ~ 5 %. The epibenthic species
263
Cibicides lobatulus was only > 5 %, while Hyalinea balthica and Uvigerina bifurcata increased
264
until the end of the period. This first period was marked by a progressive increase of specific
265
richness; the S index increased from 28 to 36, and H' from 2.3 to 2.8. The foraminiferal density
266
(BFN) was relatively low during this period.
267
Between 2500 and 1250 cal yr BP, Cassidulina carinata increased sharply, while N.
268
scaphum clearly decreased in relative abundance. Valvulineria bradyana was nearly absent
269
during the first phase but became abundant from 2250 cal yr BP and reached 10 % of the fossil
270
assemblage during the latter period of this second phase. Smaller variation in the relative
271
abundances of the other dominant species, such as P. mediterranea, A. beccarii, H. balthica,
272
and U. bifurcata, was observed without a clear trend. V. bradyana and Bulimina marginata
13
increased, and C. lobatulus and B. spathulata diminished. The highest percentages of C.
274
carinata (40 %) were observed between 1750 and 1500 BP, whereas Bulimina marginata, P.
275
mediterranensis, and B. spathulata decreased. The BFN increased as both specific richness and
276
the S index began an initial decline; specific richness was decreasing until 30 taxa, and H' until
277
2.5.
278
The last phase (1250 cal yr BP-present, Phase III) was characterized by higher relative
279
abundance of V. bradyana, dominance of C. carinata, and a progressive decrease of P.
280
mediterranensis, A. beccarii, and B. spathulata. The relative abundance of N. scaphum slightly
281
increased from 1250 cal yr BP, compared to 2600-1250 cal yr BP, but decreased again from
282
500 cal yr BP. After 1000 cal yr BP, a strong increase was recorded for C. carinata, to more
283
than 40 % at 500 cal yr BP and in the modern period. Deep infaunal species (i.e., Chilostomella
284
oolina and Globobulimina affinis), B. marginata, and Eggerelloides scaber also increased
285
during this phase. The last 200 years showed strong abundances of C. carinata (44 %) and a
286
large loss of both V. bradyana and N. scaphum, which decreased to ~ 10 %. Bolivina spathulata
287
and H. balthica totally disappeared, while U. bifurcata, A. beccarii, and B. marginata declined.
288
With C. carinata, only B. aculeata and E. scaber are increasing during this modern period. The
289
last 750 years showed a large decline of BFN, specific richness (~ 20), and S index (~ 2).
290 291
4.4. Multiproxy approach
292
A PCA was performed on the major environmental parameters (TOC, TN, 13CTOC,
293
15N
bulk, BIT index, Ca/Ti, Fe/Ti, Br/Cl, Zr/Rb, and benthic foraminiferal stable isotopes) and
294
on the relative abundances of the major benthic foraminiferal species (C. carinata, N. scaphum,
295
V. bradyana, A. beccarii, P. mediterranensis, B. spathulata, E. scaber, H. balthica, U.
296
bifurcata, B. marginata, and deep infaunas) (Fig. 6A). PC1 and PC2 explained 64 % (52 and
297
12 %, respectively) of the total variance observed in the dataset. The relative abundance of N.
14
scaphum, A. beccarii, and P. mediterranensis loaded positively on PC1 and negatively on PC2,
299
together with 13Cbf, Ca/Ti, and Zr/Rb. Most organic compounds, such as TOC, TN, 13CTOC,
300
and 15Nbulk,loaded negatively on PC1 and PC2 with C. carinata, Br/Cl, and Pb/Ti. The deep
301
infaunas and B. marginata, V. bradyana, and E. scaber loaded negatively on PC1 and positively
302
on PC2, together with Fe/Ti and the BIT index. Uvigerina bifurcata, H. balthica, and B.
303
spatulata loaded positively on PC1 and PC2 with 18Obf.
304
The scores of the different samples on PC1 and PC2 were plotted as a function of age
305
in Fig. 6B. The score of PC1 was stable during the first phase and then showed a slight increase
306
from 2500 to 2250 cal yr BP. At the start of Phase II (2250 cal yr BP), the score of PC1
307
decreased until 1500 cal yr BP, then increased again. At the start of Phase III (1250 cal yr BP),
308
a second progressive decrease started and characterized this phase until the present. The plot of
309
PC2 showed an increase toward positive loading until the end of phase I. The second phase
310
(2250-1250 cal yr BP) was characterized by a sharp decrease, before an increase at the
311
beginning of Phase III that continued until 750 cal yr BP. PC2 decreased, reaching 0 at 500 cal
312
yr BP, showed a slight increase between 500 and 250 cal yr BP, and decreased again during the
313
last period of Phase III.
314 315
5. Discussion
316
5.1. Benthic foraminiferal response to environmental and climatic changes
317
Climatic changes during the late Holocene have been well studied in the Portuguese
318
Margin, especially for the last 3000 years (e.g., Desprat et al., 2003; Abrantes et al., 2005;
319
Bartels-Jónsdóttir et al., 2006; Alt-Epping et al., 2009). This rendered the Holocene a suitable
320
period to test benthic foraminifera as bio-indicators for past Tagus River discharge and
321
environmental changes based on the living foraminiferal calibration developed by Dessandier
322
et al. (2016, 2018) in the same location. Previous sediment cores in the area extended back to
15
2000 (Abrantes et al., 2005; Bartels-Jónsdóttir et al., 2006) or 3000 cal yr BP (Alt-Epping et
324
al., 2009). The 10-m core retrieved in our study provided a record that dated to 5750 cal yr BP.
325
Next, we present the three phases defined by environmental changes related to sediment
326
supplies, as shown by the XRF ratios and visible in the scores of the PCA (Fig. 6B).
327
The first phase was characterized by positive values of PC1 and a continuous increase
328
in PC2, starting from negative values. The Zr/Rb ratio indicates a bigger grain size, which had
329
a strong positive loading on PC1 together with Ca/Ti. Ca was previously linked to grain size in
330
the Portuguese Margin and thought to be associated with coarse reworked shells of
331
macrobenthic organisms (Martins et al., 2007; Abrantes et al., 2008; Alt-Epping et al., 2009).
332
The two different increases of Zr/Rb and Ca/Ti were two successive phases in grain size
333
decrease from Phase I to Phase III (Fig. 4). During Phase I, the TOC content of the sediment
334
and the Br/Cl were very low; both indicated low amounts of organic compounds, likely because
335
of this coarse grain size. This phase was characterized by river-influenced species, such as N.
336
scaphum, A. beccarii, and P. mediterranensis. This first group of species consequently
337
represents the river discharge bio-indicator in this study. Among them, N. scaphum was
338
interpreted as an indicator of active upwelling conditions in previous studies of the Portuguese
339
Margin (Bartels-Jónsdóttir et al., 2006). However, the results from late winter showed that this
340
species was clearly dominant in the living community of the Portuguese inner shelf during
341
winter. By contrast, during active upwelling context, it was present only in the dead community,
342
reflecting lower relative abundances (Dessandier et al., 2016; 2018). The large occurrences of
343
A. beccarii and P. mediterranensis during this first phase indicated strong bottom currents and
344
coarse sediments (e.g., Murray, 2006; Schönfeld, 2002), whereas C. lobatulus was previously
345
believed not to be endemic to this study area (Dessandier et al., 2018). The presence of the latter
346
was probably an indicator of transport from the estuary to the shelf, as this species is typically
347
found in Portuguese estuaries (Martins et al., 2015). The dominance of N. scaphum and A.
16
beccarii further suggested inputs from the estuary of phytoplankton or nutrients that may boost
349
local marine productivity, such as coccolithophores, as has been previously observed where the
350
Douro River flows into the ocean, where these species dominated the living fauna in late winter
351
(Dessandier et al., 2015). This may indicate an influx of relatively labile organic matter,
352
consistent with the progressive increase of faunal diversity during this period.
353
The second phase began with the Tagus mud belt establishment at around 2250 cal yr
354
BP, which was represented by the plot of PC1, when the Ca/Ti and Zr/Rb counts clearly
355
decreased and terrestrial elements (Fe/Ti, Pb/Ti, and BIT index, Fig. 4) increased. This suggests
356
a deposition of finer sediments of terrestrial origin in the Tagus prodelta during this period. This
357
important change in sedimentary conditions toward muddier and organic-rich sediment
358
(Martins et al., 2006) was observed in the Portuguese Margin earlier, at around 2000 cal yr BP
359
(Alt-Epping et al., 2009; Martins et al., 2007), and indicated the onset of the Tagus mud belt,
360
which was mainly composed of sediment exported from the Tagus estuary (Jouanneau et al.,
361
1998). This increase of organic compounds was also highlighted by the large increase in the
362
Br/Cl ratio during this phase. The reduction of bottom water currents driven by decreasing wind
363
and more humid conditions have been postulated as the physical processes that triggered a
364
strong Tagus River export of sediment and led to the formation of the mud belt around this time
365
(Alt-Epping et al., 2009). The mud belt formation was responsible for the increased
366
accumulation of organic matter, especially during Phase II, corresponding to the increased
367
levels of Br/Cl, TOC, and TN content (Fig. 4). The strong negative loading of both 13CTOC and
368
TOC on PC2 might suggest that the major supply of organic matter was driven by marine
369
production, particularly during the strong upwelling conditions that characterized Phase II. The
370
18O
bf in this area was primarily controlled by salinity, with a reduced temperature effect,
371
showing an increase in salinity during upwelling events (Lebreiro et al., 2006). This phase was
372
characterized by a large increase of C. carinata, V. bradyana, and B. marginata abundances,
17
indicating that higher trophic levels occurred in the sediments, caused by high organic matter
374
content in the mud belt. In this area, the active upwelling period corresponds to the most
375
eutrophic conditions, mainly highlighted by the abundance of C. carinata, associated with
376
marine organic matter (Br/Cl and 13CTOC; Fig. 6). Cassidulina carinata was already interpreted
377
as highly dominant in an active upwelling context and adapted to cold, nutrient-rich waters
378
(Bartels-Jónsdóttir et al., 2006; Martins et al., 2006). Together with this species, V. bradyana,
379
B. marginata, H. balthica, and U. bifurcate have essentially been found only in the dead
380
community and with almost no occurrence in the late winter (Dessandier et al., 2016). The
381
increase in V. bradyana abundance correlated with the onset of Phase II and the mud belt. This
382
result corroborated this species’ need for rich trophic conditions and suggested that the second
383
phase stabilized with the onset of strong upwelling conditions. Nonion scaphum and V.
384
bradyana were highly dominant during this interval, although N. scaphum was less abundant
385
than in Phase I. These two species live under organic-rich conditions and can tolerate anoxic
386
sediments (Fontanier et al., 2002; Barras et al., 2014), which may suggest that large terrestrial
387
inputs in this area led to periodic anoxia. The upwelling events create ideal environmental
388
conditions for diatom blooms that resulted in the presence of other species during summer
389
periods (Dessandier et al., 2016). This seasonal production indicated a preference of these
390
opportunistic species for summer periods, when the influence of upwelling is at its maximum.
391
During upwelling periods, diatoms are the major phytoplankton group responding to cold and
392
nutrient-rich ENACW. However, the preservation of this group as fossils is dependent on high
393
fluxes of individuals to the seabed (Abrantes et al., 1988), which constrains the use of this proxy
394
for environmental changes. Conversely, winter periods characterized by maximum continental
395
runoff had evidence of coccolithophore blooms, which responded to stratified waters (Abrantes
396
and Moita, 1999). Since phytoplanktonic groups favor certain environmental conditions, these
397
phytodetrital sources for benthic foraminifera may partially explain the seasonal variation in
18
species composition. This result may be the consequence of preferences for the specific
399
component of seasonally deposited phytodetritus, as has been observed in the Antarctic (Suhr
400
et al., 2003).
401
During Phases II and III, 13Cbf, representing the exported phytodetritus to the seafloor
402
(Curry et al., 1988), indicated higher primary production, whereas the increase of 15Nbulk may
403
illustrate nutrient degradation or a stronger influence of estuarine sources of organic matter
404
(Owens, 1985). Phase III was characterized by a change in organic matter sources from
405
predominantly marine origin (negative loads on PC2) to predominantly terrestrial origin
406
(positive loads on PC2). This period showed a drop in foraminiferal diversity corresponding to
407
the dominance of C. carinata (up to 43 %). The increase in abundance of the deep infaunal
408
species at around 1000 cal yr BP suggested this is when the enrichment in organic matter of the
409
prodelta occurred and might indicate episodic periods of dysoxia or even anoxia related to
410
potential eutrophication, such as the occurrence of G. affinis and C. oolina, well known to live
411
in highly eutrophic conditions, often below the oxic sediments (Jorissen et al., 1998; Mojtahid
412
et al., 2010a). The faunal evolution, in terms of assemblages and diversity within Phases II and
413
III, revealed other controlling factors independent of the presence of the Tagus mud belt,
414
represented by the PC2 (Fig. 6B). An increase in pollutants during this period was thought to
415
occur concomitantly with the disappearance of H. balthica and appearance of E. scaber, as has
416
been observed off Iberian rivers (Diz et al., 2002; Bartels-Jónsdóttir et al., 2006). The increase
417
of pollutants indicated by the appearance of E. scaber also fits the results of Alve (1995), who
418
described E. scaber as a pollution-tolerant species under aquaculture influence.
419 420
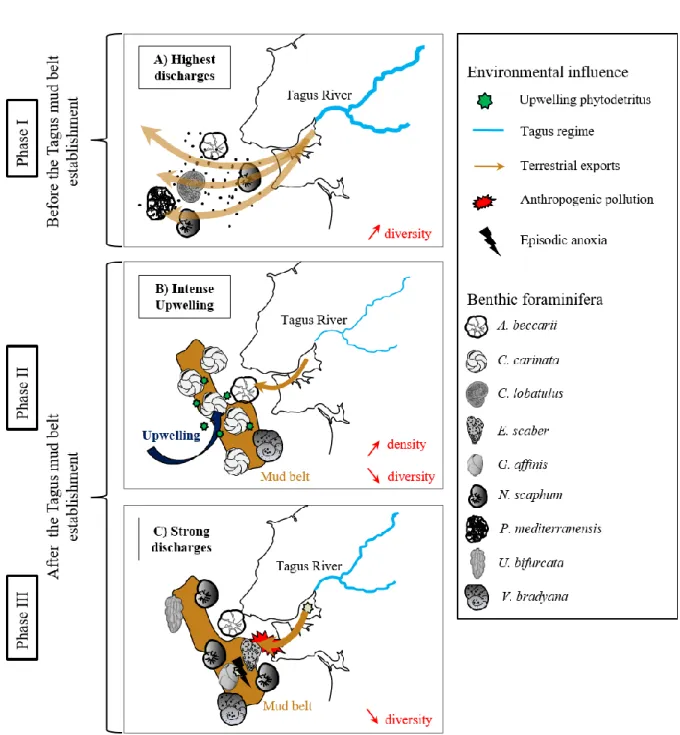
5.2. Reconstruction of environmental evolution in the Tagus prodelta during the last 5750 years
421
5.2.1. First phase (5750-2250 cal yr BP): High Tagus River discharge
19
The modern sediment cover in the Tagus prodelta is mainly supplied by terrestrial silts
423
and clays exported by Tagus River discharge (Jouanneau et al., 1998). The influence of sea
424
level changes on the Iberian Margin is no longer significant on the sedimentation after ~ 7000
425
yr BP (Vis et al., 2008). The sedimentary evolution of the Tagus prodelta was mainly controlled
426
by Tagus River discharge and impacted by climatic changes after this period. This area was
427
particularly characterized by very humid conditions between 6500 and 5500 yr BP,
428
corresponding to the African Humid Period (deMenocal et al., 2000; Renssen et al., 2006; Vis
429
et al., 2010). The coarse sediments observed during Phase I, highlighted by both environmental
430
and faunal evidence, are in good agreement with conditions described by Rodrigues et al.
431
(2009), who interpreted intense deforestation and soil destabilization as factors responsible for
432
the increased current velocity of the Tagus River. These coarse sediments with low organic
433
content and of marine origin were similar to sediments of modern inner shelf conditions
434
observed down to 50 m water depth in the Portuguese Margin (Schmidt et al., 2010). These
435
conditions are synthesized in Fig. 7A and demonstrate that when the Tagus River discharge was
436
large, it prevented any deposition of fine material on the mud belt, resulting in low
437
sedimentation rates. The fine sediment deposits of terrestrial origin were probably transported
438
further offshore during this phase. The position of Core 64PE332-30-2 might have been a zone
439
of fine sediment bypass similar to what is currently observed on the inner shelf. This explains
440
the low organic content, the low BIT index, and the 13CTOC that signaled the marine origin of
441
the sediments. Similar conditions were observed for this period in the Galicia mud deposit
442
(Martins et al., 2007; Bernárdez et al., 2008) and off the Guadiana River (Mendes et al., 2010)
443
and were believed to indicate a strong hydrodynamic regime. Tagus River floods have been
444
reconstructed in the lower Tagus River valley between 4900 and 3500 yr BP and were
445
associated with strong deforestation during this period (Vis et al., 2010).
20
The transition between Phases I and II was marked by a shift between the faunal and
447
environmental signals, between 2600 and 2250 cal yr BP (Fig. 5). The species that first reacted
448
to this, C. carinata, started to increase in abundance, resulting in a decrease in the relative
449
abundances of the other species, including the taxa indicators of river discharge. This reflected
450
the very opportunistic nature of C. carinata and provided a more accurate signal of the
451
environmental change than the geochemical parameters, which merely recorded the mud belt
452
conditions. A progressive decrease of fluvial influence was visible following the strong decline
453
of A. beccarii and N. scaphum, which has also been observed during the last 3000 years within
454
the Ría de Vigo (Diz et al., 2002). This may be the transition between colder and wetter
455
Subboreal conditions and warmer, dryer Sub-Atlantic conditions at 3000 yr BP (Alt-Epping et
456
al., 2009; Bernárdez et al., 2008). The Sub-Atlantic period was associated with the reduced
457
influence of winds on the Iberian Margin (Martins et al., 2007), a reduction in hydrodynamic
458
marine currents, and the collection of fine sediments in the Galicia mud deposit. These
459
conditions were responsible for the lateral movement of the mud deposit on the shelf, with the
460
construction of the mud belt at the beginning of Phase II (2250 cal yr BP). The accumulation
461
of muddy sediments on the shelf off the Tagus River at ~ 2000 years BP was synchronous with
462
the establishment of the mud belt off the Douro River (Drago et al., 1998). This coordination
463
suggests a response to regional rather than local change in the climate, responsible for a dryer
464
period and an increase of clay accumulation closer to the Tagus River mouth, due to the
465
decrease in Tagus discharge.
466 467
5.2.2. Second phase (2250-1250 cal yr BP): High upwelling intensity
468
After the onset of the Tagus mud belt at ~ 2250 cal yr BP, two alternative regimes
469
prevailed, one characterized by intense upwelling and the other by strong river discharge, as
470
summarized in Fig. 7B. During this phase, TN, 13C
bf, and 15Nbulk showed an increase in
21
productivity, probably due to a change in Tagus River flux conditions. However, this was not
472
recorded by all environmental parameters. The faunal results could indicate that the organic
473
matter supply during Phase II was related to upwelling events more than Tagus River inputs.
474
The decrease in the C/N ratio was not in agreement with 13CTOC data, making it difficult to
475
evaluate the organic matter source. The 13CTOC and the C/N ratio are often used to determine
476
the sources of organic matter (e.g., Hedges and Parker, 1976; Peters et al., 1978; Alt-Epping et
477
al., 2007). However, the C/N ratio is affected by the preferential remineralization of nitrogen in
478
marine sediments or nitrogen sorption onto clay minerals (Schubert and Calvert, 2001), and the
479
13C
TOC signal could be from a mixture of C3 and C4 plants, mimicking the isotopic signal of
480
marine algae (e.g., Goñi et al., 1998). Both of these indicators in the paleorecords might be
481
affected by organic matter degradation. Additionally, 15Nbulk could be affected in the study
482
area by a higher influence of agriculture and pollution (Alt-Epping et al., 2009). Nevertheless,
483
13C
TOC and the C/N ratio were useful to discriminate the marine and terrestrial sources of
484
organic matter in another study on the Portuguese Margin (Schmidt et al., 2010). In the present
485
study, only the C/N ratio seemed to be clearly affected by the early diagenesis. These organic
486
parameters were essential to compare the environmental signal with benthic foraminifera, and
487
their disagreement confirms the importance of using a multiproxy approach that included
bio-488
indicators that are less affected by organic matter degradation.
489
Phase II began at 2250 cal yr BP with a low amount of terrestrial input (indicated by the
490
negative loading of PC2; Fig. 6) and lasted until 1800 cal yr BP, which corresponded to the RP
491
(Lamb, 1985; Bernárdez et al., 2008). Despite the increase in eutrophy-tolerant species, the
492
faunal diversity and BFN were low at the beginning of the RP. The deposition of contaminants
493
and increased sediment accumulation rate may have limited faunal production during this
494
period. Lebreiro et al. (2006) also observed a large export of terrestrial particles into the Tagus
495
prodelta during the RP. This export was interpreted as a consequence of anthropogenic
22
activities, such as Roman gold mining, along the Tagus River. This export of terrestrial material
497
may have been enhanced by the NAO- phase that occurred during that period and led to
498
intensified rainfall in the Portuguese Margin (Abrantes et al., 2005). Periods of NAO- have
499
strongly influenced Iberian river discharge, especially on the Tagus River (Trigo et al., 2004).
500
The northern part of the Iberian Margin is marked by varying rainfall responses. This zone,
501
which is very close to the limit of the NAO influence, is known to alternate between positive
502
and negative correlation with the NAO and humid conditions (Alvarez and Gomez-Gesteira,
503
2006). Desprat et al. (2003) also identified warm and relatively humid conditions during the RP
504
in the Ría de Vigo. A strong river regime such as this one was not observed off the Capbreton
505
in the bay of Biscay (Mojtahid et al., 2009), suggesting an anti-correlation of the NAO phases
506
between the two study areas.
507
The end of Phase II showed a decrease in the Tagus River influence that corresponded
508
with an increase in positive loading of PC2, characterized by high marine organic matter content
509
likely brought by active upwelling conditions. The increased abundance of C. carinata
510
corroborated this context in the middle of Phase II, corresponding to a period of intense
511
upwelling activity, which has also been described in the same area in a study using benthic
512
foraminifera (Bartels-Jónsdóttir et al., 2006). The dominance of the opportunistic species C.
513
carinata constrained faunal diversity, as observed in other studies (Fontanier et al., 2003;
514
Dessandier et al., 2018). However, C. carinata did not increase until the end of Phase II,
515
suggesting that the intensity of upwelling slowed down at the end of this phase. By contrast,
516
the Tagus mud belt built up, allowing an increased deposition of marine organic matter until
517
the end of Phase II. This difference could be the result of biased organic parameters (e.g., caused
518
by early diagenesis). In addition, this study area was characterized by organic matter from
519
different sources, which were recorded as a mixture of marine and terrestrial compounds by the
520
organic parameters. What was revealed by the organic parameters as a record of upwelling
23
activity could instead result from high productivity throughout the entire year. Therefore,
522
benthic foraminiferal species recorded the organic matter sources more accurately.
523 524
5.2.3. Third phase (1250 cal yr BP-present): Alternating upwelling and Tagus discharge
525
influence
526
The beginning of Phase III (Fig. 7C), which corresponds to the DA, was followed by
527
the MWP, which occurred between 1100 and 600 yr BP, as reported in several studies
528
performed on the Portuguese Margin (e.g., Desprat et al., 2003; Rosa et al., 2007). The DA was
529
described as a period characterized by strong upwelling activity off the Douro River (Rosa et
530
al., 2007). The MWP is also well known in the Portuguese Margin as a period characterized by
531
active upwelling conditions triggered by NAO+ conditions (Abrantes et al., 2005;
Bartels-532
Jónsdóttir et al., 2006; Rosa et al., 2007; Rodrigues et al., 2009). The high primary productivity
533
was linked to upwelling events and created eutrophic conditions in sediments that allowed for
534
less competition among B. spathulata, P. mediterranensis, Cribroelphidium gerthi, and H.
535
balthica. This period, characterized by a warm and dry climate, was influenced by
536
anthropogenic activities and soil erosion (Rodrigues et al., 2009) that caused Fe and Pb to be
537
massively transported via Tagus River runoff to the prodelta. Dry soils restrained infiltration
538
and possibly triggered large flooding of the Tagus River (Benito et al., 2003). The increased
539
BIT index (Warden et al., 2016) and Fe/Ti and Pb/Ti ratios during the beginning of the MWP
540
suggested increased terrestrial input, corresponding with the increased loading of PC2 in the
541
first part of Phase III and the accumulation of finer sediments.
542
The LIA, between 600 and 100 yr BP, was characterized by the increase in terrestrial
543
material, as shown by the abrupt increase in the BIT index and Fe/Ti and Pb/Ti ratios at 250 cal
544
yr BP. This increase was also highlighted by the sharp decrease in PC2 (Fig. 6B), which could
545
be linked to the Lisbon earthquake in 1755 AD (200 cal yr BP; Abrantes et al., 2008) or to
24
massive exports of fine sediments from the Tagus River (low Zr/Rb). This period has been
547
described as characterized by abrupt cooling and wet conditions (Bradley, 2000). The LIA was
548
affected by high-frequency episodic Tagus River paleo-floods (Benito et al., 2003) and has been
549
associated with the transport of fine sediments from the continent via discharge from the Tagus
550
River under NAO- conditions (Abrantes et al., 2005; Bartels-Jónsdóttir et al., 2006). During the
551
LIA, an abrupt decrease in the abundance of C. carinata may indicate that a reduction in
552
upwelling conditions occurred. V. bradyana, E. scaber, A. beccarii, and deep infaunas
553
increased, possibly as a consequence of episodic anoxia and the presence of contaminants. The
554
presence of the deep infaunas that can tolerate refractory organic matter (Murray, 2006)
555
suggests a decrease in organic matter quality, as was also observed in the Galicia mud deposit
556
during this period (Martins et al., 2006). This decrease in quality may be the major cause of the
557
decreased infaunal diversity that occurred between 1000 cal yr BP and the present.
558
Nevertheless, the faunal results suggested that intense upwelling periods also occurred during
559
the LIA, as demonstrated by the increased abundance of C. carinata. This highlighted that this
560
period was unstable and characterized by several environmental changes. The results from this
561
study were in good agreement with previous studies in the same area for the last 2000 years
562
(Abrantes et al., 2005; Bartels-Jónsdóttir et al., 2006; Alt-Epping et al., 2009), except for small
563
time shifts in the upwelling versus Tagus River discharge periods corresponding to the
564
transition between Phases I and II. These time shifts could be the consequence of different age
565
models. Bartels-Jónsdóttir et al. (2006) demonstrated that an “intense upwelling period”
566
occurred, followed by a “very intense upwelling period” during the MWP, and finally a large
567
Tagus River discharge during the LIA, all determined through the analysis of benthic
568
foraminiferal distribution.
569
There were some differences during the MWP and the LIA between the reconstructions
570
from this study and the results from Bartels-Jónsdóttir et al. (2006). These variations could be
25
due to a different interpretation of certain species, specifically N. scaphum, which was
572
determined to be controlled by upwelling in previous studies; by contrast, it was used as a river
573
discharge proxy in this study, based on the ecological results from the study area (Dessandier
574
et al., 2016). The use of environmental data combined with the composition of the major species
575
in this study may allow a better interpretation of the mud belt onset than merely using benthic
576
foraminiferal data. Our results were also in good agreement with the reconstruction of the Tagus
577
River discharge and the upwelling strength reported in Abrantes et al. (2009).
578
Finally, during the last century, this area was contaminated by anthropogenic pollution,
579
including numerous trace metals that were measured in excess in the Tagus estuary, such as
580
AS, Pb, Zn, Cu, and Cd (Caçador et al., 1996; Jouanneau et al., 1998). The catchment area was
581
also influenced by anthropogenic contaminants, such as domestic sewage and industrial wastes
582
(e.g., petrochemistry, fertilizers, smelters; Carvalho, 1997). Our analyses were not performed
583
to identify the sources of anthropogenic pollution; however, the XRF signal shows a clear
584
increase of several contaminants (such as Pb) in the most recent interval. We do not have
585
enough faunal resolution and environmental data to investigate the anthropogenic influence on
586
benthic ecosystems, but we assume that the faunal assemblages respond to this anthropogenic
587
activity, as shown in other environments (e.g., Alve, 1995). The faunal distribution shows
588
increased abundances of deep infaunal species and of E. scaber but the disappearance of other
589
species, such as H. balthica, as has already been observed as a consequence of anthropogenic
590
pollution in the Tagus prodelta (Bartels-Jónsdóttir et al., 2006). The last century was also
591
characterized by the construction of dams, which have likely influenced the sequestration of
592
organic matter in the estuary and changed the influence of the Tagus River discharge on the
593
shelf through increased input of finer material (Jouanneau et al., 1998) and increased correlation
594
with NAO phases (Trigo et al., 2004), all of which could have significant environmental
595
consequences that will be crucial to understand in the future.
26 597
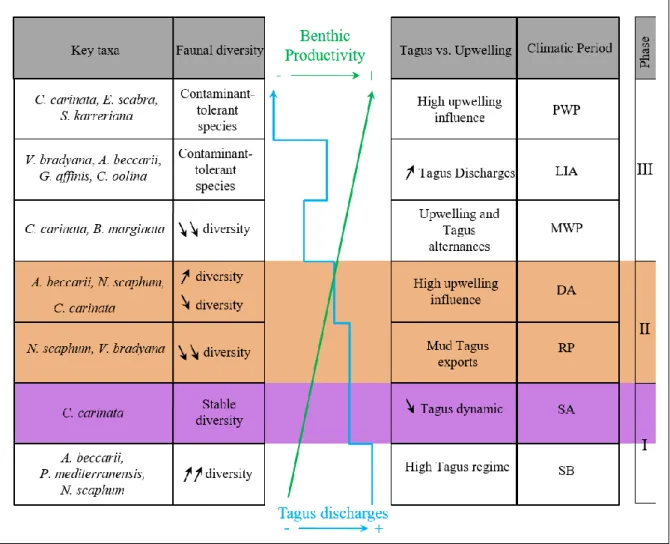
6. Conclusions
598
The results of this study demonstrate the validity of using benthic foraminifera as
bio-599
indicators of past river discharge and upwelling intensity in the Tagus prodelta during the last
600
5750 years. Major environmental changes, linked with late Holocene climatic variations, are
601
summarized by key benthic foraminiferal taxa data in Fig. 8. This study showed an additional
602
phase, between 5750 and 2250 cal yr BP, that has not yet been investigated in the Portuguese
603
shelf. This phase was characterized by coarser sediment cover and dominated mostly by N.
604
scaphum and A. beccarii, suggesting a very dynamic Tagus River system that facilitated the
605
dispersion of coarse terrigenous particles onto the prodelta.
606
The progressive decrease of the Tagus River flow, resulting in the establishment of the
607
modern Tagus mud belt, was the major process explaining the environmental changes that
608
occurred before Phase II. The presence of a transition period (2500-2250 cal yr BP) at the end
609
of Phase I was only supported by the composition of the benthic foraminifera; geochemical data
610
did not reveal any environmental changes. This might be due to the extremely poor preservation
611
of organic matter in coarse sediments (in which benthic foraminifera are fairly well preserved).
612
Phase II (2250-1250 cal yr BP) was characterized by fine continental deposits,
613
responsible for a better food stock for benthic organisms throughout the record. This phase was
614
marked by the increase of C. carinata, V. bradyana, and B. marginata, opportunistic species
615
that mark the increase in upwelling intensity in this area, revealing the strongest upwelling
616
activity during the DA and the MWP. The high organic matter stocks in the Tagus prodelta
617
during this phase created more refractory organic matter, responsible for a faunal diversity
618
decrease from 2250 cal yr BP to present.
619
Phase III (1250 cal yr BP-present) showed the disappearance of B. spathulata, P.
620
mediterranensis, and H. balthica and the decrease of A. beccarii and N. scaphum, which may
27
be a consequence of a decrease in the organic matter quality and/or the occurrence of
622
anthropogenic pollution, as indicated by benthic foraminiferal assemblages and the XRF data.
623
Conversely, E. scaber increased, probably because of its pollution tolerance, and C. carinata
624
remained dominant, likely due to the strong upwelling conditions. Benthic foraminifera
625
responded accurately to record environmental and climate changes in the North Atlantic
626
continental shelf and therefore could be used as a bio-indicator of environmental changes, such
627
as changes in upwelling activity and river discharge, that were directly linked with the NAO.
628 629
Acknowledgments
630
The authors wish to thank the captain and crew of R/V Pelagia and NIOZ marine
631
technicians for work at sea and Silvia Nave at LNEG for the help during the cruise preparation.
632
Ship time for R/V Pelagia cruise 64PE332 was funded by the Netherlands Organization for
633
Scientific Research (NWO), as part of the PACEMAKER project, funded by the ERC under
634
the European Union's Seventh Framework Program (FP7/2007-2013). Part of the radiocarbon
635
analyses were funded by the HAMOC (ANR) Project. J.-H. Kim was also partly supported by
636
the National Research Foundation of Korea (NRF) grant funded by the Korea government
637
(MSICT) (No. NRF-2016R1A2B3015388, PN17100). P.-A. Dessandier was supported by the
638
Research Council of Norway through its Center of Excellence funding scheme for CAGE,
639 project number 223259. 640 641 References 642 643
Abrantes, F., 1988. Diatom assemblages as upwelling indicators in surface sediments off
644
Portugal. Mar. Geol. 85, 15–39.Abrantes, F., Moita, M.T., 1999. Water column and