Publisher’s version / Version de l'éditeur:
Vous avez des questions? Nous pouvons vous aider. Pour communiquer directement avec un auteur, consultez la première page de la revue dans laquelle son article a été publié afin de trouver ses coordonnées. Si vous n’arrivez pas à les repérer, communiquez avec nous à PublicationsArchive-ArchivesPublications@nrc-cnrc.gc.ca.
Questions? Contact the NRC Publications Archive team at
PublicationsArchive-ArchivesPublications@nrc-cnrc.gc.ca. If you wish to email the authors directly, please see the first page of the publication for their contact information.
https://publications-cnrc.canada.ca/fra/droits
L’accès à ce site Web et l’utilisation de son contenu sont assujettis aux conditions présentées dans le site LISEZ CES CONDITIONS ATTENTIVEMENT AVANT D’UTILISER CE SITE WEB.
Proceedings of the 55th Annual Meeting of the Association for Computational
Linguistics. Volume 2: Short Papers, pp. 465-470, 2017-07
READ THESE TERMS AND CONDITIONS CAREFULLY BEFORE USING THIS WEBSITE. https://nrc-publications.canada.ca/eng/copyright
NRC Publications Archive Record / Notice des Archives des publications du CNRC :
https://nrc-publications.canada.ca/eng/view/object/?id=b132b0af-2ae0-4964-ac3a-493e7292a37a https://publications-cnrc.canada.ca/fra/voir/objet/?id=b132b0af-2ae0-4964-ac3a-493e7292a37a
NRC Publications Archive
Archives des publications du CNRC
This publication could be one of several versions: author’s original, accepted manuscript or the publisher’s version. / La version de cette publication peut être l’une des suivantes : la version prépublication de l’auteur, la version acceptée du manuscrit ou la version de l’éditeur.
For the publisher’s version, please access the DOI link below./ Pour consulter la version de l’éditeur, utilisez le lien DOI ci-dessous.
https://doi.org/10.18653/v1/P17-2074
Access and use of this website and the material on it are subject to the Terms and Conditions set forth at
Best-worst scaling more reliable than rating scales: a case study on
sentiment intensity annotation
Best–Worst Scaling More Reliable than Rating Scales:
A Case Study on Sentiment Intensity Annotation
Svetlana Kiritchenko and Saif M. Mohammad National Research Council Canada
{svetlana.kiritchenko,saif.mohammad}@nrc-cnrc.gc.ca
Abstract
Rating scales are a widely used method for data annotation; however, they present several challenges, such as difficulty in maintaining inter- and intra-annotator con-sistency. Best–worst scaling (BWS) is an alternative method of annotation that is claimed to produce high-quality anno-tations while keeping the required num-ber of annotations similar to that of rat-ing scales. However, the veracity of this claim has never been systematically estab-lished. Here for the first time, we set up an experiment that directly compares the rat-ing scale method with BWS. We show that with the same total number of annotations, BWS produces significantly more reliable results than the rating scale.
1 Introduction
When manually annotating data with quantitative or qualitative information, researchers in many disciplines, including social sciences and com-putational linguistics, often rely on rating scales (RS). A rating scale provides the annotator with a choice of categorical or numerical values that rep-resent the measurable characteristic of the rated data. For example, when annotating a word for sentiment, the annotator can be asked to choose among integer values from 1 to 9, with 1 represent-ing the strongest negative sentiment, and 9 repre-senting the strongest positive sentiment (Bradley and Lang, 1999; Warriner et al., 2013). An-other example is the Likert scale, which measures responses on a symmetric agree–disagree scale, from ‘strongly disagree’ to ‘strongly agree’ ( Lik-ert,1932). The annotations for an item from mul-tiple respondents are usually averaged to obtain a realvalued score for that item. Thus, for an N
-item set, if each -item is to be annotated by five respondents, then the number of annotations re-quired is 5N .
While frequently used in many disciplines, the rating scale method has a number of limitations (Presser and Schuman, 1996; Baumgartner and Steenkamp,2001). These include:
• Inconsistencies in annotations by different annotators: one annotator might assign a score of 7 to the word good on a 1-to-9 sen-timent scale, while another annotator can as-sign a score of 8 to the same word.
• Inconsistencies in annotations by the same annotator: an annotator might assign differ-ent scores to the same item when the annota-tions are spread over time.
• Scale region bias: annotators often have a bias towards a part of the scale, for example, preference for the middle of the scale. • Fixed granularity: in some cases,
annota-tors might feel too restricted with a given rat-ing scale and may want to place an item in-between the two points on the scale. On the other hand, a fine-grained scale may over-whelm the respondents and lead to even more inconsistencies in annotation.
Paired Comparisons (Thurstone, 1927; David, 1963) is a comparative annotation method, where respondents are presented with pairs of items and asked which item has more of the property of in-terest (for example, which is more positive). The annotations can then be converted into a ranking of items by the property of interest, and one can even obtain real-valued scores indicating the de-gree to which an item is associated with the prop-erty of interest. The paired comparison method does not suffer from the problems discussed above for the rating scale, but it requires a large number of annotations—order N2, where N is the number of items to be annotated.
Best–Worst Scaling (BWS)is a less-known, and more recently introduced, variant of compara-tive annotation. It was developed by Louviere (1991), building on some groundbreaking research in the 1960s in mathematical psychology and psy-chophysics by Anthony A. J. Marley and Duncan Luce. Annotators are presented with n items at a time (an n-tuple, where n > 1, and typically n = 4). They are asked which item is the best (highest in terms of the property of interest) and which is the worst (lowest in terms of the property of in-terest). When working on 4-tuples, best–worst notations are particularly efficient because by an-swering these two questions, the results for five out of six item–item pair-wise comparisons become known. All items to be rated are organized in a set of m 4-tuples (m ≥ N , where N is the num-ber of items) so that each item is evaluated several times in diverse 4-tuples. Once the m 4-tuples are annotated, one can compute real-valued scores for each of the items using a simple counting proce-dure (Orme,2009). The scores can be used to rank items by the property of interest.
BWS is claimed to produce high-quality tations while still keeping the number of tations small (1.5N –2N tuples need to be anno-tated) (Louviere et al.,2015;Kiritchenko and Mo-hammad, 2016a). However, the veracity of this claim has never been systematically established. In this paper, we pit the widely used rating scale squarely against BWS in a quantitative experiment to determine which method provides more reliable results. We produce real-valued sentiment inten-sity ratings for 3,207 English terms (words and phrases) using both methods by aggregating re-sponses from several independent annotators. We show that BWS ranks terms more reliably, that is, when comparing the term rankings obtained from two groups of annotators for the same set of terms, the correlation between the two sets of ranks produced by BWS is significantly higher than the correlation for the two sets obtained with RS. The difference in reliability is more marked when about 5N (or less) total annotations are ob-tained, which is the case in many NLP annotation projects (Strapparava and Mihalcea,2007;Socher et al.,2013;Mohammad and Turney,2013). Fur-thermore, the reliability obtained by rating scale when using ten annotations per term is matched by BWS with only 3N total annotations (two an-notations for each of the 1.5N 4-tuples).
The sparse prior work in natural language annotations that uses BWS involves the cre-ation of datasets for relcre-ational similarity (Jurgens et al.,2012), word-sense disambiguation (Jurgens, 2013), and word–sentiment intensity (Kiritchenko and Mohammad,2016a). However, none of these works has systematically compared BWS with the rating scale method. We hope that our findings will encourage the use of BWS more widely to obtain high-quality NLP annotations. All data from our experiments as well as scripts to generate BWS tuples, to generate item scores from BWS annotations, and for assessing reliability of the an-notations are made freely available.1
2 Complexities of Comparative Evaluation
Both rating scale and BWS are less than perfect ways to capture the true word–sentiment intensi-ties in the minds of native speakers of a language. Since the “true” intensities are not known, deter-mining which approach is better is non-trivial.2
A useful measure of quality is reproducibility— if repeated independent manual annotations from multiple respondents result in similar sentiment scores, then one can be confident that the scores capture the true sentiment intensities. Thus, we set up an experiment that compares BWS and RS in terms of how similar the results are on repeated independent annotations.
It is expected that reproducibility improves with the number of annotations for both methods. (Es-timating a value often stabilizes as the sample size is increased.) However, in rating scale annota-tion, each item is annotated individually whereas in BWS, groups of four items (4-tuples) are anno-tated together (and each item is present in multi-ple different 4-tumulti-ples). To make the reproducibil-ity evaluation fair, we ensure that the term scores are inferred from the same total number of anno-tations for both methods. For an N -item set, let krsbe the number of times each item is annotated
via a rating scale. Then the total number of rating scale annotations is krsN . For BWS, let the same
N -item set be converted into m 4-tuples that are each annotated kbwstimes. Then the total number
of BWS annotations is kbwsm. In our experiments,
we compare results across BWS and rating scale at points when krsN = kbwsm.
1
www.saifmohammad.com/WebPages/BestWorst.html
2Existing sentiment lexicons are a result of one or the
The cognitive complexity involved in answer-ing a BWS question is different from that in a rat-ing scale question. On the one hand, for BWS, the respondent has to consider four items at a time simultaneously. On the other hand, even though a rating scale question explicitly involves only one item, the respondent must choose a score that places it appropriately with respect to other items.3 Quantifying the degree of cognitive load of a BWS annotation vs. a rating scale annotation (especially in a crowdsourcing setting) is partic-ularly challenging, and beyond the scope of this paper. Here we explore the extent to which the rating scale method and BWS lead to the same re-sulting scores when the annotations are repeated, controlling for the total number of annotations.
3 Annotating for Sentiment
We annotated 3,207 terms for sentiment inten-sity (or degree of positive or negative valence) with both the rating scale and best–worst scaling. The annotations were done by crowdsourcing on CrowdFlower.4 The workers were required to be native English speakers from the USA.
3.1 Terms
The term list includes 1,621 positive and negative single words from Osgood’s valence subset of the General Inquirer (Stone et al., 1966). It also in-cluded 1,586 high-frequency short phrases formed by these words in combination with simple nega-tors (e.g., no, don’t, and never), modals (e.g., can, might, and should), or degree adverbs (e.g., very and fairly). More details on the term selection can be found in (Kiritchenko and Mohammad,2016b).
3.2 Annotating with Rating Scale
The annotators were asked to rate each term on a 9-point scale, ranging from −4 (extremely nega-tive) to 4 (extremely posinega-tive). The middle point (0) was marked as ‘not at all positive or nega-tive’. Example words were provided for the two extremes (−4 and 4) and the middle (0) to give the annotators a sense of the whole scale.
Each term was annotated by twenty workers for the total number of annotations to be 20N (N =
3A somewhat straightforward example is that good cannot
be given a sentiment score less than what was given to okay, and it cannot be given a score greater than that given to great. Often, more complex comparisons need to be considered.
4The full set of annotations as well as the
instruc-tions to annotators for both methods are available at http://www.saifmohammad.com/WebPages/BestWorst.html. 20 40 60 80 0 20 40 60 80 % in con siste n cies
time span (hours)
all terms single words phrases
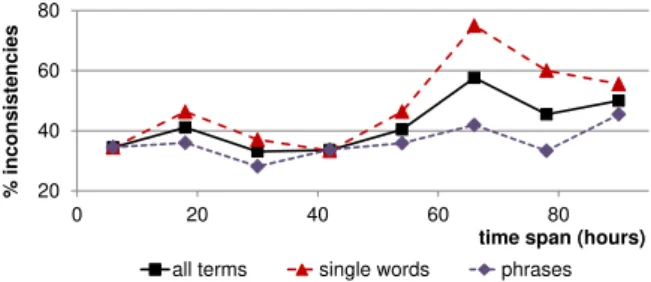
Figure 1: The inconsistency rate in repeated anno-tations by same workers using rating scale. 3, 207 is the number of terms). A small portion (5%) of terms were internally annotated by the au-thors. If a worker’s accuracy on these check ques-tions fell below 70%, that worker was refused fur-ther annotation, and all of their responses were dis-carded. The final score for each term was set to the mean of all ratings collected for this term.5 On av-erage, the ratings of a worker correlated well with the mean ratings of the rest of the workers (average Pearson’s r = 0.9, min r = 0.8). Also, the Pear-son correlation between the obtained mean ratings and the ratings from similar studies by Warriner et al.(2013) and byDodds et al.(2011) were 0.94 (on 1,420 common terms) and 0.96 (on 998 com-mon terms), respectively.6
To determine how consistent individual annota-tors are over time, 180 terms (90 single words and 90 phrases) were presented for annotation twice with intervals ranging from a few minutes to a few days. For 37% of these instances, the annotations for the same term by the same worker were differ-ent. The average rating difference for these incon-sistent annotations was 1.27 (on a scale from −4 to 4). Fig.1shows the inconsistency rate in these repeated annotations as a function of time inter-val between the two annotations. The inconsis-tency rate is averaged over 12-hour periods. One can observe that intra-annotator inconsistency in-creases with the increase in time span between the annotations. Single words tend to be annotated with higher inconsistency than phrases. However, when annotated inconsistently, phrases have larger average difference between the scores (1.28 for phrases vs. 1.21 for single words). Twelve out of 90 phrases (13%) have the average difference greater than or equal to 2 points. This shows that it is difficult for annotators to remain consistent when using the rating scale.
5
When evaluated as described in Sections4and5, median and mode produced worse results than mean.
6Warriner et al.(2013) list a correlation of 0.95 on 1029
3.3 Annotating with Best–Worst Scaling The annotators were presented with four terms at a time (a 4-tuple) and asked to select the most pos-itive term and the most negative term. The same quality control mechanism of assessing a worker’s accuracy on internally annotated check questions (discussed in the previous section) was employed here as well. 2N (where N = 3, 207) distinct 4-tuples were randomly generated in such a manner that each term was seen in eight different 4-tuples, and no term appeared more than once in a tuple.7 Each 4-tuple was annotated by 10 workers. Thus, the total number of annotations obtained for BWS was 20N (just as in RS). We used the partial sets of 1N , 1.5N , and the full set of 2N 4-tuples to investigate the impact of the number of unique 4-tuples on the quality of the final scores.
We applied the counting procedure to ob-tain real-valued term–sentiment scores from the BWS annotations (Orme,2009;Flynn and Marley, 2014): the term’s score was calculated as the per-centage of times the term was chosen as most pos-itive minus the percentage of times the term was chosen as most negative. The scores range from −1(most negative) to 1 (most positive). This sim-ple and efficient procedure has been shown to pro-duce results similar to ones obtained with more so-phisticated statistical models, such as multinomial logistic regression (Louviere et al.,2015).
In a separate study, we use the resulting dataset of 3,207 words and phrases annotated with real-valued sentiment intensity scores by BWS, which we call Sentiment Composition Lexicon for Nega-tors, Modals, and Degree Adverbs (SCL-NMA), to analyze the effect of different modifiers on sen-timent (Kiritchenko and Mohammad,2016b).
4 How different are the results obtained
by rating scale and BWS?
The difference in final outcomes of BWS and RS can be determined in two ways: by directly com-paring term scores or by comcom-paring term ranks. To compare scores, we first linearly transform the BWS and rating scale scores to scores in the range 0 to 1. Table1shows the differences in scores, dif-ferences in rank, Spearman rank correlation ρ, and Pearson correlation r for 3N , 5N , and 20N anno-tations. Observe that the differences are markedly larger for commonly used annotation scenarios
7The script used to generate the 4-tuples is available at
http://www.saifmohammad.com/WebPages/BestWorst.html.
# annotations ∆ score ∆ rank ρ r
3N 0.11 397 0.85 0.85
5N 0.10 363 0.87 0.88
20N 0.08 264 0.93 0.93
Table 1: Differences in final outcomes of BWS and RS, for different total numbers of annotations.
Term set # terms ρ r
all terms 3,207 .93 .93
single words 1621 .94 .95
all phrases 1586 .92 .91
negated phrases 444 .74 .79
pos. phrases that have a negator 83 -.05 -.05 neg. phrases that have a negator 326 .46 .46
modal phrases 418 .75 .82
pos. phrases that have a modal 272 .44 .45 neg. phrases that have a modal 95 .57 .56
adverb phrases 724 .91 .95
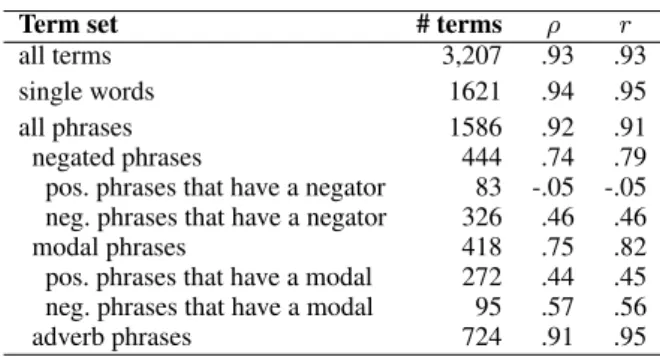
Table 2: Correlations between sentiment scores produced by BWS and rating scale.
where only 3N or 5N total annotations are ob-tained, but even with 20N annotations, the differ-ences across RS and BWS are notable.
Table 2 shows Spearman (ρ) and Pearson (r) correlation between the ranks and scores produced by RS and BWS on the full set of 20N annota-tions. Notice that the scores agree more on single terms and less so on phrases. The correlation is no-ticeably lower for phrases involving negations and modal verbs. Furthermore, the correlation drops dramatically for positive phrases that have a nega-tor (e.g., not hurt, nothing wrong).8 The anno-tators also showed greater inconsistencies while scoring these phrases on the rating scale (std. dev. σ = 1.17 compared to σ = 0.81 for the full set). Thus it seems that the outcomes of rating scale and BWS diverge to a greater extent when the com-plexity of the items to be rated increases.
5 Annotation Reliability
To assess the reliability of annotations produced by a method (BWS or rating scale), we calculate average split-half reliability (SHR) over 100 trials. SHR is a commonly used approach to determine consistency in psychological studies, that we em-ploy as follows. All annotations for a term or a tuple are randomly split into two halves. Two sets
8
A term was considered positive (negative) if the scores obtained for the term with rating scale and BWS are both greater than or equal to zero (less than zero). Some terms were rated inconsistently by the two methods; therefore, the number of the positive and negative terms for a category (negated phrases and modal phrases) does not sum to the total number of terms in the category.
0.75 0.8 0.85 0.9 0.95 1 0 5000 10000 15000 20000 25000 30000 ρ
number of annotations in each half-set
Rating Scale BWS, 1N BWS, 1.5N BWS, 2N
RS half-sets: 4N (~13K) ann. vs. 4N (~13K) ann.
Each half-set includes 4 ann./term for N terms
BWS half-sets: 4N (~13K) ann. vs. 4N (~13K) ann.
Each half-set includes 2 ann./tuple for 2N tuples
Figure 2: SHR for RS and BWS (for N = 3207).
of scores are produced independently from the two halves. Then the correlation between the two sets of scores is calculated. If a method is more reli-able, then the correlation of the scores produced by the two halves will be high. Fig. 2 shows the Spearman rank correlation (ρ) for half-sets ob-tained from rating scale and best–worst scaling data as a function of the available annotations in each half-set. It shows for each annotation set the split-half reliability using the full set of annota-tions (10N per half-set) as well as partial sets ob-tained by choosing krs annotations per term for
rating scale (where krs ranges from 1 to 10) or
kbwsannotations per 4-tuple for BWS (where kbws
ranges from 1 to 5). The graph also shows BWS results obtained using 1N , 1.5N , and 2N unique 4-tuples. In each case, the x-coordinate repre-sents the total number of annotations in each half-set. Recall that the total number of annotations for rating scale equals krsN , and for BWS it equals
kbwsm, where m is the number of 4-tuples. Thus,
for the case where m =2N , the two methods are compared at points where krs=2kbws.
There are two important observations we can make from Fig. 2. First, we can conclude that the reliability of the BWS annotations is very sim-ilar on the sets of 1N , 1.5N , and 2N annotated 4-tuples as long as the total number of annotations is the same. This means that in practice, in order to improve annotation reliability, one can increase either the number of unique 4-tuples to annotate or the number of independent annotations for each 4-tuple. Second, annotations produced with BWS are more reliable than annotations obtained with rating scales. The difference in reliability is es-pecially large when only a small number of an-notations (≤ 5N ) are available. For the full set of more than 64K annotations (10N = ∼32K in
Term set # terms BWS RS
all terms 3,207 .98 .95
single words 1621 .98 .96
all phrases 1586 .98 .94
negated phrases 444 .91 .78
pos. phrases that have a negator 83 .79 .17
neg. phrases that have a negator 326 .81 .49
modal phrases 418 .96 .80
pos. phrases that have a modal 272 .89 .53
neg. phrases that have a modal 95 .83 .63
adverb phrases 724 .97 .92
Table 3: Average SHR for BWS and rating scale (RS) on different subsets of terms.
each half-set) available for both methods, the av-erage split-half reliability for BWS is ρ = 0.98 and for the rating scale method the reliability is ρ = 0.95 (the difference is statistically significant, p < .001). One can obtain a reliability of ρ = 0.95 with BWS using just 3N (∼10K) annotations in a half-set (30% of what is needed for rating scale).9 Table 3 shows the split-half reliability (SHR) on different subsets of terms. Observe that posi-tive phrases that include a negator (the class that diverged most across BWS and rating scale), is also the class that has an extremely low SHR when annotated by rating scale. The drop in SHR for the same class when annotated with BWS is much less. Similar pattern is observed for other phrase classes as well, although to a lesser extent. All of the results shown in this section, indicate that BWS surpasses rating scales on the ability to reliably rank items by sentiment, especially for phrasal items that are linguistically more complex.
6 Conclusions
We presented an experiment that directly com-pared the rating scale method of annotation with best–worst scaling. We showed that, controlling for the total number of annotations, BWS pro-duced significantly more reliable results. The dif-ference in reliability was more marked when about 5N (or less) total annotations for an N -item set were obtained. BWS was also more reliable when used to annotate linguistically complex items such as phrases with negations and modals. We hope that these findings will encourage the use of BWS more widely to obtain high-quality annotations.
Acknowledgments
We thank Eric Joanis and Tara Small for discus-sions on best–worst scaling and rating scales.
9Similar trends are observed with Pearson’s coefficient
References
Hans Baumgartner and Jan-Benedict E.M. Steenkamp.
2001. Response styles in marketing research: A
cross-national investigation. Journal of Marketing
Research38(2):143–156.
Margaret M. Bradley and Peter J. Lang. 1999. Affec-tive norms for English words (ANEW): Instruction manual and affective ratings. Technical report, The Center for Research in Psychophysiology, Univer-sity of Florida.
Herbert Aron David. 1963. The method of paired com-parisons. Hafner Publishing Company, New York. Peter Sheridan Dodds, Kameron Decker Harris,
Is-abel M. Kloumann, Catherine A. Bliss, and
Christo-pher M. Danforth. 2011. Temporal patterns of
happiness and information in a global social
net-work: Hedonometrics and Twitter. PloS One
6(12):e26752.
T. N. Flynn and A. A. J. Marley. 2014. Best-worst scal-ing: theory and methods. In Stephane Hess and An-drew Daly, editors, Handbook of Choice Modelling, Edward Elgar Publishing, pages 178–201.
David Jurgens. 2013. Embracing ambiguity: A
com-parison of annotation methodologies for crowd-sourcing word sense labels. In Proceedings of the Annual Conference of the North Amer-ican Chapter of the Association for
Computa-tional Linguistics: Human Language
Technolo-gies (NAACL). Atlanta, Georgia, pages 556–562.
http://aclweb.org/anthology/N13-1062.
David Jurgens, Saif M. Mohammad, Peter Turney,
and Keith Holyoak. 2012. SemEval-2012 Task 2:
Measuring degrees of relational similarity. In Pro-ceedings of the International Workshop on Seman-tic Evaluation (SemEval). Montr´eal, Canada, pages
356–364.
http://www.aclweb.org/anthology/S12-1047.
Svetlana Kiritchenko and Saif M. Mohammad. 2016a.
Capturing reliable fine-grained sentiment associa-tions by crowdsourcing and best–worst scaling. In Proceedings of the Annual Conference of the North American Chapter of the Association for Computa-tional Linguistics: Human Language Technologies (NAACL). San Diego, California, pages 811–817.
https://doi.org/10.18653/v1/N16-1095.
Svetlana Kiritchenko and Saif M. Mohammad. 2016b.
The effect of negators, modals, and degree ad-verbs on sentiment composition. In Proceed-ings of the 7th Workshop on Computational Ap-proaches to Subjectivity, Sentiment and Social Me-dia Analysis. San Diego, California, pages 43–52.
http://www.aclweb.org/anthology/W16-0410. Rensis Likert. 1932. A technique for the measurement
of attitudes. Archives of psychology .
Jordan J. Louviere. 1991. Best-worst scaling: A model for the largest difference judgments. Working Paper.
Jordan J. Louviere, Terry N. Flynn, and A. A. J. Marley. 2015. Best–Worst Scaling: Theory, Methods and Applications. Cambridge University Press.
Saif M. Mohammad and Peter D. Turney. 2013. Crowdsourcing a word–emotion association lexicon.
Computational Intelligence29(3):436–465.
Bryan Orme. 2009. Maxdiff analysis: Simple count-ing, individual-level logit, and HB. Sawtooth Soft-ware, Inc.
Stanley Presser and Howard Schuman. 1996. Ques-tions and Answers in Attitude Surveys: Experiments on Question Form, Wording, and Context. SAGE Publications, Inc.
Richard Socher, Alex Perelygin, Jean Y. Wu, Jason Chuang, Christopher D. Manning, Andrew Y. Ng, and Christopher Potts. 2013. Recursive deep mod-els for semantic compositionality over a sentiment treebank. In Proceedings of the Conference on Em-pirical Methods in Natural Language Processing (EMNLP). Seattle, USA.
Philip Stone, Dexter C. Dunphy, Marshall S. Smith, Daniel M. Ogilvie, and associates. 1966. The Gen-eral Inquirer: A Computer Approach to Content Analysis. The MIT Press.
Carlo Strapparava and Rada Mihalcea. 2007.
Semeval-2007 task 14: Affective text. In Proceedings of the Fourth International
Work-shop on Semantic Evaluations
(SemEval-2007). Association for Computational
Linguis-tics, Prague, Czech Republic, pages 70–74.
http://www.aclweb.org/anthology/S/S07/S07-1013. Louis L. Thurstone. 1927. A law of comparative
judg-ment. Psychological review 34(4):273.
Amy Beth Warriner, Victor Kuperman, and Marc Brys-baert. 2013. Norms of valence, arousal, and dom-inance for 13,915 English lemmas. Behavior