HAL Id: inserm-00131060
https://www.hal.inserm.fr/inserm-00131060
Submitted on 15 Feb 2007HAL is a multi-disciplinary open access
archive for the deposit and dissemination of sci-entific research documents, whether they are pub-lished or not. The documents may come from teaching and research institutions in France or abroad, or from public or private research centers.
L’archive ouverte pluridisciplinaire HAL, est destinée au dépôt et à la diffusion de documents scientifiques de niveau recherche, publiés ou non, émanant des établissements d’enseignement et de recherche français ou étrangers, des laboratoires publics ou privés.
Wavelets extrema representation for QRS-T cancellation
and P wave detection
Lotfi Senhadji, Feng Wang, Alfredo Hernandez, Guy Carrault
To cite this version:
Lotfi Senhadji, Feng Wang, Alfredo Hernandez, Guy Carrault. Wavelets extrema representation for QRS-T cancellation and P wave detection. Computers In Cardiology, Sep 2002, Memphis, United States. pp.37-40, �10.1109/CIC.2002.1166701�. �inserm-00131060�
This material is presented to ensure timely dissemination of scholarly and technical work. Copyright and all rights therein are retained by authors or by other copyright holders. All persons copying this information are expected to adhere to the terms and constraints invoked by each author's copyright. In most cases, these works may not be reposted without the explicit permission of the copyright holder.
Wavelets Extrema Representation for QRS-T Cancellation and P Wave Detection
L. Senhadji1,2, F. Wang1,2, A. I. Hernandez1,2, G. Carrault1,2
INSERM, U642, Rennes, F-35000, France;
Université de Rennes 1, LTSI, Rennes, F-35000, France.
Address for correspondence: Lotfi SENHADJI
LTSI, Campus de Beaulieu, Université de Rennes 1, 263 Avenue du Général Leclerc - CS 74205 - 35042 Rennes Cedex, France.
E-mail: [email protected]
HAL author manuscript inserm-00131060, version 1
HAL author manuscript
Abstract : P wave detection requires a robust QRS-T cancellation method. Some interesting algorithms have been proposed for beat-to-beat QRS-T cancellation. Previous studies have shown that adaptive methods lead to a good cancellation of QRS-T interval which generally guaranty the performances of P wave detection. However, adaptive methods suffer from the non-stationary behavior of the ECG signals and particularly the beat-to-beat morphology changes of the QRS. We present a new approach for two ECG channels QRS-T cancellation based on dyadic wavelets transform. The method is insensitive to QRS morphology changes and performs well in presence of ectopic beats, transient artifacts, baseline drifts and isolated P waves. Our approach allows the P wave to be enhanced better than methods recently proposed.
1. Introduction
P wave detection is a very hard task because of the weak amplitude and the high variability of the morphology of the atrial electrical activity. The detection of the P wave from the surface ECG signal is generally conducted according to two methodological approaches: Search in a window: this approach leans on the electrophysiological knowledge which stipulates that the ventricular depolarization normally follows the auricular depolarization, that is, a P wave precedes each QRS complex. The detection strategy is to look for the P wave in a temporal window prior to the time occurrence of the QRS complex. This strategy shows interesting results in the cases of sinus the rhythm, its major drawback is the assumption that the P wave always occurs before the QRS complex, and so reducing its interest for dealing with arrhythmias where isolated P waves or ectopic beats may appear.
The cancellation of the QRS-T interval: methods based on the QRS-T cancellation were proposed to overcome the limitations of the previous techniques and mainly to facilitate the detection of the P wave even for arrhythmias with A-V dissociation. They mostly rely on: i) the detection and cancellation of the QRS-T interval, and ii) the statistical analysis of the residue with the aim of detecting all the P waves, even those not associated to a QRS complex. The cancellation procedure can be direct or adaptive. Direct procedure substitutes QRS-T interval by zeros. Thus, all superimposed P waves with the QRS-T intervals are lost. Adaptive procedures were introduced as an alternative. The approach of DuFault (1) uses adaptive Wiener filtering. Later, Thakor et al (2) proposed a variation of the classical LMS filter by learning adaptively the QRS-T average from previously detected QRS. This method leads to the cancellation of the QRS-T interval with acceptable morphology distortions on overlapped P wave (if any). However, this approach is sensitive to the morphological changes of the QRS-T and to the problems related to the QRS detection. Another adaptive method was described by Stridh et al (3). It is based on the subtraction of a QRS-T template, estimated adaptively using three ECG channels. The QRS detection is associated with a spatiotemporal alignment for reducing the residual error energy introduced by the detection jitter and beat-to beat morphology changes. Nevertheless, this method remains sensitive to the presence of ectopic beats and to non-detected QRS. More recently, Hernandez et al developed several approaches for the cancellation of the QRS-T interval (4). They lean on a two level adaptive filter with adjustable forgotten factor, according to the residual energy for the estimation of the QRS-T template, and on an Elman’s neural network architecture of the template cancellation. QRS-The comparative study, based on quantitative criteria, conducted in (5), has shown that adaptive methods lead to a good cancellation of QRS-T interval which generally guaranty the performances of P wave
detection (4). However, these methods suffer from the non-stationary behaviour of the ECG signals and particularly the beat-to-beat morphology changes of the QRS complex. We present a new approach for QRS-T cancellation based on dyadic wavelets transform (DWT).
2. Wavelet based QRS-T cancellation
Wavelets analysis is a sound method to deal with non-stationary signals. It offers a time versus duration analysis of the observed phenomenon. Hence, it allows to focus on short events and to characterize them by means of their evolution throughout the set of analysis scales. The use of wavelet approaches for studying transient signals is then rational. Among the existing wavelet approaches, (continuous, dyadic, orthogonal, biortho-gonal) we used real dyadic wavelet transform (DWT) because of its good temporal localization properties and its fast calculations. DWT of a signal f is given by :
( )
2 ,( )
( , ) j f t DWT j t f u ψ u du +∞ −∞=
∫
⋅ where j is an integer, t is the time position and ,( )
1/ 2a t u t u a a ψ = − ψ⎛ − ⎞ ⎜ ⎟ ⎝ ⎠ (
{ }
2jj∈Z is the set of dyadic scales). Under some particular conditions, discussed in (6), the DWT
defines a complete, stable and reversible representation. Fast algorithms, for analysis and synthesis are then derived. The behavior of the DWT modulus local maxima from scale to scale, allows characterizing the local regularity/singularity of the signal. Moreover, using the set of local maxima, a numerically stable approximation of the signal with about 1% (mean square error) is possible (6).
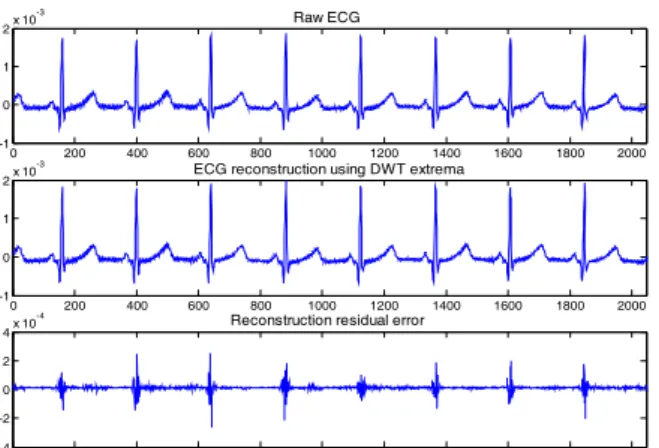
Investigations conducted in our group showed that wavelets are suitable tools for analyzing ECG (7, 8). We propose to use the DWT of surface ECG for QRS-T interval cancellation. The procedure exploits the possibility of reconstructing numerically an approximation of a signal based on the local extrema of its DWT and relies on the frames theory (6). The set of wavelets associated to the local extrema is a non orthogonal system. This frame has a pseudo-inverse and an iterative method combining the gradient conjugates algorithm and the fast DWT algorithms of decomposition and synthesis allows its estimation (6). The inversion leads to a good estimate of the original signal. Figure 1 shows an example of reconstruction of a normal ECG from its DWT local extrema. The signal is decomposed on nine levels (j from 1 to 9) and only the local extrema exceeding a threshold, defined level by level, are retained for representing the signal. The iterative procedure of reconstruction applied to these extrema leads to a good estimate of the original ECG with a relative error (norm of the zero-mean error signal reported to the norm of the zero-mean original signal) about 8,5 %. This approximation method was applied for estimating a deterministic signal in presence of additive gaussian white noise (6). Recently, fetal ECG extraction from the mixture of maternal and fetus ECG has been considered using such a method and exploiting two surface ECG leads (abdominal and precordial strongly dominated respectively by fetal ECG and maternal ECG). (9) To estimate the fetal ECG from these two mixtures, the DWT extrema of precordial channel is matched with those of the abdominal lead. The signal, reconstructed from the "matching" extrema of the two decompositions, provides an estimation of the maternal ECG observed on the abdominal lead. By subtraction of this activity, an estimation of the cardiac signal of the foetus is derived.
0 200 400 600 800 1000 1200 1400 1600 1800 2000 -1 0 1 2x 10 -3 Raw ECG 0 200 400 600 800 1000 1200 1400 1600 1800 2000 -1 0 1 2x 10
-3 ECG reconstruction using DWT extrema
0 200 400 600 800 1000 1200 1400 1600 1800 2000 -4 -2 0 2 4x 10
-4 Reconstruction residual error
Figure 1 Example of an ECG estimation based on its DWT extrema (MIT-BIH records 108). This approach is explored for isolating the atrial activity observed during a cardiac cycle. The proposed QRS-T cancellation procedure may involve one or two ECG channels.
Single channel case: the ECG signal is decomposed by means of DWT and, for each scale, only the local extrema of the transformation are kept while the other values are set equal to zero. The QRS-T cancellation is conducted in the transformed domain by keeping, level by level, only the DWT extrema present around the QRS-T position. The signal reconstructed from the residual extrema contains only information outside the QRS-T interval. Figure 2 illustrates these remarks. By comparing to direct methods of QRS-T cancellation previously mentioned, the residual signal including the P wave presents only few discontinuities induced by edge effect of the window. Furthermore, this approach allows reducing both high frequency noise and baseline drifts.
Two channels case: the two channels are chosen so that one of the two exhibits small P wave amplitudes. This one, noted ECG2, is used for canceling the QRS-T interval from the other channel noted ECG1. We postulate that, for the two derivations, the QRS-T interval, which is the electrical signature of the ventricular activity, occupies approximately the same frequency band. It is then described statistically by the same wavelets but with variable coefficients from one channel to
another one. The two signals are decomposed to produce , and the two
associated sets S1 and S2, of local extrema. S2 contains extrema mainly due to the ventricular activity whereas extrema in S1 are related to both atrial and ventricular activities. A temporal matching procedure is conducted between S1 and S2 to derive a subset S of S1 mainly describing the ventricular activity. Using S, an approximation of the ventricular activity observed in ECG1 is derived and then subtracted from ECG1 leading to a beat-to-beat QRS-T cancellation.
1( , ) ECG DWT j t DWTECG2( , )j t 0 200 400 600 800 1000 1200 1400 1600 1800 2000 -200 -150 -100 -50 0 50 Raw ECG 0 200 400 600 800 1000 1200 1400 1600 1800 2000 -40 -20 0 20 40 60 Partial reconstruction 0 200 400 600 800 1000 1200 1400 1600 1800 2000 -200 -150 -100 -50 0 50 Raw ECG 0 200 400 600 800 1000 1200 1400 1600 1800 2000 -40 -20 0 20 40 60 Partial reconstruction
Figure 2 Partial ECG reconstruction from DWT extrema after eliminating those corresponding to QRS and T waves (MIT-BIH record 108).
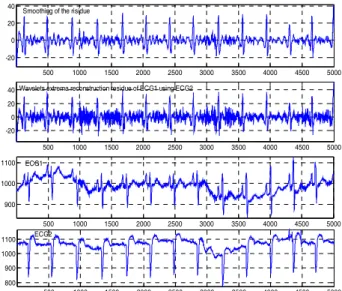
The derived P waves signal, as classical ECG, can be disturbed by baseline drifts and muscular activity. The already available, is used during the reconstruction procedure to attenuate these perturbations by omitting some analysis scales. In fact, muscular activity is mainly located in low scales and baseline drifts influence primarily high scales. Only intermediate scales are then kept (in S). An illustration of this approach is proposed
1( , )
ECG
DWT j t
Figure 3. Two remarks can be made: i) baseline drifts, even different from one channel to the other, do not influence the enhancement of the P waves, ii) the method is insensitive to QRS morphological changes (here, progressive and disturbing only one ECG channel). This approach requires neither the QRS detection nor the implicit hypothesis that a P wave precedes the QRS. Therefore, it is applicable in arrhythmia situations with A-V dissociation.
We have retained this second approach and introduced a variation in order to strengthen its P waves enhancement capabilities. A block diagram summarizing the method is reported in Figure 4. The outputs E1f and E1 correspond to the signals show in panels 1 and 2 of Figure 3. The new output E2 is derived by subtracting the QRS-T activity estimate of ECG1 from the approximation of ECG1 obtained by means of DWTECG1( , )j t extrema reconstruction (and not from the raw ECG1).
3. Qualitative results
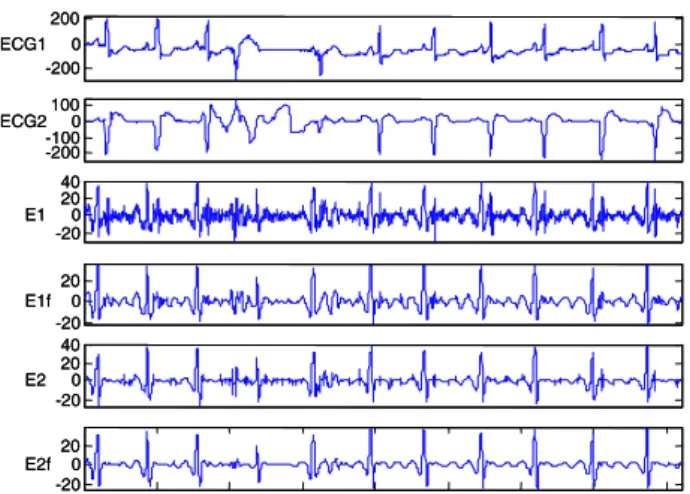
Qualitative comparisons between E1, E1f, E2 and E2f where conducted on real ECG signals exhibiting both normal and abnormal rhythms. The reported examples show that the E2f output provides a good approximation of the P waves sequence. ECG signals shown in Figure 5, display a PVC beat which overlaps the P wave of the sinus rhythm and a transient artifact disturbing the baseline during the compensate pose. Our method is neither sensitive to the abrupt QRS-T morphological changes affecting simultaneously the two channels, nor to the presence of the transient artifact on the second channel. Moreover, it allows enhancing the P wave, partially hidden by the PVC beat. The example depicted in Figure 6 shows that in the presence of a PVC having similar morphology of that of a normal QRS in one channel, all the P waves, even the isolated one, are enhanced.
500 1000 1500 2000 2500 3000 3500 4000 4500 5000 -20
0 20
40 Wavelets extrema reconstruction residue of ECG1 using ECG2
500 1000 1500 2000 2500 3000 3500 4000 4500 5000 900 1000 1100 ECG1 500 1000 1500 2000 2500 3000 3500 4000 4500 5000 800 900 1000 1100 ECG2 500 1000 1500 2000 2500 3000 3500 4000 4500 5000 -20 0 20 40
Smoothing of the risidue
Figure 3 partial reconstruction of ECG1 using the subset S of extrema. The QRS-T interval is canceled and the P waves are enhanced. Wavelet filtering allows attenuating EMG activity and
baseline drifts (MIT-BIH record 108).
E1f Ext rema
association Partial Rec.
+ -∑ E2 E2f E1 Ext rema DWT ECG2 Ext rema DWT ECG1 Partial Rec. ∑ -+ E1f Ext rema
association Partial Rec.
+ -∑ ∑ E2 E2f E1 Ext rema DWT ECG2 Ext rema DWT ECG1 Partial Rec. ∑ ∑ -+
Figure 4 Block diagram of QRS-T interval cancellation. 4. Quantitative results
For the objective evaluation of the above QRS-T cancellation method, we have adopted the evaluation scheme described in (5). We defined the signal to noise ratio (SNR) as being the logarithm of the ratio between the power of the PQ interval and the power of the QRS-T interval. This quantity is estimated before and after QRS-T cancellation. Boxplots are used to visualize the behavior of the evaluation criteria. First we explored the influence of the number of decomposition levels of the DWT on the signals E1, E1f, E2 and E2f. Using the MIT-BIH records 100, 107 and 108, SNR boxplots (not shown here) indicate that a number of 6 levels is appropriate for
the P waves enhancement and that E2f performs better than the other outputs. Using 6 levels and E2f, we compare based on records MIT-BIH 100 and 108, our method with the most powerful approaches reported in (5) : Hernandez, Thakor, Dufault and Stridh, noted respectively St1(2), Stb4, Stb5 and Stb6. Boxplots highlight the significant improvement of the SNR after QRS-T cancellation and show that our method (WT) leads to the highest mean SNR and to a low standard deviation. For example, in record 108, an SNR improvement of more than 20dB with regard to the raw data is achieved (Figure 7). -200 0 200 ECG1 -200 -1000 100 ECG2 -200 20 40 E1 -20 0 20 E1f -200 20 40 E2 500 1000 1500 2000 2500 3000 3500 4000 -20 0 20 E2f -200 0 200 ECG1 -200 -1000 100 ECG2 -200 20 40 E1 -20 0 20 E1f -200 20 40 E2 500 1000 1500 2000 2500 3000 3500 4000 -20 0 20 E2f
Figure 5 Behavior of the QRS-T cancellation procedure in presence of QRS-T morphology changes over channels, occurrence of isolated artifact and overlapping of P and T waves (MIT-BIH record
108).
-1000 100 EEG1 -200 -100 0 EEG2 -200 20 40 E1 -20 0 20 E1f -200 20 E2 500 1000 1500 2000 2500 3000 3500 4000 -200 20 E2f -1000 100 EEG1 -200 -100 0 EEG2 -200 20 40 E1 -20 0 20 E1f -200 20 E2 500 1000 1500 2000 2500 3000 3500 4000 -200 20 E2f
Figure 6 Behavior of the QRS-T cancellation procedure in presence of QRS-T morphology change mainly on one lead and a non-conducted P wave (MIT-BIH record 108).
5. Conclusion
The proposed DWT based QRS-T cancellation methods uses two channels and appears very attractive. It is insensitive to QRS morphology changes, ectopic beats, transient artifacts, baseline drifts, isolated P waves and performs well compared to methods recently introduced in the literature. Work in progress focuses on a large scale SNR comparisons and the definition of a new robust P wave detection statistics.
ECG1 WT st1(2) Stb4 Stb5 Sornm -40 -30 -20 -10 0 10 20 30 40 50 60 SNR (db)
Figure 7 SNR before and after QRS-T cancellation for the compared methods.
References
[1] DuFault R, Wilcox A. Automatic P-wave detection in surface ECGs. In: Proc. IEEE/EMBS; 1986; Chicago, USA: Engineering in Medicine and Biology Society; 1986. p. 325-328.
[2] Thakor NV, Zhu YS. Applications of adaptive filtering to ECG analysis: noise cancellation and arrhythmia detection. IEEE Transactions On Biomedical Engineering 1991;38(8):785-94.
[3] Stridh M, Sornmo L. Spatiotemporal QRST cancellation techniques for analysis of atrial fibrillation. IEEE Trans Biomed Eng 2001;48(1):105-11.
[4] Hernández AI, Carrault G, Mora F. Improvement of a P-wave detector by a bivariate classification stage. Transactions of the institute of measurement and control 2000;22(3):231-242. [5] Hernandez AI, Carrault G, Mora F, Passariello G, Hernandez MI, Schleich J. Quantitative comparison of atrial activity detection approaches. In: Computers in Cardiology; 1997 1997; Lund, Sweden: Practical; 1997. p. 481-484.
[6] Mallat SG. A wavelet tour of signal processing. 2nd ed. San Diego: Academic Press; 1999.
[7] Senhadji L, Carrault G, Bellanger JJ, Passariello G. Comparing wavelet transforms for recognizing cardiac patterns. IEEE Engineering in Medicine and Biology Magazine 1995;14(2):167-173.
[8] Senhadji L, Thoraval L, Carrault G. Continuous wavelet transform: ECG recognition based on phase and modulus representations and hidden Markov models. In: Aldroubi A, editor. Wavelets in medicine and biology. NY: CRC Press.; 1996. p. 439-463.
[9] Khamene A, Negahdaripour S. A new method for the extraction of fetal ECG from the composite abdominal signal. Biomedical Engineering, IEEE Transactions on 2000;47(4): 507-- 516.