ANALYSIS OF THERMALLY INDUCED DAMAGE IN COMPOSITE SPACE STRUCTURES
by
Cecelia Hyun Seon Park
S.B., Massachusetts Institute of Technology (1992)
Submitted to the Department of Aeronautics and Astronautics in Partial Fulfillment of
the Requirements for the Degree of Master of Science
in Aeronautics and Astronautics at the
Massachusetts Institute of Technology January 1994
@ Massachusetts Institute of Technology 1994
Signature of Author
Department of Aeronautics and Astronautics January, 1994
Certified by
Professor Hugh L. McManus Thesis Supervisor
Accepted by
Ms$SACHUserr INSTrUTE
FEB 17 1994
U
Professor Harold Y. Wachman Chairman, Departmental Graduate CommitteeANALYSIS OF THERMALLY INDUCED DAMAGE IN COMPOSITE SPACE STRUCTURES
by
Cecelia IL Park
Submitted to the Department of Aeronautics and Astronautics on January, 1994 in partial fulfillment of the requirements for the Degree of
Master of Science. Absract
Unprotected structure in space is subjected to severe temperature extremes. Microcracks in the plies of composite structures have been observed to form under these conditions. Verified, general design tools are necessary to predict, avoid, and/or live with transverse cracking in composite space structures. A shear lag solution of the stresses in the vicinity of the crack, combined with a simple energy criteria, was used to predict matrix cracking. Thermal cycling fatigue was accounted for by assuming that cyclic loading decreases the material's resistance to cracking. These methods were combined to predict crack densities and degraded laminate properties as functions of temperature and thermal cycles. A general analysis, valid for all plies of any laminate configuration, including interactions between cracks in various plies, was developed. The method includes effects such as material softening and temperature dependent material properties. The analysis was incorporated in a computer program. Experiments were performed to measure crack densities to verify the analytical predictions. A variety of laminates were cooled to progressively lower temperatures. The measured crack densities were correlated to the analytical predictions and were found to be dependent on ply thickness. The predicted behavior of thick plies correlated with experimental observations reasonably well, but experimental observation of thin plies showed a variety of unpredicted behaviors. The validity of the assumptions used in current matrix cracking analyses were examined experimentally by X-radiography, edge inspections, and inspections of the configuration of cracks throughout the volume of samples carried out by sanding. Complex behavior of the matrix cracking as functions of ply thickness, ply angle, and closeness to free edges, not previously reported, was observed. These results were interpreted to help explain deviations from the analytical predictions in thin plies. Analytically, a 3D free edge stress analysis was used to understand observed cracking behavior near the edges. The results raise serious questions about current practices in both experimental determination of cracking damage through observation of sample edges and analytical prediction of these cracks.
Thesis Supervisor: Hugh L. McManus
Title: Assistant Professor, Department of Aeronautics and Astronautics, Massachusetts Institute of Technology.
ACKNOWLEDGEMENTS
i'd like to thank prof. mcmanus for all the knowledge he has shared and everything he has taught me (or tried). it was definitely an educational and rewarding experience to work with someone so enthusiastic and intelligent. i really appreciate all the support i received. i would also like to thank everyone at nasa langely for their support. special thanks to dr. tompkins, dr. bowles, james shen and joan funk.
i would not be writing this acknowledgement had it not been for dr. bhat and soon-to-be dr. tsang. they are the most caring and generous people i know who make telac what it is. you guys set a great example for everyone-telac will definitely miss your presence. thanks to rich for the late (very late) night talks, wardle for being a dork and jason and scott for all their help. i really appreciate all the support i've received from everyone at telac. thanks to deb, ping, and liz for letting me bother them!
there are many people i need to thank for putting up with me during my years at mit. special thanks to little park, kat, and rob! i would not have survived mit without them. thanks to lester for all his support during my thesising. i would like to list all the great friends who have helped me out and put up with me, but my thesis is due... i am truly grateful to everyone for making my past 5 years here actually enjoyable.
finally, i would like to thank my family for all their support. obviously i would not have been able to do any of this without them. thanks mom and dad for everything. peter and john for being...my brothers? :) i cannot thank you guys enough!
FOREWORD
This research was completed at the Technology Laboratory for Advanced Composites at the Massachusetts Institute of Technology. The work was partially funded by a NASA Spacegrant Fellowship and NASA Langely Research Center grant NAG-1-1463.
TABLE OF CONTENTS
A B STR A CT ... 3 ACKNOWLEDGEMENT ... 5 FOREWORD ... 7 LIST OF FIGURES ... 11 LIST OF TABLES ... 16 NOMENCLATURE ... 17 1. INTRODUCTION ... ... 21 2. PREVIOUS WORK ... 262.1 OVERVIEW OF ANALYTICAL APPROACHES ... 26
2.2 MECHANICAL APPLICATIONS... ... 27
2.3 THERMAL APPLICATIONS ... ... 29
2.4 ANALYSIS OF THERMALLY LOADED CROSSPLY LAMINATE.. 30
3. PROBLEM STATEMENT ... ... 32
4. ANALYTICAL METHODS ... ... 33
4.1 APPROACH ... 33
4.2 DERIVATION OF BASIC ENERGY EQUATIONS ... 38
4.2.1 Stress Distribution and Displacement Field ... 38
4.2.2 Strain Energy Release Rate ... 43
4.2.3 Degradation of Laminate Properties ... 46
4.3 IMPLEMENTATION FOR THERMAL PROGRESSIVE AND CYCLIC LOADS ... 47
4.3.1 Crack Density as Function of Temperature ... 48
4.3.2 Crack Density as Function of Thermal Cycles ... 48
4.3.3 Solution Algorithm Including Secondary Effects ... 50
4.3.4 Derivation of Stiffness Constant ... 52
4.4 FREE EDGE STRESS ANALYSIS ... 55
4.5 COMPUTER PROGRAMS ... 55
5. EXPERIMENTAL METHODS ... 58
5.1 PREPARATION OF SPECIMENS ... .. 58
5.2 MICROCRACK EXAMINATION ... 60
5.3 THERMAL PROGRESSIVE TESTING ... 62
5.4.1 X-Radiography ... 66
5.4.2 Examination of Microcrack Distribution Throughout Volume of Laminate ... ... 66
5.4.3 Control Tests ... ... ... 69
6. RESU LTS ... ... 71
6.1 THERMAL PROGRESSIVE COOLING ... 71
6.1.1 Crack Density vs. Decreasing Temperature ... 71
6.1.2 Laminate Properties vs. Decreasing Temperature ... 82
6.1.3 Parametric Studies ... ... 89
6.2 CRACK CONFIGURATION STUDY ... 91
6.2.1 X-Radiography ... ... 91
6.2.2 Edge Comparison... ... 91
6.2.3 Sanding Edges... ... 94
6.3 FREE EDGE STRESS ANALYSIS... 100
7. D ISCU SSIO N ... 105
7.1 PLY THICKNESS EFFECTS ... 105
7.2 PLY ORIENTATION EFFECTS ... 107
7.3 EDGE EFFECTS ... 108
8. CON CLUSION S... ... 110
8.1 SUMMARY ... 110
8.2 RECOMMENDATIONS ... 110
REFEREN CES ... 112
APPENDIX A: COMPUTER CODE MANUAL AND DOCUMENTATION. 119 APPENDIX B: PROGRESSIVE THERMAL LOADING ANALYTICAL AND EXPERIMENTAL RESULTS ... ... 129
LIST OF FIGURES
Figure 1.1 Figure 1.2 Figure 4.1 Figure 4.2 Figure 4.3 Figure 4.4 Figure 4.5 Figure 4.6 Figure 4.7 Figure 4.8 Figure 4.9 Figure Figure Figure 5.1 5.2 5.3 Figure 6.1Examples of microcracks on edges of laminates.
Photomicrographs of crossply [02/902]s specimen under 50x magnification and quasi-isotropic laminate [0/45/90/-45]s under 200x magnification (00 ply is not visible)... 22 Thermally loaded unconstrained plies and constrained
laminate. CTE mismatch causes microcracks to appear... 24 Crack formation in an arbitrary ply. Cracks grow to span the ply thickness instantaneously. ... 34 Crack formation in laminate. We assume cracks form
suddenly through the width of the laminate as shown in the process (a) to (b). ... ... 35 Graph of the change in strain energy as a function of crack length... . 37 Laminate showing two cracks, 2h apart, in a cracking ply group embedded in the rest of a smeared laminate ... 39 Free body diagram of small section of laminate. ... 41 (a) A laminate with two cracks, A and B, spaced 2h apart. (b) Same laminate with the appearance of an additional
crack C... 45 Laminate with crack spacing of h subjected to thermal
loads ... ... ... . 49 Flow chart of algorithm used in analysis. ... 51 Top view of laminate with equally spaced cracks in 450 and 90' plies. Illustrates difference in crack density from
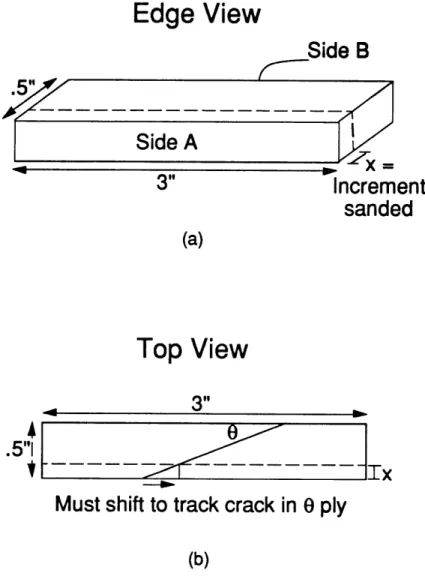
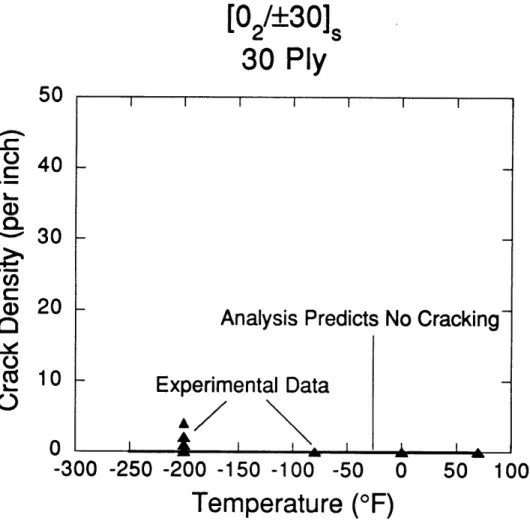
geom etric effect ... ... 57 Different damage types on free edges of laminates. ... 61 Thermal profile of progressive testing procedure. ... 64 (a) Edge view of laminate sanded off with x increment (b) Top view of laminate with example q ply crack. Illustration of difference in edge inspection after sanding ... 67 Analytical and experimental correlation of crack density vs. decreasing temperature. 30 ply of [02/±30]s laminate... 73
Figure 6.2 Figure 6.3 Figure 6.4 Figure 6.5 Figure 6.6 Figure 6.7 Figure 6.8 Figure 6.9 Figure 6.10 Figure 6.11 Figure 6.12 Figure 6.13 Figure 6.14 Figure 6.15
Analytical and experimental correlation of crack density vs. decreasing temperature. -30 ply of [02/±30]s laminate. ... 74 Analytical and experimental correlation of crack density vs. decreasing temperature. 45 ply of [0/45/90/-45]s laminate.. 76 Analytical and experimental correlation of crack density vs. decreasing temperature. 45 ply of [0/45/90/-45]s laminate.. 77 Analytical and experimental correlation of crack density vs. decreasing temperature. -452 ply of [0/45/90/-45]s
lam inate. ... ... 78 Analytical and experimental correlation of crack density vs.
decreasing temperature. 452 ply of [02/452/902/-452]s
lam inate ... ... 79 Analytical and experimental correlation of crack density vs.
decreasing temperature. 902 ply of [02/452/902/-452]s
laminate. ... 80 Analytical and experimental correlation of crack density vs. decreasing temperature. -454 ply of [02/452/902/-452]s
lam inate ... 81 Analytical stiffness prediction vs. temperature for [0/45/90/-45]s laminate. Laminate longitudinal stiffness normalized by undamaged value. ... ... 83 Analytical stiffness prediction vs. temperature for
[02/452/902/-452]s laminate. Laminate longitudinal
stiffness normalized by undamaged value. ... 84 Analytical stiffness prediction vs. temperature for
[0/90/0/90]s laminate. Laminate longitudinal stiffness
normalized by undamaged value. ... 85 Analytical CTE prediction vs. temperature for [0/45/90/-45]s lam inate. ... . .. 86 Analytical CTE prediction vs. temperature for [02/452/902/-452]s lam inate. ... ... ... 87 Analytical CTE prediction vs. temperature for [0/90/0/90]s laminate. ... 88 Parametric studies using temperature dependent material properties and material softening effects ... 90
Figure 6.16 Figure 6.17 Figure 6.18 Figure 6.19 Figure 6.20 Figure 6.21 Figure 6.22 Figure 6.23 Figure B.1 Figure B.2 Figure B.3 Figure B.4 Figure B.5 Figure B.6 Figure B.7 Figure B.8 Figure B.9
X-ray photographs of microcracks in [0/45/90/-45]s and
[02/902]s specimens. ... ... 92 Sanding results for [02/±30]s specimen showing crack
configuration through width. ... . 95 Sanding results for [0/45/90/-45]s specimen showing crack configuration through width in 90 plies. ... 97 Sanding results for [0/+45/90/-45]s specimen showing crack configuration through width in +45 and -452 plies. ... 98 Sanding results for [0/+45/90/-45]s specimen showing crack configuration through width. ... 99 Sanding results for [02/+452/902/-452]s specimen showing crack configuration through width. ... 101 Sanding results for [0/+45/90/-45]s specimen showing crack configuration through width. ... 102 Transverse in-plane stress distribution near the free edge of a [0/45/90/-45]s laminate. ... 103 Analytical and experimental correlation of crack density vs. decreasing temperature. 45 ply of [0/45/90/-45]s laminate.. 130 Analytical and experimental correlation of crack density vs. decreasing temperature. 90 ply of [0/45/90/-45]s laminate.. 131 Analytical and experimental correlation of crack density vs. decreasing temperature. -452 ply of [0/45/90/-45]s
laminate. ... 132 Analytical CTE prediction vs. temperature for [0/45/90/-45]s laminate. ... 133 Analytical stiffness prediction vs. temperature for [0/45/90/-45]s laminate. Laminate longitudinal stiffness normalized by undamaged value. ... 134 Analytical and experimental correlation of crack density vs. decreasing temperature. 45 ply of [0/±45/90]s laminate... 135 Analytical and experimental correlation of crack density vs. decreasing temperature. -45 ply of [0/±45/90]s laminate... 136 Analytical and experimental correlation of crack density vs. decreasing temperature. 902 ply of [0/±45/90]s laminate. ... 137 Analytical CTE prediction vs. temperature for [0/±45/90]s
Figure B.10 Figure B.11 Figure B.12 Figure B.13 Figure B.14 Figure B.15 Figure B.16 Figure B.17 Figure B.18 Figure B.19 Figure B.20 Figure B.21 Figure B.22 Figure B.23
Analytical stiffness prediction vs. temperature for [0/±45/90]s laminate. Laminate longitudinal stiffness
normalized by undamaged value. ... 139 Analytical and experimental correlation of crack density vs. decreasing temperature. 90 ply of [0/90/±45]s laminate... 140 Analytical and experimental correlation of crack density vs. decreasing temperature. 45 ply of [0/90/±45]s laminate... 141 Analytical and experimental correlation of crack density vs. decreasing temperature. -452 ply of [0/90/±45]s laminate. .. 142 Analytical CTE prediction vs. temperature for [0/90/±45]s
lam inate. ... 143 Analytical stiffness prediction vs. temperature for
[0/90/±45]s laminate. Laminate longitudinal stiffness
normalized by undamaged value. ... 144 Analytical and experimental correlation of crack density vs.
decreasing temperature. 452 ply of [02/452/902/-452]s
lam inate. ... 145 Analytical and experimental correlation of crack density vs. decreasing temperature. 902 ply of [02/452/902/-452]s
laminate. ... 146 Analytical and experimental correlation of crack density vs. decreasing temperature. -454 ply of [02/452/902/-452]s
laminate. ... 147 Analytical CTE prediction vs. temperature for [02/452/902/-452]s lam inate ... 148 Analytical stiffness prediction vs. temperature for
[02/452/902/-452]s laminate. Laminate longitudinal
stiffness normalized by undamaged value. ... 149 Analytical and experimental correlation of crack density vs. decreasing temperature. 90 ply of [0/90/0/90]s laminate... 150 Analytical and experimental correlation of crack density vs.
decreasing temperature. 902 ply of [0/90/0/90]s laminate.... 151 Analytical CTE prediction vs. temperature for [0/90/0/90]s
Figure B.24 Figure B.25 Figure B.26 Figure B.27 Figure B.28 Figure C.1 Figure C.2 Figure C.3 Figure C.4 Figure C.5 Figure C.6
Analytical stiffness prediction vs. temperature for [0/90/0/90]s laminate. Laminate longitudinal stiffness
normalized by undamaged value. ... 153 Analytical and experimental correlation of crack density vs. decreasing temperature. 30 ply of [02/±30]s laminate... 154 Analytical and experimental correlation of crack density vs. decreasing temperature. -302 ply of [02/±30]s laminate. ... 155 Analytical CTE prediction vs. temperature for [02/±30]s
laminate. ... 156 Analytical stiffness prediction vs. temperature for [02/±30]s laminate. Laminate longitudinal stiffness normalized by
undamaged value ... 157 Transverse in-plane stress distribution near free edge of
[0/45/90/-45]s laminate ... 159 Transverse in-plane stress distribution near free edge of
[0/±45/90]s laminate. ... 160 Transverse in-plane stress distribution near free edge of
[0/90/±45]s laminate. ... 161 Transverse in-plane stress distribution near free edge of
[02/452/902/-452]s laminate ... 162 Transverse in-plane stress distribution near free edge of
[0/90/0/90]s laminate. ... 163 Transverse in-plane stress distribution near free edge of
LIST OF TABLES
Specimen information. ... ... 59
Test m atrix ... 65
Material Properties ... ... 72
Results of edge comparison of side A and side B ... 93 Table 5.1
Table 5.2 Table 6.1 Table 6.2
NOMENCLATURE
ao Total thickness of laminate al Thickness of rest of laminate
a2 Thickness of laminate outside cracking ply group
[A] Laminate stiffness matrix
Al Component of laminate stiffness matrix
E, Equivalent axial stiffness of laminate outside cracking ply group E2 Equivalent axial stiffness of cracking ply group
Eo Equivalent axial stiffness of entire laminate
Eef Effective laminate stiffness Eli Longitudinal modulus
Eu Transverse modulus
G Strain energy release rate
G Critical strain energy release rate
Gi Shear modulus
h Crack spacing
k Proportionality constant in shear lag analysis
1 Crack length
lc Critical crack length
n Number of plies in laminate
N Thermal cycles
q Shear stress
[QJ Ply stiffness matrix of ith ply
Ql1i) Component of ply stiffness matrix of ith ply
Q22) Component of ply stiffness matrix of ith ply ) Component of ply stiffness matrix of ith ply
tc Thickness of cracking ply group
ti Thickness of ith ply
T Temperature
T,f Stress free temperature
I[TJ Transformation matrix of ith ply
U1 Displacement in rest of laminate in axial direction
u2 Displacement in cracking ply group in axial direction
U Strain energy of body
W Work done by an external load x Coordinate system axis
y Coordinate system axis
a, Average coefficient of thermal expansion in the laminate outside the cracking ply group
a2 Coefficient of thermal expansion in cracking ply group
Waff Effective laminate longitudinal coefficient of thermal expansion
au Longitudinal coefficient of thermal expansion
ati Transverse coefficient of thermal expansion [a]e Effective coefficient of thermal expansion vector
AT Change in temperature relative to stress free temperature
AU Change in internal energy
AW Change in external work
e, Longitudinal strain in the laminate outside the cracking ply group
06 Rotation factor for cracking ply c
i Knockdown factor of ith ply
i Major Poisson's ratio
O, Ply angle of cracking ply group Oi Ply angle of ith ply
0' Ply angle of ith ply after rotation
p Crack density
a, Average longitudinal stress of the laminate outside the cracking ply group
a2 Longitudinal stress of the cracking ply group
aa Average stress due to externally applied mechanical load
e, Equivalent applied thermal stress aft First ply failure stress
CHAPTER
1
INTRODUCTION
Advanced composite materials are widely used in space applications because of their attractive structural properties. Their high specific strength, light weight, low coefficient of thermal expansion, and high stiffness are especially advantageous in dimensionally critical structures such as solar reflectors, space science instruments, communication satellites, antennae, and their support structures because deformations can be held to a minimum.
A concern in utilizing composite materials in these applications is damage caused by the space environment. Thermal cycling, which induces thermal stresses in space structures, is one of these concerns. During orbit, spacecraft travel in and out of the earth's shadow, going through cycles of high and low temperatures. The exact thermal history depends on orbital parameters, surface coating, and structural size, but in general, exposed space structures are subjected to approximate temperature extremes of ±1500F in low earth orbit
(LEO) and ±2500
F in geosynchronous earth orbit (GEO). In a typical vehicle with a service time of 10 years, approximately 5000 thermal cycles could occur in GEO or 10,000 cycles in LEO. More specifically, the Space Station Freedom, with a 30 year projected lifetime, could experience 175,000 thermal cycles (one every 90 minutes in LEO), with temperatures ranging from +1500F to -1500F.
The first observed damage from the thermal environment is matrix dominated cracks induced by thermal stresses in individual plies of composite laminates. We refer to this type of damage as a microcrack or matrix crack. Examples are illustrated in Figure 1.1. Photomicrographs show microcracks visible at the edges of crossply [02/902]s and quasi-isotropic [0/45/90/-45]s
Figure 1.1 900 900 -450 900 450
Examples of microcracks on edges of laminates. Photomicrographs of crossply [02/902]s specimen under 50x magnification and quasi-isotropic laminate [0/45/90/-45]s under 200x magnification (00 ply is
laminates. Microcracking is a phenomenon which can effect the thermal and mechanical properties of composite materials. This can significantly effect structural integrity and degrade performance in space applications. In later stages, extensive microcracking could cause premature failure. More importantly, this type of damage can cause degradation of laminate properties, which is an important issue where dimensional stability is critical. When composite structures are designed with specific material properties (i.e. low CTE, high stiffness) in mind, results may be disastrous if these properties deviate from design values.
Microcracking damage is basically caused by coefficient of thermal expansion (CTE) property mismatch. Figure 1.2 illustrates the basis of the thermal microcracking problem. The plies of a composite laminate have different CTE values because of their various orientations. If the plies were independent and unconstrained, they would be able to freely expand or contract
according to their individual CTE's when subjected to thermal loading. In actuality they are laminated together and therefore constrain each other, creating high stresses and microcracks.
Engineers and researchers have realized that microcracking is an important issue in structural reliability and durability. There has been much testing on the cracking of laminates and the resulting property degradation. From experimentation, effects important to the damage state, such as different material types, laminate geometries, and ply thicknesses, have been identified. Rather than conducting time consuming tests for every possible proposed material and laminate, a greater understanding of this damage mechanism is required. We need analytical capabilities to predict crack density and the cracks' effects on laminate properties. This will give us not only the ability to quantify the damage but also a tool to critically analyze the problem.
Unconstrained Plies
00900
.D .O ..D . ... . . ... j l)i 0 0000000000000001310~0~001004 110000111111000110no MOOG 00000 no0000 0 oono
000000 ... ... . i;::~DanConstrained Laminate
.,.
i
:i.
.. f-i . .. . .. ... .i. on : '.oon::.
:0000000p.
looo
:~
%m .. .. .:: .: R: RHOM. o .; ;::-;:.';. -.. •0... PaD"o,,t.. .. ... ....... .a .... ... .. . .. . . ... :...:::.: ' mum nan m m m . -a --- n-... . Ii aaIaa um._ 000000 ooaaaa00 0 • :. ::: i:.::i !!::.: ...: ::::i::::: . ::: i :: :!: ::!: : i .::.:: .'::. .- " : :. ...:: .'::':: : ,".: : " : : : ':': : ::i: J :: .': : .i ::: "i: :. .• ' '. i -'.i . '¢ . :: . :
::ao:a onuus
00
900
00
1000
10Cracks
Figure 1.2
Thermally loaded unconstrained plies and constrained laminate.
' :':''''';' :r " i:.:':'
i
i :iii~i:~IL~:: "f" "''
.i ~~ ;; :::-: ~ ~.:~ : : ":' ~ : : : :.: : .: t:.Si; ;;; rrrr- * st, r " --'i
To attain this capability, we first studied the previous work relevant to our problem. This will be reviewed in Chapter 2. Chapter 3 contains the problem statement summarizing the completed research. The analytical methods used will be discussed in Chapter 4. We will present the general model which was formulated and implemented into a computer program to predict damage. A three dimensional stress analysis was also completed to understand effects of free edges on our analysis. Chapter 5 describes the types of experiments conducted. We tested various composite specimens to verify the analytical predictions. Additionally, experiments were performed to confirm the assumptions used in the development of the analysis. Finally, all the analytical and experimental results and correlations will be discussed in Chapter 6. Conclusions and recommendations for further research will be presented in Chapter 7.
CHAPTER 2
PREVIOUS WORK
Few previous studies address thermal cycling damage in composite space structures. No completed work allows for quantitative prediction of crack density and laminate property degradation due to the thermal environment. However, research has been performed in the general area of microcracking damage from mechanical loading. Many studies in the progressive (monotonically increasing) loading and fatigue loading of composite laminates have been reported. However, only a small subset is applicable to our problem. Only relevant studies, those which contribute to our predictive work in thermal applications, will be addressed here. Most of this work has been concentrated on the specific topic of progressive loading of crossply laminates. In thermal applications, some analytical work has been conducted, but quantitative, predictive capabilities are minimal. Much of the research in thermal applications has been devoted to gathering experimental data and results.
In this chapter, analytical approaches will be briefly reviewed for background. Then studies relating to mechanical applications that are relevant to our thermal problem will be discussed. The discussions are divided into progressive loading and fatigue loading applications. Lastly, the research on thermal cycling is reviewed with an emphasis on the limited predictive work.
2.1 OVERVIEW OF ANALYTICAL APPROACHES
Many different types of analytical approaches exist. The various methods use either a fracture mechanics or strength of materials failure criterion to predict damage. Both require knowledge of the stress state, which can be
obtained by a variety of methods. These methods are either analytical (e.g. shear lag analysis, classical laminated plate theory, variational method) or numerical (finite element method).
Once the stress field is derived, the fracture mechanics techniques use the stress state to determine energy change during crack formation. The calculated energy is typically compared with the critical strain energy release rate, which is a material property. If the released energy is greater than the critical strain energy release rate, the energy criteria for crack appearance is satisfied. In contrast to usual fracture mechanics techniques, the growth of cracks is not predicted. Instead, it is presumed that if cracks are energetically feasible they will form. This is equivalent to assuming that critical flaws exist throughout the material. The strength based approaches use the derived stress state to compare with the material failure property. In the simplest example, cracks form when the maximum predicted ply stress exceeds the ply failure strength, a material property.
Within the two basic approaches, studies diverge into different areas. For instance, research is conducted at different scales. Studies are sometimes performed to study mechanics at the ply and laminate level. On the other hand, microstructural studies analyze the response of the fiber and matrix and their interactions. Statistical methods can also be incorporated to all of these approaches. In fracture mechanics methods a probabilistic starting crack location is used whereas in strength approaches a probabilistic strength distribution is assumed.
2.2 MECHANICAL APPLICATIONS
Many analytical models have been proposed to address cracking and its effects on laminate properties under mechanical progressive loading. Classical
Laminated Plate Theory (CLPT) combined with the strength of materials method has been applied to attempt crack initiation prediction. An in situ transverse strength property is used in the failure criterion [1, 2]. This method does not seem to be adequate in general cases. Flaggs and Kural [11 found that the in situ strength is not a ply property but is dependent on ply thickness and laminate geometry.
Lee and Daniel [3] also used the strength criterion to predict cracking but developed the stress field using a shear lag analysis. Some statistical work has been reported by Peters [4-6]. He used a shear lag solution for stresses and a strength based failure criterion with a probabilistic strength distribution.
Much work has been done using the fracture mechanics approach. A shear lag analysis to approximate stresses near a crack and an energy criterion to predict the appearance of a crack is used in this technique [7-15]. Laws and Dvorak [81 also incorporated a probabilistic model for crack distributions.
There has been similar work using the fracture mechanics and energy method but using an analysis other than shear lag to predict stresses. A variational approach has been used by Nairn [16] and Varna and Berglund [17]. They use principles of minimum complementary potential energy to derive approximate stress and strain fields. Tan and Nusimer [181 used 2D elasticity to derive their analysis. Lim and Hong used a finite element analysis to correlate crack density to reduced laminate properties [10].
Additionally, research has been done using continuum damage mechanics (CDM) models [19, 201 These are thermodynamics based models which represents damage (cracking) as a set of internal state variables. This approach is fracture mechanics driven. The damage is considered as a energy dissipative mechanism so that cracking can be predicted.
A great amount of literature on various aspects of the fatigue of composites exists [21-27]. These reports, concerned with the characterization and prediction of fatigue damage, have extensive descriptions and measurements of this phenomena. However, the problem we are concerned with, the problem of matrix cracks, is not the central issue of most of these studies. More often it is used as an indication or metric of damage. A limited number of reports refer to the analysis of crack density and property degradation caused by mechanical fatigue loading. Most of these studies transferred progressive loading analysis techniques to fatigue [19, 28-301. For example, CDM work was incorporated into fatigue applications by Paas et al. [19]. Petitpas et al. [30] developed a shear lag based stress model and used a maximum strength criteria for crack prediction. They then empirically formulated a relation between effective failure strength and number of cycles to predict crack density during fatigue loading.
Most of the quantitative analyses for mechanical loading are restricted to monotonically increasing loading of crossply laminates. There have been some who derived their analysis incorporating general angle laminates [7, 11, 31] but in general, these reports have not fully proven these capabilities.
2.3 THERMAL APPLICATIONS
Many of the analytical studies presented for mechanical loading applications incorporated a residual thermal stress. However, this thermal input was incorporated only as a fixed factor in the analyses.
A limited amount of analytical work has been done to directly address the cracking of thermally loaded composites. Classical Laminated Plate Theory (CLPT) was initially attempted to study microcracking [32-34]. Adams [33] used CLPT and in situ transverse strength to predict the onset of microcracking.
Additionally, the ply discount method was used by Bowles [34] to predict reduction of properties with little success. These analyses have emphasized the damage mechanics at the ply level.
Micromechanics methods approach the problem at a different scale to study fiber and matrix interactions [32, 34-38]. This approach allows studies of various microstructural parameters and their effects on microdamage development. Bowles derived thermally induced stresses using finite element analysis. Then he predicted fiber matrix debonding initiation and location by comparing the maximum radial stress at the interface to the interfacial bond strength.
Most of the research dedicated to the thermal loading problem has been in experimental testing and observation of thermal cycling damage and its effects on laminate properties [39-47]. Knouff [41] tested to see if fiber type and properties had an effect on microcracking under thermal cycling. He fit a hyperbolic function to experimental data of crack density versus thermal cycles and found the rate of crack density increase to be dependent on fiber type. Numerous other experiments were conducted by Tompkins et al. [44-47] to measure properties such as CTE, stiffness, strain and crack density after thermal cycling. Manders and Maas [42] tried testing thin plies (i.e. 0.001 inches compared to the usual 0.005 inches) to see if cracking and property degradation was minimized. Bowles and Shen [391 tested fabric for the same purposes.
2.4 ANALYSIS OF THERMALLY LOADED CROSSPLY LAMINATES McManus et al. [48] conducted an analytical predictive study of thermally loaded crossplies. They used the fracture mechanics approach with a shear lag
approximation of stresses near a crack. Crack density in one 900 ply group and reduced laminate properties were derived as a functions of monotonically decreasing temperature. The effects of thermal cycling were included in the analysis using a material degradation fatigue model. In addition, they completed statistical work on the distribution of cracks. A Monte Carlo simulation was used to predict crack locations along with the crack density.
A computer program was written to incorporate all these aspects of the analysis. The code gives crack density and reduced laminate properties as functions of monotonically decreasing temperature or number of thermal cycles.
Experimental work was also completed to correlate with the analytical predictions. They monotonically cooled crossply specimens and inspected the edges for microcracks, tracking crack density and distribution under an optical microscope. Thermal cycling tests were also performed. Specimens were progressively cool and cycled in a thermal environmental chamber
The final results of the analysis were shown to correlate well with the progressive cooling and thermal cycling experiments. The model was also used to conduct parametric studies to understand various factors in the damage mechanism. One important result is that laminates with thinner ply groups were predicted to crack at lower temperatures or number of thermal cycles, but eventually crack more. However, cracks in thinner plies do not effect predicted laminate properties as much as they do in thicker plies. Overall, the analytical model proved to be an accurate and reliable approach with the crossply laminates.
CHAPTER 3
PROBLEM STATEMENT
Our goal is to gain a better understanding of matrix cracking in composite space structures. This goal is pursued by 1) developing a generalized analytical technique, 2) correlating the analysis with experiments, and 3) studying the validity of the assumptions underlying the analytical method.
The analytical technique is a generalization of a fracture mechanics model which uses a shear lag derivation of the stress state. All plies in an arbitrary layup are analyzed under progressive and fatigue thermal loading. The interaction of cracks forming in one layer with existing cracks in other layers is included. Additionally, material softening effects and temperature dependence of material properties are modelled. The result is an analytical model with predictive capabilities. Given laminate geometry, layup, material property information and thermal loading history, the analysis calculates crack density and degraded laminate properties as functions of thermal loading.
Experiments are conducted on a variety of composite laminates to correlate with the analytical predictions. A thermal environmental chamber is set up to monotonically cool composite specimens. Afterwards, the edges of the laminates are inspected under an optical microscope to determine the number of cracks and their spatial distribution.
The validity of the assumptions and ideas used in our analysis is also investigated. X-ray photography and a series of edge inspections is used to examine the three dimensional crack configuration throughout the volume of the specimen. Analytically, a three dimensional free edge stress analysis is used to investigate the significance of edge effects to cracking.
CHAPTER 4
ANALYTICAL METHODS
The analytical methods presented in this chapter are used to model damage in composite laminates due to thermal loading. An energy method is used to predict crack density and laminate property variations. This approach uses a shear lag stress solution and a fracture mechanics failure criteria. The matrix microcracking behavior and the assumptions used in the model will first be explained. Then the basic energy equations for crack appearance will be derived. An algorithm to apply this method to the progressive cooling and thermal cycling problems for any type of laminate will then be described. It includes effects such as material softening and temperature dependent material properties. Additionally, a three dimensional interlaminar stress analysis will be discussed to investigate edge effects not addressed in the general model.
4.1 APPROACH
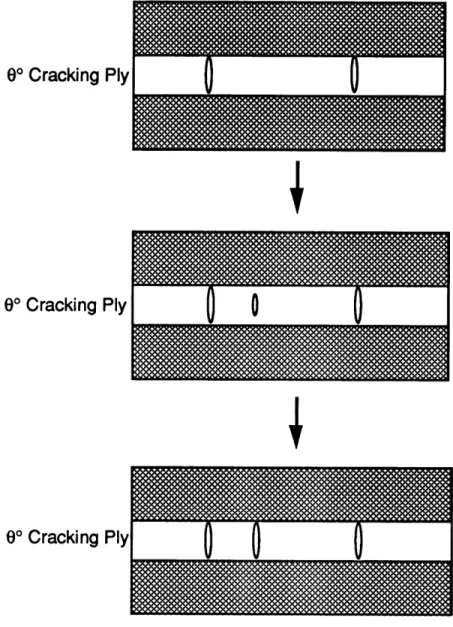
An understanding of microcrack formation is necessary to model the damage development. Figure 4.1 shows a series of edge views of a laminate with matrix cracks illustrated in one arbitrary ply. We assume that cracks grow up and down, spanning the ply thickness. They also propagate parallel to the fibers, through the width of the composite laminate as shown in Figure 4.2a. Cracks are shown in all plies of a [45/90]s layup. The analysis assumes that the appearance of a new crack shown in Figure 4.2b is an instantaneous process. Microcracks form through the thickness and straight across the width of the laminate as a single mechanism. Our study is concentrated on modelling the
8o
Cracking Ply
0 Cracking Ply
90 Cracking Ply
Figure 4.1 Crack formation in an arbitrary ply.
thickness instantaneously. Cracks grow to span the ply
~E~f~
jof6440 e s *a s ga.. al 4.~as "ao a goool ee"$" ag se IM. 6fS1 S~168611
- U ... ... ... ef msalssas N# 8"" a ge, au.Bot$ o Mlg
SNew Crack
Figure 4.2 Crack formation in laminate. We assume cracks form suddenly through the width of the laminate as shown in the process (a) to (b). 45.
904
450(a)...
(a)
4'
45
90
45
(b)
M - .. ! ~Ls/The fracture mechanics approach has two criteria for crack formation. The first is an energy criteria; a crack will grow when energetically favorable. That is, a crack grows when the strain energy release rate, G, generated from crack growth, reaches some critical value G,
G G, (4.1)
where
Id
G - (W - U) (4.2)
a2dl
W is the work done by any external load, U is the strain energy of the body, I is
the crack length, and as is the thickness of the cracking body. The critical strain energy release rate, Go, is considered a material property and is a measure of the fracture toughness. This property is usually referred to as the interlaminar fracture toughness.
The second requirement for crack formation is that it is mechanistically possible. A basic assumption in our model is that there are an abundant number of starter cracks of critical size, 1,. The graph in Figure 4.3 illustrates that, for a ply crack of the type described in Figure 4.2, the strain energy release rate is not dependent on crack size once a critical crack size is reached. This is due to the fact that a cracking ply is restrained by other plies. The energy criterion for crack formation in this case is only a function of the loading or strain energy.
When composites store energy from loading, some of the energy is released by the appearance of a crack. The change in energy of this process is computed to compare with G,
AW - AU a2Gc (4.3)
where AW and AU are the change in external work and internal energy from the state of Figure 4.2a to that of Figure 4.2b. This is a criterion for the appearance
dG
81
1
(Crack length)
of cracks rather than their growth. As mentioned earlier, critical starter cracks exist and the energy release is constant with crack length, so fully formed cracks appear instantaneously once the energy criteria is satisfied.
4.2 DERIVATION OF BASIC ENERGY EQUATIONS
To calculate the strain energy release rate used in the fracture mechanics technique, the stress state in a body with and without a crack must be known. The stress distribution around a crack is derived using a shear lag approximation. Using these solutions, the equations for crack appearance and resulting laminate property reduction are derived.
4.2.1 Stress Distribution and Displacement Field
In our shear lag analysis, we consider a laminate as in Figure 4.4. The stress state is derived between any two cracks, 2h apart. We are modelling the laminate as made up of two components: a cracking ply group, and the rest of the laminate which is smeared together to make up the other group. The coordinates are selected so that the y-axis is parallel to the fiber direction in the cracking ply group. All stresses, strains, displacements, and properties are in reference to the axial direction (the x-axis). They are also per unit width in the y direction, which is into the page in Figure 4.4. A '0' subscript denotes properties of the entire combined laminate. Similarly, the subscripts '2' and '1' represent properties of the cracking ply group and the rest of the laminate, respectively. Thus, a2 is the coefficient of thermal expansion (CTE) of the cracking ply group
in the axial direction and a, is the CTE of the rest of the laminate in the x direction. E2 is the uncracked axial stiffness of the cracking ply group, E, is the
axial stiffness of the remainder of the laminate and E, is the axial stiffness of the entire laminate
4z
ao
Lal/2
a2ai/2
I 0
W
x
El al
E2
a2
El 1a
2h
D
Cracking Ply Group
Rest of Laminate
Figure 4.4 Laminate showing two cracks, 2h apart, in a cracking ply group
embedded in the rest of a smeared laminate.
Eo = Ela, + E
2a2 (4.4)
a +a2
where a, is the thickness of the cracking ply group and al is the thickness of the rest of the laminate. The equivalent stiffnesses, E1 and E,2 , will be evaluated in
Section 4.3.3 which details classical laminated plate theory (CLPT) calculations used in the analysis.
Equilibrium of the laminate illustrated in Figure 4.5 requires
a, a + a2 2 = .(a +a2) (4.5)
with a, and a2 representing the axial stresses in the different ply groupings and
a is the average stress due to externally applied mechanical load. These
stresses are related to the strains:
as = E1(El - alAT) a2 = E2(E2 - a2AT) (4.6)
where AT is the change in temperature relative to the stress free temperature. The cure temperature of the material system is usually considered to be the stress free temperature T,, and AT = T-T,. The strain/displacement relations
are
d4
du2
= du E2 -d (4.7)
dx dx
where e2 and u2 are the strain and displacement in the axial direction of the
cracking ply group, and e, and ul represent the same variables in the rest of the laminate. Combining the stress/strain (Eq. 4.6) and strain/displacement (Eq. 4.7) equations gives us
a d T a du,
a d- d aT 2 = d-a 2AT (4.8)
El
dx
E dxdx
F r
4.
F
d2
dx
a
,
do
Figure 4.5 Free body diagram of small section of laminate.
q = t-)dx )a q = (4.9)
2 dx 2 dx
where q is the shear stress which is assumed to be proportional to the relative displacement:
q = k(u2-u) (4.10)
The variable k is a proportionality constant analogous to the shear modulus. This constant represents a complex combination of the shear moduli of the different ply groups and the interlaminar layer between them. In this development, it will be treated as a fitting parameter in the shear lag solution. Equating the x derivatives of Eqs. 4.9 and 4.10 and making appropriate substitutions using Eq. 4.8 gives us:
2~ dXdx2 dx
(az) dU2 = , -(4.11)
dx2 a2 E2 ElL+(a )AT (4.12)
Substituting for a, from Eq. 4.5 results in a second order differential equation which is a function of the stress in only the cracking ply group.
da, E +Eza 2k
dx2 2kE2a = 2 - aa(a + a2)
+ (a
2- a)AT] (4.13)
The differential equation can be simplified by substituting Eo in Eq. 4.4 and rearranging:
d2a
2 452
d 2 a 2 = - (4.14)
dxa
2where is the shear lag parameter:
- k(Ea, + E2a2)a2 (4.15)
x
= 2k(Ea +EEa2) ', 2k- (a2 - a,)AT
a2
The general form of the solution to differential equation (4.14) is:
+ Asin{ 2x J
(a2 )
+ Bcosh( 2x
(a2
Using the boundary conditions that the stress at the two crack locations is zero
(a,=0 at ±h) we can solve for the coefficients.
A=0 B -
2cosh
4 co(2 CSh 2h (a2 (4.18) (4.19)Substituting the coefficients gives the final expressions for stress distribution in the cracking ply group:
4
cosh( 2 x
os( J cosh 2 h
(4.20)
= -,L[(Ea + E)a -(a - a,)ATI 1
cosh 2 x
- s(2 )j
4.2.2 Strain Energy Release Rate
With the completed derivation of the stress field between any two cracks, the strain energy released from the appearance of a new crack can be
and
(4.16)
24
a2 4 2 (4.17)
formulated. For now, we will assume an uniform crack distribution. We derive the change in strain energy between the two states illustrated in Figure 4.6a and 4.6b, which will be referred to as the initial and final states, respectively. We assume that the strain energy release rate per unit width is:
AG = AW- AU (4.22)
a2
where AW is work done by the load, AU is the change in stored elastic strain energy, and a2 is the thickness of the cracking ply group. Our assumption is that
this laminate is under fixed mechanical or thermal loads.
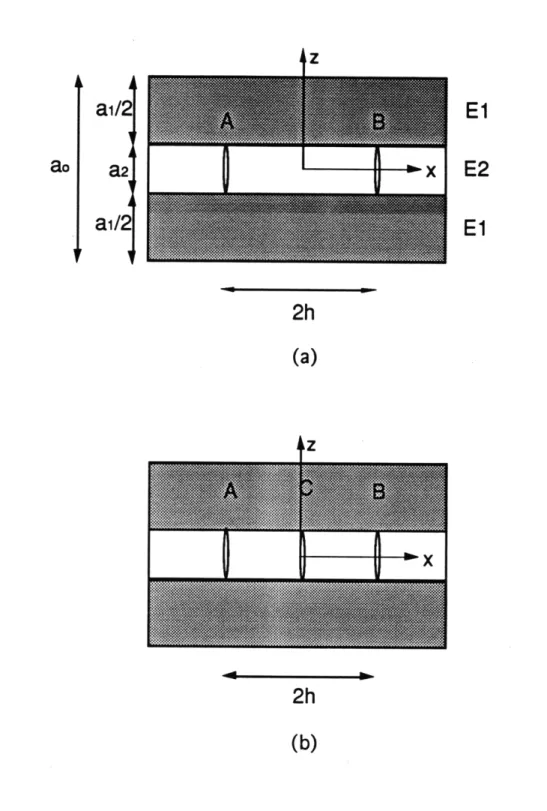
Given the stress fields calculated in the previous section, the strain energy in the laminate between any two cracks separated by distance h can be calculated. The energy released by the appearance of a new crack half way between two existing ones is calculated as follows. The internal energy of the initial configuration (Figure 4.6a) is calculated. The internal energy of the configuration including the new crack (Figure 4.6b) is calculated using the same method. The energy in the two regions from crack A to crack C and crack C to crack B are calculated using separation h /2 in place of h in the original calculations. Then the energy in the two regions are summed. The energy released from the appearance of a new crack C is then
AU = U(h) - 2U(h/2) (4.23) where U(x) is the energy in the laminate between two cracks distance x apart.
To evaluate AU, the energy formulation of Laws and Dvorak [8], with some changes in notation is used. The derivation will not be repeated here. The only modifications are that the applied mechanical load is assumed to be zero, while the thermal loading, reduced to a residual stress term by Laws and Dorak, is the active loading term.
ai/2
El
ao
a2
Xx
E2
al/2
El
2h
(a)
2h
(b)
Figure 4.6 (a) A laminate with two cracks, A and B, spaced 2h apart. (b) Same
laminate with the appearance of an additional crack C.
Equation 4.21 has thermal and mechanical components. Note that a change in temperature has the same effect on the stress in the cracking ply as an equivalent mechanical load
, = aEE 2(a - T (4.24)
Ea, + Ea2 2
This equivalent stress is included as a "residual stress", without justification, by Laws and Dvorak. This equivalent stress may be substituted directly into the expression for the strain energy release rate per unit crack length from Laws and Dvorak
AG
AW - AU
a(4 + a)E-2
2nh(/htanh(
2
)
(4.25)a2 2
iEE
a2 a2Nairn [16] held some reservations concerning the methods used by previous reseachers, including Laws and Dvorak, for incorporating residual stresses. However, use of alternate energy formulations was found to have only a small effect on crack prediction in cases relevant to this study.
4.2.3 Degradation of Laminate Properties
Expressions for reduced laminate properties resulting from microcracking are now needed. Laws and Dvorak [8] derived the loss of stiffness in a cracked laminate. The average strain of the segment between cracks A and B, separated by a distance of 2h, in the uncracked portion of a mechanically loaded laminate can be shown to be
e - o 1 + 2 tan { ) (4.26)
This expression can be valid for any two sections 2h apart. Substituting the expression for crack density:
1
p=- (4.27)
h
and rearranging gives the effective stress/strain relation for the cracked laminate: a, = E(p)e. (4.28) where E(p) = Eo (4.29) 1+ paE,
I
24aEl pa2)is the new laminate stiffness as a function of crack density. McManus et al. [48] went a step further to derive reduction of all laminate properties due to cracking. Considering the reduction in stiffness to be caused entirely by a reduction of stiffness in the cracking ply group, they define a knockdown factor, K, due to the microcracks
E2(p) = KE2 (4.30)
where K can be calculated as:
K =al
I
11- 2tanh(3._i lKE
+ a2E22P tan4 2= - a2p
L
2 2 a P(4.31)
The knockdown factor is used to recalculate all of the laminate properties. The details of this method are given in Section 4.3.4.
4.3 IMPLEMENTATION FOR THERMAL PROGRESSIVE AND CYCLIC
LOADS
The basic formulations for crack appearance and reduced laminate properties are used to derive expressions to predict crack density and degraded
properties due to progressive and cyclic thermal loading. The model is general enough to include all arbitrary laminate configurations, and includes modelling of various secondary effects.
4.3.1 Crack Density as Function of Temperature
The basic energy criteria developed in Eq. 4.25 can be expressed as a function of applied thermal loading, AT, for the laminate shown in Figure 4.7. Substituting the expression for the equivalent stress Eq. 4.24, simplifying with Eq. 4.4, and equating AG to Go, the final expression for the energy criteria is:
G aa2E1E2 (a2 2 AT 22 tanh - tanh( 2 ) (4.32)
2
(aEl
+ a2E2) a2 a2If we assume an existing uniform crack spacing 2h, then at a thermal load AT the criteria above will be satisfied and new cracks will form midway between the existing cracks, resulting in a new crack spacing h. An existing crack spacing just under 2h will not satisfy the criteria, and no new cracks will form. In practice, the crack spacing is not uniform, and the true crack spacing will fall somewhere between these extremes. Hence, the crack density, p, at temperature change AT is:
1 1
- < p <
-(4.33)
2h h
where h satisfies Eq. 4.32. Note that Eq. 4.32 can be solved explicitly for AT given h, but if we require h (or p) for a given AT, it must be solved graphically or numerically.
4.3.2 Crack Density as Function of Thermal Cycles
To predict crack density as a function of cyclic thermal loading, a fatigue model was developed by McManus et al. [48]. To account for thermal cycling, we
ao
al/2
a2al/2
Thermal Load
AT
El,
al
E2,
a2
El, al
2h
Rest of Laminate
O
00 Cracking Ply Group
assume that fatigue loading decreases a material's resistance to cracking. A decrease in the first ply failure stress due to cyclic loading has been observed. Given the experimentally determined first ply failure stress, ap, as a function of loading cycles, N, and the original critical strain energy release rate for the desired material system, G(O), the critical strain energy release rate can be expressed as a function of N:
G = GQ(O)[0f(N Y2(O)] (4.34)
This fatigue model will be incorporated to solve for crack density as a function of thermal cycles in Eq. 4.32.
4.3.3 Solution Algorithm Including Secondary Effects
This analysis calculates crack density for every ply of any general laminate, and the resulting degraded laminate properties. The algorithm includes effects such as material softening and temperature dependent material properties. "Material softening" refers to the fact that existing cracks will effect the behavior of the entire laminate, changing its response to further loading. This allows cracking in one ply to realistically affect the cracking behavior of the other plies in the laminate. We incorporate the effects of cracking in all plies such that the reduced properties at each temperature or cyclic load increment reflect the damage incurred in all plies at all previous loads. Material properties are also known to be dependent on temperature. We use temperature dependent material properties, linearly interpolating between temperatures at which data is available.
Figure 4.8 shows a flow chart describing the basic algorithm. It will be described for the case of progressive thermal loading. The analysis starts at the
Start
Load Increment
(Temperature or Cycle)
Compute Material Properties
at Temperature or Cycle
For
Ply
'i'Smear all other plies
incorporating cracking effects
Repeat for
all _es
Calculate new crack density including ply
orientation effects
Calculate new laminate properties
stress free temperature and increments to a user specified minimum temperature. At each new temperature, the material properties are computed. The ply 'i' is designated as the cracking ply group. A coordinate system is selected so that its x-axis corresponds to the fiber direction of this ply group. Properties of the rest of laminate are smeared together. The effects of existing cracks in the rest of the laminate are included at this stage. The crack density in ply i at this temperature is then calculated. Equation 4.32 is solved for h using a bisection iteration numerical method and crack density p follows from Eq. 4.27. This procedure is repeated for every ply at this temperature. After computing the crack density for every ply, the overall laminate properties are calculated to reflect all the damage at this temperature. These steps are iterated to calculate crack density and laminate properties at progressively lower temperatures.
4.3.4 Derivation of Stiffness Constant
Laminate theory (CLPT) [49] is used to derive the stiffness constants used in the above analysis. The equivalent stiffnesses, E0, EI, and E2 are necessary to
solve for crack spacing in Eq. (4.32). The effective laminate properties are also required to complete the analysis. First, appropriate material properties are obtained as functions of temperature or cycle number. For each ply i, we have material properties Eli (longitudinal stiffness), Eu (transverse stiffness), vi(major Poisson's ratio), Gi (shear stiffness) a, (longitudinal CTE) and atc (transverse CTE). Ply i has a thickness of ti. The fibers of each ply are aligned at an angle 0, to the x-axis of a global coordinate system. The cracking ply group, c, is treated as a single layer with orientation 0, The crack formation analysis is carried out in an alternate coordinate system defined such that the fibers of the cracking ply group are aligned parallel to its y-axis. In this coordinate system, the ply angles
Of =
,+ ,
v° = 900
(4.35)
(4.36) The necessary laminate properties for computing crack density and property degradation can be calculated as follows:
[A] = i=1
[aQ]
=[T'
][Ql[TT Q11(i) 0 (4.37) (4.38) (4.39) Q12(i) 0 Q22(i) 0 0Q
66(i)
Q,(i2 E t Q22() El Di ~(i)Eu
DiG,
D
(4.40a-e) COS2 O' = sin2 O - sin O cos Osin2 O" 2 sin O" cos O"1
cos2 Oi -2 sin Ocos O sin O6cos Of cos2O- sin2
Of
The equivalent stiffnesses required in Eq. 4.32 are:
Eo
=
Al
ao Ez = Q22(c) E = Ea - E2a2 a, where, [T] (4.41) (4.42) (4.43) (4.44)where a2 is the thickness of the cracking ply group (a, = ta). The total thickness
is 2ao and al = a, - a2. The crack density is now computed for ply c. Once ply c
has started cracking, the properties of that ply are 'knocked down' due to the cracking damage. A knockdown factor for ply i is defined by Eq. 4.31. For all subsequent calculations, the components are changed as follows:
Q 11(i) = Q,1,,
S= (4.45a-d)
Qfi) = Ki Oi)
These steps (4.35 to 4.45) are repeated for each ply (c = 2 to n-i) to predict crack densities and changes in properties for each ply.
After all the plies have been analyzed in this manner, the degraded effective laminate properties are calculated at each loading:
E 1 (4.46)
A, ao
[A'] = [A-] (4.47)
[a]' = [A'][ ][i]t , (4.48)
i=1
[] = T] a, (4.49)
a" = a,, (4.50)
All these steps are repeated for each thermal loading increment until completion of an entire thermal profile. Each increment incorporates the 'knocked down' properties of all the plies from the previous increment, and


![Figure 6.9 Analytical stiffness prediction vs. temperature for [0/45/90/-45], laminate](https://thumb-eu.123doks.com/thumbv2/123doknet/13980636.454280/83.918.172.721.314.924/figure-analytical-stiffness-prediction-vs-temperature-for-laminate.webp)
