Uprating Transmission Lines through the
use of an innovative real-time monitoring
system
E. CLOET J-L. LILIEN, member IEEE Elia (Belgian Transmission System Operator) Professor at the University of Liège Belgium Belgium
Abstract -- This paper describes a brand new
method of real-time monitoring of overhead transmission lines. The method makes use of what is called the “Ampacimon” system. The system uses an Ampacimon module, which is a real time monitoring device that deduces the sag by vibration analysis without the need for any line data or environmental data. The Ampacimon system has been proven to be accurate within a sag error margin of ±2%.
Keywords -- Ampacimon – Real-time monitoring –
Dynamic Rating – Conductor – Power Lines
I. INTRODUCTION
The growing demand for power is a major challenge for grid operators. The massive implementation of renewable energy sources, especially large costal and off-shore wind farms have triggered the need for additional transmission capacity. All grid operators worldwide face the same problem: it is nearly impossible to build new overhead power lines. In such an environment, transmission system operators must explore the idea of increasing the capacity of transmission lines by maximizing the use of the existing conductors on towers.
Against this backdrop, Elia (the Belgian system operator) decided to participate in a project launched by the University of Liège called “Ampacimon” (short for “Ampacity monitoring”). Strong interest was also shown by the French system operator RTE, which decided to track the project in collaboration with the University of Liège and Elia (the Belgian Transmission System Operator).
The pilot experiments lasted for about two years and were successfully completed in 2010.
II. REAL-TIME MONITORING
The primary concern with electrical loading of HV overhead lines is to respect the “ground clearance” (distance between the conductor and the ground) [2]. The ground clearance depends on a number of factors including weather parameters which vary all the time. This means that the position of the conductor in space, the sag, is continuously changing, affecting the vertical safety clearances and subsequently the thermal rating of the line. The difficulty of predicting weather parameters resulted in conservative assumptions in order to ensure the public safety and the security of the electrical system. If grid operators want a better utilisation of the load current capacity of their overhead lines, ensuring that the regulatory clearances above ground are always met, they need a system which determines the line sag in a span by direct measurement and preferably without the need to factor in weather parameters.
III. SMART SENSOR AMPACIMON
Ampacimon (figure 01) is a smart sensor which is attached directly to an overhead power line. It can evaluate a span’s real-time sag without the need for any supplementary data (such as load, sagging data, topological data, conductor data and weather data). Ampacimon is a patented, registered-trademark device that analyses conductor vibration and detects a span’s fundamental frequencies [6]. The fundamental frequencies form the exact signature of the span’s sag. A greater sag means lower frequencies and vice versa. Exterior conditions such as load, weather, topology,
suspension movement, creep, presence of snow/ice, etc. affect the sag and are therefore automatically incorporated into frequency readings. Ampacimon is a direct sag evaluator. Modules can be installed anywhere along the span. Using accelerometers
with a certified sensibility at 100 G (typically
used in airplane and vehicle industry, thus with a high degree of robustness in harsh environment), even a slight movement of 1 mm can be detected at the lowest frequency for a typical span (say 0.15 Hz), with even smaller movements detectable at higher frequencies. Data is initially processed by a data signal processor (DSP) before being sent via GSM/GPRS to a remote server, where it is collated and analysed to give the appropriate readings. Once the Ampacimon unit is installed on the span, it is powered by the local electromagnetic field and is thus autonomous. Furthermore, it does not need to be calibrated as the sag is deduced from the detected frequencies and not from signal
amplitude. Modules measure around 40 cm in
length and weigh approximately 8 kg. They are fixed to HV conductors and can be installed live-line in less than an hour. An example of fixation is shown on figure 03.
Figure 01: Ampacimon module (or sensor)
IV. PRINCIPLE
The sag is well known and defined from literature [3].
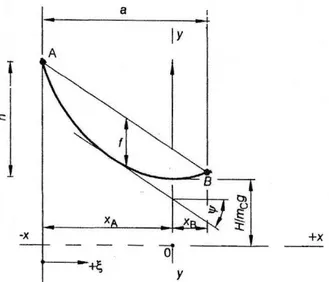
Figure 02 yields its definition in the case of an unlevelled span, the sag representing the largest vertical distance between the catenary and its (imaginary) chord. Measuring sag is time consuming and is usually done by land surveyors.
However, cable dynamics can also solve the problem and determine the sag easily. The only parameter which must be known is the “fundamental frequency” because there is a relationship between that frequency and the sag. It is important to note that this relationship does not make use of any data (except the gravitational constant ).
Figure 02: Sag definition. Horizontal distance between two attached end: a [m], difference level h [m], sag f [m], lowest point abscissa xA [m],
conductor mass per unit of length: mC [kg/m],
gravity g [m/s²], chord angle ψ[dimensionless], H: horizontal tension, tension component along x axis [N].
It is comparable to the pendulum. If a pendulum is oscillating, its swinging frequency is independent of its mass; it is just related to its length. Thus by using a system detecting the movement of the span and which is able to deduce from that movement the fundamental frequency, the sag can be found immediately without the need for other data (such as span length, mass of conductor, tension, etc.).
V. SAG DETERMINATION
To start the explanation the basic theory of the catenary curve is used. Consider the profile of a uniform cable hanging under its weight between two supports as shown in figure 02.
÷
ø
ö
ç
è
æ
=
a
x
H
ga
m
g
m
H
x
y
c Ccosh
)
(
(1)In this document, we will limit the development to the simplified case of horizontal span (span length L = a), with reasonable sag/span ratio. The well known parabola formula will be used here to keep things as simple as possible:
2 max
8
Cm gL
f
H
=
(2)which gives in this case the sag.
The fundamental frequency is a frequency that is not easily observed directly on cable structure (except for very tight cables, like in violin). Indeed the cable dynamics is known from literature and explained for example in [1]. There are so-called "in-plane" and "out-of-plane" modes, both being affected by end-span fixation. So that a deep analysis is needed to extract that fundamental value from a full spectrum, as is observed on a span vibrating under natural turbulent wind. Generally there is no easy access to that mode. It is much easier to deduce it from higher modes (2, 3, 4, etc.)
It is given by: 0 1 2 C H f L m = (3)
We can now use equation (3) about the frequency and introduce the sag formula (2) in it.
By replacing H by its value we obtain:
2 max 0 max ( ) 8 1 1 1 2 2 2 8 C C C m gL f H f L m L m f = = = g
The square of that equation is giving the following relationship: max 2 0 1 32 g SAG f f = = (4)
Thus, sag is obtained by knowing the fundamental frequency. No other data are needed. The gravity
constant is well known and equal to 9.81 (m/s2) on
earth with a very good approximation. As can be seen in the formula the sag is not influenced by any errors that could come from the topology knowledge, the conductor data nor even from weather data. This method has been patented for power line applications. A one month sag output is typically shown on figure 05.
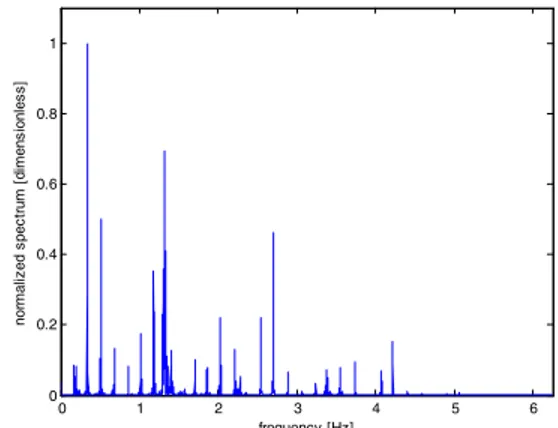
A typical spectrum of frequencies as observed on site is shown on figure 03, from which Ampacimon algorithms extract the fundamental frequency (the value of formula 3) which is injected into equation 4 to get the sag with no required data.
0 1 2 3 4 5 6 0 0.2 0.4 0.6 0.8 1 frequency [Hz] nor m al iz ed s pec tr um [ di m ens ionl es s ]
Figure 03: Typical Ampacimon embedded spectrum which is analysed by the algorithms to deduce the fundamental frequency of the measured span.
Let’s note that for sag and ampacity application, only the very low frequencies of the span (up to about 4 Hz, as can be seen on fig.3) are treated. These frequencies are in the buffeting behaviour of the span under turbulent wind badly spatially correlated as it is the case for low wind speed for which ampacity is required.
VI. PRACTICAL EXPERIENCE WITH AMPACIMON
A. SAG EVALUATION
A number of Ampacimon modules have been fitted to Elia’s (and RTE's) HV grid (figure 04) and a whole system has been developed that includes transmission and links with the national control centre.
Figure 04: Ampacimon sensor as installed on 400 kV twin conductor line on ELIA’s network.
Figure 05: Sag change during one month as obtained from Ampacimon sensor on ELIA’s network. No data needed to get this curve.
To certify the system, independent land surveyors measured the sag at a given point over a period of several days and on many different spans (different conductors, different span length, suspension span, dead-end span, etc.). Measurements showed a margin of error of around 20 cm, which is accurate enough to predict ampacity (figure 06).
Figure 06: Ampacimon sag versus topographer sag
Errors resulted from:
o The land surveyor’s exact measurement time (margin estimated at 2 minutes)
o The accuracy of the land surveyor’s measurement (margin estimated at 1%) o The Ampacimon unit’s exact measurement
time (margin estimated at 2 minutes) o The accuracy of the Ampacimon unit’s
measurement (margin estimated at 20 cm) Based on these readings, we can confirm that Ampacimon gives appropriate and highly accurate sag measurements across the whole range from 0 to 25 m (less than 20 cm margin of error).
According to observations, sag changes are not only impacted by load changes but are, as one might expect, drastically affected by the weather.
B. AMPACITY
Real-time power line ampacity is calculated in several steps. It is outside the scope of this article to go into further detail. More details are available in sources [5, 7, 8, 9]. Below, we give some results. Figures 07 and 08 show an ampacity histogram for the HV lines of Elia.
Based on observations we can say that the permissible ampacity was far higher than static ampacity (in most cases by at least 20%).
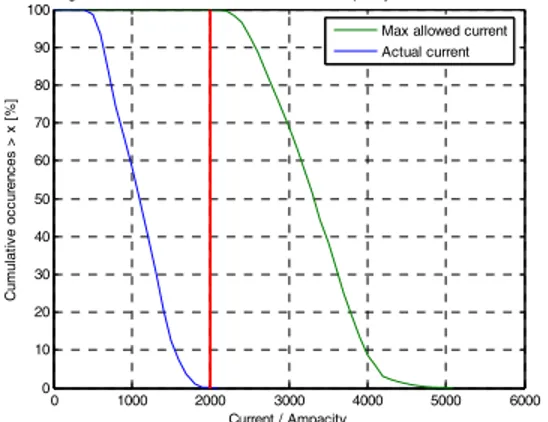
Doel Aug 2009 : module 3 - occurences of current/ampacity when module switched on 12 0 1000 2000 3000 4000 5000 6000 0 2 4 6 8 10 Current / Ampacity O c c ur enc es [ % ]
Max allowed current Actual current
Figure 07: Histograms of occurrences for actual load flow (left part), static rating (vertical line at 2000 A) and dynamic rating (right part).
0 1000 2000 3000 4000 5000 6000 0 10 20 30 40 50 60 70 80 90 100
Doel Aug 2009 : module 3 - occurences of current/ampacity when module switched on
Current / Ampacity C u m u la ti ve o ccu re n c e s > x [ %]
Max allowed current Actual current
Figure 08: The same information as on figure 07, but shown by cumulative occurrences. By more than 90% of the time the ampacity is higher than 25% of the static rating.
Even in the most extreme cases, the contingency limit would not have caused problems despite the static rating being exceeded by about 20%. This means that, if there had been a contingency situation, no lines would need to have been cut off. It also means that the Ampacimon sensors can successfully reduce the risk of cascading failure and consequently black-out. Moreover, with HV lines remaining in service during a contingency situation, there would have been no negative financial impact on power production relocation. One of the key aspects for power lines operators at national control centres is that Ampacimon outputs (ampacity and sag) is based on sag clearances, which is available with no data and thus give a perfect and fully robust alarm if the actual sag is crossing the maximum allowable sag on critical spans.
VII. FINANCIAL IMPACT
According to an international study performed by ENTSO-E Europe will need to invest up to €28 billion in electricity infrastructure over the next five years (2015) to secure its key energy goals, including integrating renewable energies into the grid. Total infrastructure needs will amount to some 35,000 kilometres of new transmission lines across 34 European countries. In all this the greatest challenge is the permitting process. Grid operators all know that the permitting process is difficult and takes many years. The uncertainty about the length of time for public consultation and negotiations with land owners on right-of-way are prevalent.
If we look at the huge investments to come and the problems with the permitting process TSOs will certainly need to spread out there investments without endangering the grid. A real-time monitoring system, such as Ampacimon, can be of help.
A technical/economic study proves that the investment in an Ampacimon system can be worthwhile. The case study, performed to justify the investment in an the system, showed that postponing by less than 2 years the construction of a second circuit of 10 km 380 kV 2*707 AMS on existing towers already justifies the investment in the Ampacimon system.
Of course many other financial impacts may be found if the system is completed with ampacity forecasting, which is currently being developed
within the EU's TWENTIES (
www.twenties-project.eu) and Ampacimon is already able to produce forecasted ampacity on a 4-hours-ahead basis. The next steps will be one and two days ahead, using meteorological predictions, and appropriate stochastic data mining based on existing past information.
VIII. CONCLUSIONS
Practical experience shows that actual ambient conditions are normally less restrictive than those used in the theoretical calculations. This means that overhead lines could transmit more current than their predefined nominal value. A margin of about 20% over static rating is most of the time available in many places.
To identify the maximum load for a HV line, TSOs require a dynamic rating system which is reliable, accurate and easy to install. We believe that the Ampacimon system can enable optimum HV line operation, help to enhance grid security and potentially prevent blackouts.
To take advantage of real-time monitoring and dynamic rating, transmission systems operators must be prepared to adopt their conventional working methods e.g. operating the grid in accordance with dynamic data based on weather conditions. Today, this may prove a difficult step to take.
The Ampacimon system is an attractive investment (both technically and economically) and is ready for real-time applications. Further research is underway to achieve long term predictions based on weather forecasts and historical analysis.
IX. ACKNOWLEDGMENTS
The authors would like to thank the Ampacimon SA team located at Wallonia Space Logistics in
Belgium (www.ampacimon.com). In particular, the
authors are grateful to Professor J. Destiné, Thibaut Libert and Thierry Legros who proficiently managed the electronic behaviour of the system and to Bertrand Godard and Huu-Minh Nguyen who managed the software development.
X. REFERENCES
[1] H.M. Irvine, Cable structures, Penerbit ITB Bandung Indonesia, 1988.
[2] F. Kiessling, P. Nefzger, J.F. Nolasco, U. Kaintzyk, Overhead Power Lines Planning design construction, Springer, 2003.
[3] C. Avril, Construction des lignes aériennes à haute tension, Editions Eyrolles, 1974.
[4] S. Guérard, P. Van Dyke, J.L. Lilien. Evaluation of power line cable fatigue parameters based on measurements on a laboratory cable test span. International Symposium on CABLE DYNAMICS, Paris, Sept 2009 (9 pages)
[5] CIGRE Technical brochure N° 324. “Sag-Tension calculation methods for overhead lines”, June 2007
[6] J.L. Lilien, S. Guerard, B. Godard, J. Destiné, E. Cloet. Microsystem array for live high voltage lines monitoring. CIGRE 2006, CIGRE session papers, Group B2, (8 pages)
[7] CIGRE Technical Brochure N° 299. “Guide for selection of weather parameters for bare conductor ratings”, August 2006
[8] E. Cloet, J.L. Lilien, P. Ferrières. Experiences of the Belgian and French TSOs using the
"Ampacimon" real-time rating system CIGRE 2010, CIGRE session papers, Group B2, (8 pages) [9] IEEE subcommittee 15.11. “IEEE guide to the installation of overhead transmission line conductors” IEEE Standard 524. 1993