Publisher’s version / Version de l'éditeur:
Vous avez des questions? Nous pouvons vous aider. Pour communiquer directement avec un auteur, consultez la première page de la revue dans laquelle son article a été publié afin de trouver ses coordonnées. Si vous n’arrivez pas à les repérer, communiquez avec nous à [email protected].
Questions? Contact the NRC Publications Archive team at
[email protected]. If you wish to email the authors directly, please see the first page of the publication for their contact information.
https://publications-cnrc.canada.ca/fra/droits
L’accès à ce site Web et l’utilisation de son contenu sont assujettis aux conditions présentées dans le site LISEZ CES CONDITIONS ATTENTIVEMENT AVANT D’UTILISER CE SITE WEB.
Building Research Note, 1985-06
READ THESE TERMS AND CONDITIONS CAREFULLY BEFORE USING THIS WEBSITE. https://nrc-publications.canada.ca/eng/copyright
NRC Publications Archive Record / Notice des Archives des publications du CNRC :
https://nrc-publications.canada.ca/eng/view/object/?id=9fa98857-9a31-4d51-8df0-64dbbf5d158a https://publications-cnrc.canada.ca/fra/voir/objet/?id=9fa98857-9a31-4d51-8df0-64dbbf5d158a
NRC Publications Archive
Archives des publications du CNRC
This publication could be one of several versions: author’s original, accepted manuscript or the publisher’s version. / La version de cette publication peut être l’une des suivantes : la version prépublication de l’auteur, la version acceptée du manuscrit ou la version de l’éditeur.
For the publisher’s version, please access the DOI link below./ Pour consulter la version de l’éditeur, utilisez le lien DOI ci-dessous.
https://doi.org/10.4224/40000485
Access and use of this website and the material on it are subject to the Terms and Conditions set forth at Field sound transmission loss measurements
Ser THI a92 no, 232 c o 2 BLDG '
National R e a r c h Gonseil national
I
*
Council Canada de recherches Canada Division of Building ResearchBuilding Research
Note No.
232
Field
Sound
Transmission
Loss
Measurements
FIELD SOUND TRANSMISSION
LOSS
MEASUREMENTSby A.C.C. Wmnock
Noise and Vibration Section Division of Building Research
BRN
232 June 1985ISSN 0701-5232
TABLE OF CONTENTS
ABSTRACT/RESUME
. . .
1INTRODUCTION
. . .
1Elements of Good Acoustic Design
. . .
2MEASUREMENTS
. . .
3Poured Concrete Walls and Floors
. . .
3Constructions with Solid Concrete Cores
. . .
5Concrete Floor Slabs Supported on Steel Joists
. . .
7Walls with Concrete Block Cores
. . .
7Double Wood Stud Constructions
. . .
11STAGGERED WOOD STUDS
. . .
13SINGLE WOOD STUD WALL
. . .
15STEEL
STUD WALLS. . .
15WOOD JOIST FLOORS
. . .
16. . .
UNUSUAL CONSTRUCTIONS 18 SUMMARY. . .
- 2 2 REFERENCES. . .
23ABSTRACT
Measurements
of
field sound transmission loss in a number of buildings are presented, together with commentary pointing out where design errors were made and how the designs could have been improved.Cette note pr6sente les rksultats des mesum de la perte de transmission du son dans
un certain nombre de biitiments. L'auteur discute kgalernent des erreurs au niveau de la conception et propose des d t h o d e s pour amdliorer l'acoustique du bgtiment.
INTRODUCTION
When the sound transmission losses of a partition are measured in a laboratory, great crve
is taken to ensure that the only significant sound path is through the partition being tested- This is important so that meaningful comparisons cm be made among measurements in different laboratories. In contrast, when a partition is installed in a building, there are
many additional paths for the sound to follow as it travels between apartments.
If
thetransmission along these additional or "flanking" paths 3s large enough, the sound trans- mission loss measured in the building will
be
less than that measured in the laboratory. Occupants in such buildings will not enjoy the privacy the designer intended. Good acous-tical design considers all of these flanking paths arid ensures that Banking transmission is reduced t o a minimum.
Among the other reasons for poor sound isolation in buildings are design or construc-
tion errors. Measurement of sound transmission Ioss for partitions in buildings provides valuable experience about all of these factors and interesting comparisons with laboratory measurements. Ideally a quantitative measurement of
the
sound transmission along every path in a building could be made butthat
is not yet possible. There is hope t h a t new sound intensity measurementswill
allow us to approximate this ideal but the data de- scribed here were colIected before advanced technology made it possible to measure sound intensity easily.In some
of
the
investigations described, design errors occurred through a lack of under- standing ofthe
fundamental principles of acoustics. Materials were placed in wrong posi- tions inside walls, at inappropriate methods of attachment were used.In
other cases there is no obvious reason why the wall or floor did not function as well as similar walls in lab* ratory or other field tests. The problem could have been some construction error concealedbehind
the finishing layers of the partition, or excessive flanking transmission caused by poor design, or both. It was not always practicabf e to investigate these constructions fully. Some of the fundamental rules of thumb that should be followed when designing a partition are stated here.In
the examples that follow, some of these rules are broken repeatedly.Elements of Good Acoustic Design
1. Walls, floors and a11 elements of partitions should be thoroughly caulked so that no
holes or fissures act as sound leaks. This appIies t a flanking structures rrs well as to
the
party wall, which is the obvious transmission path.2. Solid Iayers in a wall should be far enough apart so that the mass-air-mass (m.a.m-)
resonance between them exceeds about 80
Hz.
The frequency of this resonance can be calculated from the equation:where rral and rnz (kg,/m2) are the masses of the layers and d (mm) is the thickness
of air gap between them.
(In
some applications, such as with concrete block, the face of the material is not completely impermeable and sometimes the effective air spaceseems to increase beyond the obvious physical space. It is not a good idea to rely on this effect unless sound transmission tests have been made
with
identical materials in a laboratory or a building.)If
this rule is not foIlowed, there is a serious risk ofreducing the sound transmission losses of the partition at low frequencies because of the resonance effect.
Lightweight layers, such as wallboard, must not be connected rigidly.
There
should
always be some resilient device or material between them to reducethe
transmission of acoustical vibrations. A ccrrmnon error in this respect is attaching layers of wallboard directly to each side of wood studs. This should never be done if good sound insulation is the goal. Some kind of resilient connection should alsobe
used when attaching layers of wallboard t o concrete black or other heavy walls, but in practice this seemsto be less important than for two lightweight layers. For example, measurements show that the transmission losses obtained by using wood furring strips to directly attach wallboard to concrete blocks are
high
enough for most purposes.4. Put sound-absorbing, fibrous material in the cavity between two layers
in
a wall. Sound absorbing material inside the wall cavity damps out the various resonancesthat can occur in a doable layer wall; this wiIE be fully effective only if the two sides of the wall are not connected rigidly.
Other factors that determine the sound transmission through partitions are dealt with in a forthcoming Canadian Building Digest. As with many rules of thumb there are
exceptions. TO ensure that a wall or floor system is functioning properly it is best to make measurements on a representative specimen as soon as possible during the construction. Quick methods of measurement
[I]
can determine whether a problem exists or not.The data presented here are not necessarily free of
the
effects of flanking,The
comments for each case give some idea of whether the measured transmission Iosses can be regarded as typical or whether they are uncharacteristically low. Even the highestfieEd
soundtransmission class (FSTC) value shown for a particular construct ion is not necessarily the best that can be done with that construction. It is simply the best that was measured in this set of measurements but it can be considered as a reasonable expectation when
good design procedures are followed. In most cases there is a spread in the FSTC ratings obtained for norninaIly identical structures. This is a normal feature of field testing and reflects the variability of the construction process as well as that of the test.
Measurements were not always made in strict camplimce with ASTM method E336 121, but
the final results should not be seriously aflected by any small deviations from the required methods. The measurements were made over a period of about ten years by several members of the Noise and Vibration section, 9s well as t h e author. Sonnd transmission
class ratings are assigned in accordance with the requirements of ASTM Ed13 131. MEASUREMENTS
Poured Concrete Walls and Floors
From
the
acoustica1 point of view, poured concretehas
an inherent advantage over other farms of construction because it is a dense materiat. A poured concrete floor slab or wall 150 ~lnm thick should provide an FSTC rating of about 55, simply because of its mass. The data in Big, 1 for 150 mm concrete floor slabs are in accord with expectations."m
20 125 250 500 1 k 2k 4k
FREQUENCY, Hz
FIG.
1. Sound trmsmission loss, 150 mm nominal thickness, reinforced concrete slabIt
might seem that poured concrete construction would offer few opportunities to go wrong acoustically. Unfortunately faults are possible. Figure 2 shows measured data for two poured concrete walls (thicknesses 190 mm and 150 mm) with wallboard glued to each side. The sound transmission losses are significantly lower than those in Fig. 1, Investigationof wall
B
showed that when the concrete was poured it had not flowed properly and therewere voids around the aggregate that penetrated completely through the wall. This fault was detected acoustically and was visually obvious when the walIbaard on one side was removed. Sound was entering the space behind the glued-on wallboard, passing through the voids and then down behind the waIlboard on the second side of the wall.
,
,
,
20 125 250 500 l k 2k 4k FREQUENCY. Hz
FIG.
2. Sound transmission loss, poured FIG. 3.Sound
transmission loss, 1 50 mmconcrete walls
with 12
mm wallboard ce- poured concrete wall with 12 mm wallboardmented to each side. A
-
190 mmthick,
cemented to each side,O n
one side metalFSTC 49;
B
-
150thick, FSTC
48. studs, glass fibre and 12 mm g y p s u m boardwere added to reduce the sound tramsmis-
For practical reawns wall
B
was fixed by adding metal studs, glass fibre and another layer of wallboard onone
side. The data
forthe
repaired wall &re shownin
Fig, 3. The FSTC is 59, only a few points better thanthe
properly poured floor slabs in Fig. 1.No
investigations were made on wall A (Fig. 2) to verify the cause of its poor perf~rmmce but the shape of theTL
curve suggests a problem similar to that of wallB.
Inspection of the walls by someone knowledgeable before the wallboard was added would have prevented this problem. It would have been easy to fill the obvious crevices in the wall with plaster. If poured concrete construction is to provide the protection that it should, then inspection of the walls before the wallboard is applied is essential. Later in this note, it is pointed out that gluing wallboad directly to concrete blocks c a n cause reductions in
sound transmission Ims because of the thin film of air trapped behind the walIboasd. This
can result in an m.a.an. resonance, as mentioned above. T h e same effect could occur with
poured concrete.
Constructions With Solid Concrete Cores
Figure 4 shows two examples of a wall system
that
incorporates a 100 mm thick poured concrete layer. The FSTC values for these walls are quite low and they illustrate a problem that arises with stiff materials such as concrete and walIboard. At a frequency called the coincidence frequency, which is determined by the mass m d stiffness of the layer, a resonance occurs causing a reduction in the transmission loss in this frequency region.The
coincidence frequency for the central layer
in
this case should be about 1811 Hz. The figureindicates reduced transmission losses in this area for the two curves. The coincidence dip for the wallboard is seen mound 2500
Hz.
The thicker a given materid,the
lower the coincidence frequency.The
coincidence effect will be seen in other systems that use thinlayers of concrete. Even so the measured
FSTC
values appear Iow, suggesting that the main reason forthe
poor performance is the presence of flanking transmission.FIG. 4. Sound transmission loss, two 100
mm.
poured concrete core walls, 38 mm fur-ring, resilient channeIs, and 12 mm drywall finish on both sides. Concrete weighed about 1680 kg/m3. A
-
ESTC 46, B-
PSTC 47.The rather unusual construction in Fig. 5 achieved a respectable FSTC rating of 57, show- ing that some care had been taken during the design and construction phase. There is still mom for improvement however. The wood joists are in direct contact with the concrete and there is no sound absorbing material in the cavity below
the
plywood floor. One of the mast serious acoustical p s o b I m with floors is the transmission of footstep and otherthe construction would have become a floating floor and both the impact and airborne
noise transmission would have been significantly reduced. It is better t o prevent the entry
of the impact sound energy into the building structure rather than trying to prevent its
re-radiation at some other place. N o impact tests were made on the floor and with the use
of a carpet on top of the wood floor, the impact sound transmission may not have been bothersome.
In
some cases however, occupants like to have parquet or other hard surfaced floors.In
such cases and in kitchens and bathrooms the use of a floating floor isthe
mosteffective way of reducing impact noise.
FREQUENCY. HZ
125 250 5130 lk 2k 4k FREQUENCY. Hz
FIG.
5. Sound transmission loss, 150 mmFIG.
6. Sound transmission loss, open precast concrete floor with steel U-channels web steel floor joists, 250 mm deep. Con-on the underside supporting 12
mm
wall- crete slabs from 65 to 100nrm
nominal board. 38x
140 mm joists on 400 mm thickness. Metal U-channels wired to bot- centres supporting 16 mm tongued and tom of joists. 12mm
gypsum wallboard grooved plywood floor. 20 ounce carpet on screwed to channels, sealed and painted. underlay on top of floor.Concrete Floor Slabs Supported on Steel Joists
This kind af construction, as it is a double layer with a large air space, should be able to provide very good sound insulation.
But
because the top layer of concrete is usually rather thin, there are reduced transmission losses around the coincidence frequency.The
data presented here are for floors with top slabs ranging in nominal thickness from 65 to 100 mm. The calcrzlated coincidence frequencies for such concrete slabs lie in the rangefrom 250 t o 400
Hz.
Figure 6 shows the mean of eight different floors of this type, plus or minus one standard deviation about the mean.The
expected differences between floors due to differences in the upper layer thickness are not large; the measured differences aremuch greater. For this reason it was considered more useful to present the mean as typical of what one can expect from this type of construction. The minimum FSTC measured was
51 and the m ~ u was m 57. Three of the Boors in the group had glass fibre in the cavity.
This did not seem to make a significant improvement to the FSTC in any of the cases.
This type of floor could
be
improved by increasing the thickness of the top layer of concrete.The
coincidence effect would move to lower frequencies and the transmissian loss would increase because of the increased weight, but the floor would no longer be a lightweight floor, which is one of its attractive features. Another possible improvement that would require raearch to prove its effectiveness, would be to use two layers of concrete on top separated by a layer of glass fibre. This would have the double advantage that impact sound transmission would be reduced and RexuraI waves in the Iayers of concrete wouPd be damped to some extent, thus reducing coincidence effmts. Since the addition of glass fibre in the cavity does not significantly affect the transmission losses, there m a y be too much coupling between the concrete on top and the ceiling layer. This might be remedied by using resilient channels imtead ofthe
rather rigid U channels, which are usually attached by wires in this system. Again, research would determine whether this wouldbe
effective. Walls With Concrete Block CoresWallboard glued to
both
sides. Figure 7 shows results for three 190 mm concrete bIock waIk with 12 mm wallboard gIued to each side.This
method of application can leave anair layer of irregular thickness behind the wallboard, with the result that a mass-air-mass resonance can occur and reduce the sound transmission losses at the frequencies around
400 Hz.[4] The combination of 12 mm wallboard and a;n air layer of about 3 mm would produce a resonance at this frequency.
All
of the walk in Fig. 7 show reduced transmissionlosses in this frequency region. They
would
probably have performed better if they Bad been plastered or painted.The
rn.a.m. resonance willbe
less of a problem if the air space is eliminated or increased enough to move the raonance t o a much lower frequency. Wallboard on f u n k g strips,The
air space between the outer Iayer of wallboard and the block can be increased using furring strips of wood or metal. Figure 8 shows datafor a 190 mm block wall with 12 mm wallboard on 17 x 64 mm wood furring strips on each side. A resonance would
be
expected around 150 Hz and there is indeed a dip inthe
FREQUENCY, Hz REOUENCY, H r
FIG. 7. Sound transmission Ioss, 190
mm
FIG.
8. Sound transmission loss, 190 mmconcrete block walls with 12 mm g y p s u m concrete block wall, 17 x 64 msn wood fur- wallboard cemented to each
side. A
-
ring, 12 mm gypsum board on each side.FSTC 49,
B
-
FSTC 43,C
-
FSTC 45.for the dip at 315
Hz.
The dotted line in this and following figures represents theFSTC
contour fitted to the transmission loss data.131
Figure 9 is for a 140
mm block
wall with 12 mm wallboard on 38 x 3 8 mm wood furring strips.In
this case the resonance is expected at 108 Hz and, as the measmemmts show, the transmission loss curve is dropping rapidly at the low frequencies. The FSTC ratingdoes not take
TL
values below 125Hz
into account, but the rating of 58in
this
case isdetermined by the 8 dB rule in ASTM E413 and the transmission Ioss a t 125
Hz,
which
is in turn influenced by the resonance below 125Hz.
It is not known how important low frequency transmission losses are subjectively, but a
common complaint is that bass notes from stereo systems are too easily heard.
When
adding layers of wallboard to concrete block, poured concrete or angr wall, it therefore
seems prudent to use a combination of heavier wallboard, or multiple layers and a larger
air space so
that
the
resonance frequency is well belowthe
normal measurement limitof
125 Hz. The use of 65 mm steel studs instead of wood furring strips w w l d provide a bigger air space and
the
wallboard would also be decoupled from the concrete blocks.Measurements presented
in
Building Research Note(BRN)
217 141showed
thatthe
ad- dition of glass fibre in the cavity behind the wallboard had a significant beneficial effect throughout most of the frequency range except at the very lowest frequencies. The wall inFig. 10 (with glass fibre batts) does not appear t o
be
any better than that in the previousfigure, st, there was probably some flanking transmission Teaucing the overall performance somewhat. Nevertheless, the FSTC is a quite satisfactory 59.
80 -
'
70 co- .-- 0 V] SO 30 10 125 250 500 Ik 2k 4k FREQUENCY, H r 2 0 -125 250 500 l k 2k 4k FREQUENCY. HzFIG. 9. Sound transmission loss, 140 mm FIG, SO. Sound transmission loss for a concrete block waII, 12 mm wallboard, 190 mm concrete block waI1, 38 x 38 mm
38 x 38 rnm wood strapping on each side. wood strapping plus gIass fibre batts,
13 mm wallboard on each side.
I I I I l f i t l l l l ' ' l - l l i l
125 250 500 I k 2k 4k FREQUENCY, Hz
PIG. 11. Sound transmission 103s for a
FIG.
12. Sound transmission loss for a 190 mm concrete black wall with resilient 190 mfn light concrete block walls, wall-channels, 12 rnm g y p s u m wallboard on each board cemented to one side. The second
side. side had wallboard supported on resilient
Wallboard on resilient channels. Fur 12 mrn wallboard mounted on resilient charmeis appIied directly to a block wall the expected m.a.m. resonance frequency is about 180 Hz.
In
the wall shown in Fig. 11, although the FSTC is 56, the rating is controIled by thefrequencies around this predicted resonance frequency. The FSTC would have been higher
if the wallboard had been further from the wall.
In
BRN
217 some results demonstratedthat
having two layers too close to the concrete block, one on each side (as in the wall in Fig. II), was worse than having one layer tooclose. A comparison of
Fig.
12 and Fig. 11 supports this conclusion. With only one layer of wallboard on resilient channels there is no serious dip in the transmission loss curve around 200Hz
as there was inFig.
11and
the
FSTC is about five points higher. At timesin
building acoustics adding more material c a nlead
to reduced system performance. Theblocks in this case were lightweight blocks and might also have been more porous, giving an efFwtive increase in air space md some absorption in
the
cavity.The wall in Fig. 13 differs from those
in
Fig. 12 only by havingthe
wallboard attached by screws an one side and having a blanket of glass fibre under the wallboard onthe
other- A glass fibre blanket in the cavity is recommended but in this case does not appear tomake any difference to the results; however, these data are not from controlled laboratory experiments and no firm coneEusions should be drawn.
FIG.
13. Sound transmission loss for a FIG. 14.Sound
trrunsmissisn loss for a 190 mm concrete block wall, 12 mnz gyp- 190 nun concrete block wall with 12 mmsum wallboard screwed to one side. The wallboard on one side. Second side has second side
had
a 25 mm glass fibre blan- 38 mm vertical strapping, resilient chm- ket, resilient channels on 600 mm centres nels, 12 mm drywall.and 12 mm gypsum wallboard screwed to
As another warning that flanking paths should always be considered, Fig. 14 shows data for a wall that should have performed at least as well as, if not better than, those just discussed, but did not. This is probably due to flanking transmission along the floor, which was 65 mrn of concrete resting on steel joists. This hypothesis was not confirmed by measurement but is quite likely on theoretical grounds.
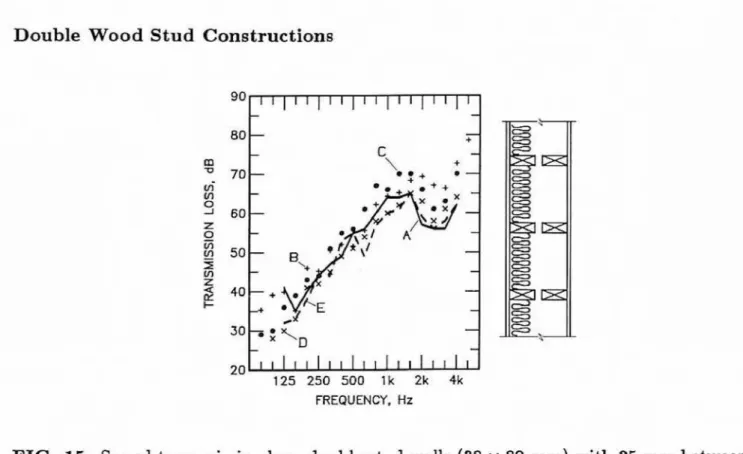
Double Stud
FREQUENCY. Hz
FIG. 15. Sound transmission loss, double stud walls (38 x 89 m) with 25 mm between the sole plates, A
-
65 mm glass fibre in one cavity, 16 mm drywall on both sides for fmiish,FSTC 54.
B,C
-
65 ~llm glass fibre in both cavities, 16 mm drywall on both sides for finish,B
- FSTC 56, C-
FSTC 58,D
- 65 mm glass fibre in both cavities, 13 mm drywall on each side for finish, FSTC 53.E
-
75 mm glass fibre in one cavity, 13 mm drywall on each side, FSTC 53.h
laboratory tests double wood studs give good results because they provide mechanical separation between the Iayers and the air space is larger than for wood stud walls using staggered studs, metal studs, or wood studs and resilient metal channels. Figure 15 shows measurements offive
such wdls in buildings where the FSTC rang- from 53to
58. Thist y p e of wa1I can be improved still further by the addition of extra layers of dxywall on one or both sides.
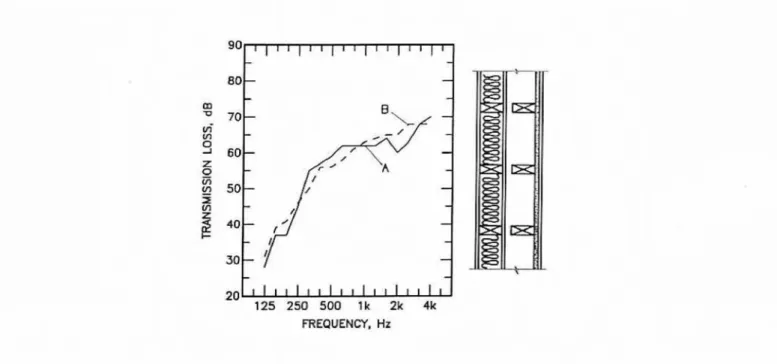
The data in Fig. 16 are in marked contrast with Fig. 15 and indicate severe leakage or flanking in this installation.
No
reason for the poor performance was found but inspection and measurement before tenants move in would prevent such acoustical disasters from being expensive embarrassments.FREQUENCY. Mr FREQUENCY, Hz
FIG. 16. Sound transmission loss, double FIG. 17, Sound transmission loss, dou-
wood stud wall (38 x 90 mm), 25 mfn b e ble walls, each side comprising 38 x 89 mm
tween sole plates. 65 mm of glass fibre in wood studs, 16 nun gypsum on one side,
each side of cavity. 16 mm drywall on each 12 mm wallboard on the other side, 165 mm
side for finish. of glass fibre in the cavity. The walls were
separated by a distance of 25 mm.
Even with the use of double wood studs it is possibIe to produce a
w d l
design thathas
a poor sound transmission loss. Figure 17 gives an example of the misuse of materials.
A number of errors have been made in this waIl design. The attachment of
the
layers of waIlboard directly to both sides of the wood studs means that there is a continuous solid path for vibration; i-e., an acoustical short circuit, through each element of the wall.In
addition, the glass fibre is not fully effective. The xather small air gap between the inner layers of wallboard introduces a resonance between t h e n at a frequency within the range of the measurements. This c a n be seen as the severe dip in the transmission loss curve at 160
Hz,
which
determines the F S T C of 40 for this comtruction because of the 8 dB rufe in ASTM E413.If the interior layers of wallboard
had
been omitted, theFSTC
rating would have been increased with a saving in material.If
the interior layers had been attached on the outside ef the wall, the FSTC would have been increased greatly, ta about 60.Another poor design is shown in Fig. 18. The inclusion of a central Iayer of wallboard attached directly t o the wood studs is an error, for
the
reasons given above.The
FSTCwould have been higher if it had been attached t o one of the outer faces of
the
wall.The
useof the UNoise-stop" board under one layer of the wallboard is not necessary since double studs are being used and it would have been better to use an extra layer of wallboard or more glass fibre In the cavity.
FREQUENCY, Hz
FIG. 18. Sound transmission loss, double sted walls, 38 x 89 mm. One set of studs has wallboard nailed directly to both sides and g l u s fibre in the cavity. The second set of studs has a 12 nun layer of semi-rigid glass fibre "Noise stop" board under another layer of wallboard. A
-
FSTC 52,B
- FSTC 55.STAGGERED WOO13
STUDS
Staggered wood stud walls will not perform quite as well as double woad stud walls far
two reasons. The air space between the layers of wallboard is usually about 50 mm less
and there is better mechanical coupling between the layers, due to the continuous plates at the tap and bottom of the wall. Figure 19 shows the mean of seven measurements (plus or minus one standard deviation) on staggered stud walk with nominally identical constructions, all measured in simiIar1y designed homes. The FSTC for this mean curve (45) is about 5 dB less than would be expected for the same wall in a laboratory. The available data does not make it clear whether this was due to a design flaw causing flanking
to be present in every unit, or to poor installation.
During the measurement serges one wall that had an FSTC rating of 36 was found. This
is another example of what c a n happen if care is not taken all through the construction process from inception to completion. A wall like this will very quickly be detected by the occupants once they have moved
in,
b u t it wouldbe
preferable to have its faults detected by acoustica1 measurements before that happens.One special construction that was examined during this series is ~ h o w n in Fig. 20. Here resilient channels were added to reduce any possible solid transmission of acoustical energy through the structure and to increase the air space slightly. The figure shows a genera1 improvement relative to
Fig.
18 but the FSTC was only two points better.FIG. 19. Sound transmission loss, stag- FIG. 20. Sound transmission loss, stag- gered wood stud walls, 38 x 89 mm. One gered wood stud wall, 38 x 89 mzn. One
Iayer of 16 mm wallboa~d each side, 75 mm layer of 16 mm wallboard on each side. O n glass fibre in cavity. one side the wallboard was mounted on re-
silient metal channels.
FREQUENCY. Hz
FIG.
21. Sound transmission loss, 38 x 89 mm staggered wood stud wall with 38 x I40 mm sole and top plates. 50 mm glass fibre in the cavity. Two layers, 16 and 1 2 mm wallboard on each side.a
125 250 500 I k 2k 4k FREQUENCY. Hz
FIG.
22; Sound transmission Ems, sin- gle wood stud wall, 38 x 89 mm studs on600 mm centres, 1 layer of 16 mm wall-
board nailed to one side and 2 layers t o the other side, Cavity filled with mineral fibre batts.
When the number of layers of wallboard in this type of wall is doubled, the expected increase in FSTC is about 6 . Figure 21 shows data for just such a case and the measured
FSTC is 51, six points better than the mean in Fig. 19.
SINGLE WOOD
STUD
WALLThe wall in Fig. 22 betrays a serious lack of appreciation of the basic factors control- ling sound transmission losses. If resilient metal channels had been used t o attach t h e
wallboard, the FSTC would have been about 10 points higher.
STEEL
STUDWALLS
Only two examples of steel stud walls are presented here. The first (Fig. 23) has only a sin- gle layer of 16 rnm wallboard on each side and achieves an FSTC rating of 49. Laboratory
tests for similar walls show a large range of FSTC values, with typical high values around 50. This type of wall is sometimes limited by the appIication of the 8 dB rule in ASTM E413. The coincidence dip that occurs at 2500 Hz can be very much deeper than shown in this figure and
the
measured transmission losses in this region can entirely determinethe
FSTC rating. The depth of the dip depends on the vibrational damping in the wallboard.
FIG. 23. Sound transmission loss, 90 mm FIG. 24. Sound transmission loss, 90 mm
steel stud wall, one layer of 16 mm wall- steel stud wall, 2 layers of 12 mm wallboard
board OR each side, 65 mm glass fibre insu- on each side, 65 mm of fibrous insulation in
Iation in the cavity. the cavity. There was considerable flanking
transmission through the outside walls on this site.
In another investigation with a wall having two layers of 16 mm wallboard on each side, the FSTC measured initially was 45. This is about 10 dB lower than expected. Inspection
of the data in Fig. 24 shows that the T L curve does not have the expected shape. Further
investigations showed significant flanking transmission along the outer wall of the building, which consisted of only a single layer of wallboard with an air gap behind it and no sound absorbing material in the gap. Some other flanking contributions were identified but the
primary cause of the problem was focussing on the party wall during the design without considering a11 possible flanking paths and how to
deal with
them.WOOD JOIST FLOORS
The
same acoustical principles apply to floors as to walls and it should be easier to gethigh FSTC ratings for Aoors than for walls because the separation between layers is usually much larger. Figure 25 shows another example where the fundamental principles have not been understood and the bottom layer of wallboard has been attached directly to the wood trusses. Resilient metal channels t o support the ceiling would have given a great improvement.
l l l 1 1 j 1 3 1 1 1 1 r 1 1 1 1 ~ 1 125 250 500 I k 2k 4k
FREQUENCY. Hz
F
JG.
25. Sound transmission loss, 430 mrn wood truss floor joist system, I6xnm
chipboardfloor a.nd I6 mm wallboard attached directIy t o the wood trusses. 65 mm glass fibre in
the
cavity.
Figure 26 is included as an example of what can be achieved wen in a single family home. Often an acoustically isolated room is needed so that some musical member of the family
can practice without disturbing everyone else. The construction used here provides a reasonable degree of sound isolation and the sound absorbing tiles control the reverberant
I l l l l l l r l l l l r ' l l l l '
125 250 500 t k 2k 4k
'FREQUENCY. Hz
FIG. 26. Sound transmission loss, 16 rnm plywood floor, 38 x 235 rnm wood joists, 75 mrn
glass fibre in cavity. 16 mm wallboard attached to resilient channels screwed at right angles
to the joists. 12 mm mineral fibre acoustical ceiIing tiles suspended on a 7:-bar system attached by wires to the underside of the wallboard.
FREQUENCY, Hz
FIG. 27. Sound transmission loss, 38 x 235 mm wood joist floor, 38 x 89 mm studs at right angres to it supporting a 16 mm plywood subfloor. Cross braced in places. Wallboard applied directly to the undersides of the 38 x 235 mm joists. A second layer of wallboard was attached to the first using resilient metal channels. A
-
No carpet on floor, FSTC 38.sound within the music room in the basement. In cascs like this, the doors in the home
are often found t o be the weak points and need special care.
The data in Fig. 21 are for a wood joist floor where enough material was used to provide a
fairly decent floor but once again the fundamental rules of goad acoustical partition design were violated.
The
design errors here are the same ones seen in other cases in this note. Attaching a layer of wallboard directly to the joists short circuits the glass fibre and itdoes not provide as much benefit as it should. Having the outer layer of wallboard so close
to the internal one c a n give rise to a deleterious m.a.m. resonance. Thus the construction
as originally designed got an FSTC rating of 38 t o 45 in the three cases measured, not at
all a satisfactory result. In this figure the effect of adding a carpet and underlay to the floor can be seen-improved transmission losses at high frequencies for floors
B
and (7. The first most obvious step to improving this floor is to remove the interior layer of wallboard entirely.The
data shown in Fig. 28 for two floors constructed in this way show an improvement of about fiveFSTC
points over the best of the floors in the previous figure. Figure 29 shows three measurements on floors where an attempt was made to improvethe
sound transmission losses of the originaI design without removing the ceiling.
To
do this alayer of 18 rnm waIIboard was laid on top of the floor. The original faults of the floors still
existed but
the
extra mass helped to: increasethe FSTC
ratings to about 50 in each case.The I a s t set of measurements in thi particular investigation shows
the
effect of adding a layer of 18 mm wallboard on top of the floor when there is no internal layer of wallboard (Fig. 30). This construction follows the general principies outlined for double layer con- struction. TheFSTC
ratings obtained in these two cases are 53 and 54.The
masses ofthe
outer layers in this final construction are about equivalent to three layers of waliboad and the measured FSTC is about what would be expected for a staggered wood stud wall. This
is lower than what would be predicted for the floor, which has a larger air space between
the
outer layers than is normal in a wood stud wall. There was probably some flankingin
the
buildingsbut this
was not investigated as there were more obvious problems to be dealt with.This study provides a chastening example of how the same materials put together in different ways c a n
lead
to large differences inthe
measured sound transmission losses. An understanding ofthe
basic design prhciplea is essential to achieving good sound isolation. UNUSUAL CONSTRUCTIONSMultiple independent wall constructions are not tor, common.
They
offer no practicaladvantages over a well built double wall o r a concrete block wall with finishing layers of wallboard. They are usual$ built with the laudable intent of providing good sound insulation but unfortunately, good intentions are not always enough.
FIG. 28. Sound transmission loss, 38 x 235 mm wood joist floors, 38 x 89 mm studs
at right angles supporting a 16
mm
plywood subfloor. Cross braced in places. A layer of wallboard was attached to the undersides of the joists using resilient metal channels. 75 nun glass fibre in the cavity,Floor
covered with thick underpad and carpet. A - FSTC 49,B
-
FSTC
51.FIG. 29. Sound transmission loss, 38 x 235 mm wood joist floors, 38 x 89
mm
studs at sight angles supporting a 16 mm plywood subfloor, Cross braced in places. 18mm
gypsumcore board laid directly on top of the subfloor. Wallboard applied directly t o the undersides
of
the
joists. 75 rnm glass fibre in the cavity. A second Iayer of wallboard was attached tothe Erst using resilient metal channels. Carpet and undcrpad on floor. A,B
-
FSTC 50,FREQUENCY, Hz
FIG. 30. Sound transmission loss, 38 x 235 mm wood joist floors with 38 x 89 mrn studs
at right angles, supporting a 16 rmn plywood subflour. Cross braced in places- 18 mm wallboard laid on top of the floor. Layer of wallboard attached t o the undersides of the joists using resilient metal channels. 75 mm glass fibre in the cavity. Floor covered with thick underpad and carpet. A - ESTC 54,
B
- FSTC 53,t l r l l l l l l l l l ' l q ' l l
125 250 500 l k 2k 4k
FREQUENCY. Hz
FIG. 31. Sound transmission loss, triple wall with 190 mm concrete
block
core. Theoutside walls were formed from 38 x 89 mm studs, 16 rnm wallboard on each side and
The construction in Fig. 31 gets a very high FSTC for a practical installation but reveals
some ignorance of the fundamentals of building acoustics. The complete wood stud walls on each side contain gIass fibre, which is not as effective as i t might be because of the
solid connection through the wood studs. This wall would have been easier arrd cheaper
to build and more effective if the internal layers of wallboard
had
been omitted. The stud size could aIso have been reduced a little so that the a i ~ gap was less. Nevertheless the final FSTC attained is excellent.It
was not possible to make measurements above 800Hz
because the transmission losses were so high.Sand is accasisnally used in partitions in the belief that it has unusual acoustical properties. The wall in Fig. 32 mvst have been difficult to conatnrct.
The
FSTC is quite high but had the internal plywood and sand been replaced with more glass fibre, and had extra layers ofwallboard been applied on the exterior,
the
sound transmission losses would have been atleast as good if not better. Once again the glass fibre in the cavity is not able to provide full benefit because it is being short circuited by the wallboard layers attached directly to the wood studs. Despite the high FSTC rating for this wall, impact noise was transmitted through the sand in it. Cupboard doors being closed on one side of the wall were clearly audible on the other. It violates the principles of good acoustical design to put a cupboard on a party wall, but the problem would have been less severe if the outer layers of the wall
had
been mechanically isolated from each other.125 250 500 l k 2k 4k FREQUENCY, Hz
FIG. 32.
Sound
transmission loss, 16 mm gypsum walIboard attached directly to one side of 38 x 89 mm wood studs. 12 mm plywood attached directly to the other side.A
second wall the same as the first formed a 75 mm internal cavity, filled with cementitious sand. Outer waII contained 50 mm gIaas fibre batts in the cavity.SUMMARY
Sixty-three tests were performed to obtain the data presented here. The individual mea- surements are presented in Table l. Figure 33 shows the distribution of the FSTC values
for this set of data. The mean value of FSTC measured was 50.7 and the standard devia-
tion was 6.5 dB. Only 13 of the walls had FSTC values less than 45, the value required in
the National Building Code of Canada. Eighteen of the walls with FSTC values less than
50 could have
had
values around 55 with proper care. The provisionOF
FSTC values 10 or even 15 points higher thanNBC
requirements does not require walls that are in any way extreme. It only requires some understanding of rather elementary acoustics gnd attention to detaiI during the design and contruction process. Unfortunately the examples also showthat the basic design principles are often misunderstood, It is hoped that
the
commentary will dispel some of that misunderstanding.FIG. 33. Distribution of
FSTC
values for the 63 partitions measured.The
mean value is 50.7 andthe
standard dwiation is 6.5.To
ensure good sound insulation in projects where a fairly large number ofhomes
are tobe
built, it is safer to measurethe
sound transmission classfor
a representative unit at an ear$ stage.If
the measured data does not meet expectations, skilled advice can usually provide a solution far the problem.TabEe 1. Measured Field Sound 'hamsmission Loseea for d Specimens.
Frequency
Hz kHe
REFERENCES
1. ASTM E597-81. Standard Practice for Determining a Single-Number Rating of Air- borne Sound Isolation for Use in Multiunit Building Specifications. American Society
for Testing and Materials, 1916 Race Street, Philadelphia, PA, 19103.
2. ASTM E336-84. Standard Test Method for Measurement of Airborne Sound Insu- lation in Buildings- American Society for Testing and Materials, 1916 Race Street,
Philadelphia, PA, 19103.
3. ASTM E413-13. Standard Classification for Determination of Sound Transmission Class. American Society for Testing and Materials, 19 16 Race Street, Philadelphia, PA, 19103.
4. Warnock, A. C,C. m d Monk,
D.
W.
Sound Transmission Loss of Masonry Walls: Tests on 90, 140, 190, 240 and 290 mm Concrete Block Walls With Various Surface Fin-ishes. Building Research Note 217, Division of Building Research, National Research Council of Canada, June 1984.