arXiv:0812.3053v1 [nucl-ex] 16 Dec 2008
(will be inserted by the editor)
NA60 results on thermal dimuons
NA60 Collaboration
R. Arnaldi11, K. Banicz4,6, K. Borer1, J. Castor5, B. Chaurand9, W. Chen2, C. Cical`o3, A. Colla11, P. Cortese11,
S. Damjanovic4 a, A. David4,7, A. de Falco3, A. Devaux5, L. Ducroux8, H. En’yo10, J. Fargeix5, A. Ferretti11,
M. Floris3, A. F¨orster4, P. Force5, N. Guettet4,5, A. Guichard8, H. Gulkanian12, J.M. Heuser10, M. Keil4,7,
L. Kluberg9, Z. Li2, C. Louren¸co4, J. Lozano7, F. Manso5, P. Martins4,7, A. Masoni3, A. Neves7, H. Ohnishi10,
C. Oppedisano11, P. Parracho4,7, P. Pillot8, T. Poghosyan12, G. Puddu3, E. Radermacher4, P. Ramalhete4,7,
P. Rosinsky4, E. Scomparin11, J. Seixas7, S. Serci3, R. Shahoyan4,7, P. Sonderegger7, H.J. Specht6, R. Tieulent8,
G. Usai3, R. Veenhof7, and H.K. W¨ohri3,7.
1 Laboratory for High Energy Physics, Bern, Switzerland. 2 BNL, Upton, New York, USA.
3 Universit`a di Cagliari and INFN, Cagliari, Italy. 4 CERN, Geneva, Switzerland.
5 LPC, Universit´e Blaise Pascal and CNRS-IN2P3, Clermont-Ferrand, France. 6 Physikalisches Institut der Universit¨at Heidelberg, Germany.
7 IST-CFTP, Lisbon, Portugal.
8 IPN-Lyon, Univ. Claude Bernard Lyon-I and CNRS-IN2P3, Lyon, France. 9 LLR, Ecole Polytechnique and CNRS-IN2P3, Palaiseau, France.
10 RIKEN, Wako, Saitama, Japan. 11 Universit`a di Torino and INFN, Italy. 12 YerPhI, Yerevan, Armenia.
Received: date / Revised version: date
Abstract. The NA60 experiment at the CERN SPS has measured muon pairs with unprecedented precision in 158A GeV In-In collisions. A strong excess of pairs above the known sources is observed in the whole mass region 0.2<M <2.6 GeV. The mass spectrum for M <1 GeV is consistent with a dominant contribution from π+
π− → ρ → µ+µ− annihilation. The associated ρ spectral function shows a strong broadening,
but essentially no shift in mass. For M >1 GeV, the excess is found to be prompt, not due to enhanced charm production, with pronounced differences to Drell-Yan pairs. The slope parameter Teff associated
with the transverse momentum spectra rises with mass up to the ρ, followed by a sudden decline above. The rise for M <1 GeV is consistent with radial flow of a hadronic emission source. The seeming absence of significant flow for M >1 GeV and its relation to parton-hadron duality is discussed in detail, suggesting a dominantly partonic emission source in this region. A comparison of the data to the present status of theoretical modeling is also contained. The accumulated empirical evidence, including also a Planck-like shape of the mass spectra at low pT and the lack of polarization, is consistent with a global interpretation
of the excess dimuons as thermal radiation. We conclude with first results on ω in-medium effects. PACS. 25.75.-q Relativistic heavy-ion collisions – 12.38.Mh Quark-gluon plasma – 13.85.Qk Lepton Pairs
1 Introduction
Dileptons are particularly attractive to study the hot and dense QCD matter formed in high-energy nuclear colli-sions. In contrast to hadrons, they directly probe the en-tire space-time evolution of the expanding system, escap-ing freely without final-state interactions. At low masses M <1 GeV (LMR), thermal dilepton production is medi-ated by the broad vector meson ρ (770) in the hadronic
a Corresponding author: [email protected]
phase. Due to its strong coupling to the ππ channel and the short life time of only 1.3 fm/c, “in-medium” modi-fications of its mass and width close to the QCD phase boundary have since long been considered as the prime signature for chiral symmetry restoration [1,2,3]. At inter-mediate masses M >1 GeV (IMR), it has been controver-sial up to today whether thermal dileptons are dominantly produced in the earlier partonic or in the hadronic phase, based here on hadronic processes other than ππ annihi-lation. Originally, thermal emission from the early phase was considered as a prime probe of deconfinement [4,5].
0 0.2 0.4 0.6 0.8 1 1.2 1.4 0 10000 20000 30000 No centrality selection In-In NA60 M (GeV) dN/dM per 20 MeV T all p γµ µ →η µµ →ω µµ→φ 0 π µ µ → ω µ µ → η γ µ µ → ’ η
Fig. 1. Background-subtracted mass spectrum before (dots) and after subtraction of the known decay sources (triangles).
Experimentally, it took more than a decade to mas-ter the challenges of very rare signals and enormous com-binatorial backgrounds. The first clear signs of an ex-cess of dileptons above the known decay sources at SPS energies were obtained by CERES [6,7] for M <1 GeV, NA38/NA50 [8] for M >1 GeV and by HELIOS-3 [9] for both mass regions (see [10] for a short recent review in-cluding the preceding pp era and the theoretical mile-stones). The sole existence of an excess gave a strong boost to theory, with hundreds of publications. In the LMR region, ππ annihilation with regeneration and strong in-medium modifications of the intermediate ρ during the fireball expansion emerged as the dominant source. How-ever, the data quality in terms of statistics and mass res-olution remained largely insufficient for a precise assess-ment for the in-medium spectral properties of the ρ. In the IMR region, thermal sources or enhanced charm pro-duction could account for the excess equally well, but that ambiguity could not be resolved, nor could the nature of the thermal sources be clarified.
A big step forward in technology, leading to completely new standards of the data quality in this field, has re-cently been achieved by NA60, a third-generation exper-iment built specifically to follow up the open issues ad-dressed above [11]. Initial results on mass and transverse momentum spectra of the excess dimuons have already been published [11,12,13], supplemented by recent results on acceptance-corrected mass spectra and polarization [14]. This paper takes a broader view on the results, discussing in some detail the observed M -pT correlations, the
con-nection to hadron-parton duality, and the present status of theoretical modeling. Certain aspects of the pT spectra,
of centrality dependencies and evidence for ω in-medium effects are reported here for the first time.
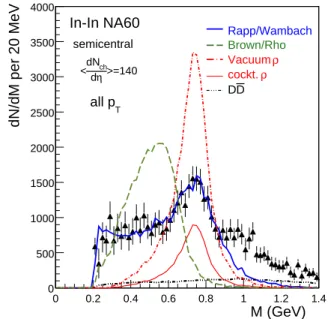
0 0.2 0.4 0.6 0.8 1 1.2 1.4 0 500 1000 1500 2000 2500 3000 3500 4000 In-In NA60 semicentral T all p dN/dM per 20 MeV M (GeV) Rapp/Wambach Brown/Rho ρ Vacuum ρ cockt. D D >=140 η d ch dN <
Fig. 2. Excess dimuons compared to theoretical predic-tions [16], renormalized to the data in the mass interval M <0.9 GeV. No acceptance correction applied.
2 Mass spectra and the ρ spectral function
Fig. 1 shows the centrality-integrated net dimuon mass spectrum for 158A GeV In-In collisions in the LMR re-gion. The narrow vector mesons ω and φ are completely resolved; the mass resolution at the ω is 20 MeV. The peripheral data can be completely described by the elec-tromagnetic decays of neutral mesons [12,15]. This is not true for the more central data as plotted in Fig. 1, due to the existence of a strong excess of pairs. The high data quality of NA60 allows to isolate this excess with a priori unknown characteristics without any fits: the cocktail of the decay sources is subtracted from the total data using localcriteria, which are solely based on the mass distribu-tion itself. The ρ is not subtracted. The excess resulting from this difference formation is illustrated in the same fig-ure (see [12,13,15] for details and error discussion). The subtracted data for the η, ω and φ themselves are subject to the same further steps as the excess data and are used later for comparison.
The common features of the excess mass spectra can be recognized in Fig. 2. A peaked structure is always seen, residing on a broad continuum with a yield strongly in-creasing with centrality (see Fig. 9 below), but remain-ing essentially centered around the nominal ρ pole [15]. Without any acceptance correction and pT selection, the
data can directly be interpreted as the space-time averaged spectral function of the ρ, due to a fortuitous cancellation of the mass and pT dependence of the acceptance filtering
by the phase space factors associated with thermal dilep-ton emission [15]. The two main theoretical scenarios for the in-medium spectral properties of the ρ, broadening [2] and dropping mass [3], are shown for comparison, both evaluated for the same fireball evolution [16]. Since
agree-0 0.2 0.4 0.6 0.8 1 1.2 1.4 0 500 1000 1500 2000 2500 3000 3500 In-In NA60 /d >=140η ch <dN T all p
dN/dM per 20 MeV
M (GeV)
ρ in-med QGP D D mix π 4 sum ) φ + ω sum+in-med( Hees/Rapp 0 0.2 0.4 0.6 0.8 1 1.2 1.4 0 500 1000 1500 2000 2500 3000 3500 In-In NA60 /d >=140η ch <dN T all pdN/dM per 20 MeV
M (GeV)
Renk/Ruppert sum D D ω + ρ in-medium (Eletsky et al.) ρ vacuum QGPFig. 3. Excess dimuons for semicentral collisions compared to the theoretical model results by Hees/Rapp [18] (left) and Renk/Ruppert et al. [19] (right). No acceptance correction applied.
ment between modeling and data would imply agreement both in shape and yield, the model results are normal-ized to the data in the mass interval M < 0.9 GeV, just to be independent of the uncertainties of the fireball evo-lution. The unmodified ρ, also shown in Fig. 2 (vacuum ρ), is clearly ruled out. The broadening scenario indeed gets close, while the dropping mass scenario in the version which described the CERES data reasonably well [2,3,6] completely fails for the much more precise NA60 data. A strong reduction of in-medium VMD as proposed by the vector manifestation of chiral symmetry [17] would make hadron spectral functions in hot and dense mat-ter altogether unobservable, but central aspects of this scenario are totally unclear, and quantitative predictions which could be confronted with data have not become available up to today.
A comparison of the same excess mass spectrum to two more recent theoretical developments, covering now both the LMR and the initial part of the IMR region, is contained in Fig. 3. In contrast to Fig. 2, the theoretical re-sults are not renormalized here, but shown on an absolute scale. In the ρ-like region with π+π−→ρ → µ+µ− as the
dominant source, Hees/Rapp [18] use the original many-body scenario with a ρ spectral function strongly broad-ened by baryonic interactions [2], while Renk/Ruppert’s results [19] are based on the spectral function of Eletsky et al. [20] where the broadening effects from baryons are somewhat weaker; that difference is directly visible in the low-mass tails of the theoretical mass spectra. The overall agreement between the data and the two theoretical sce-narios is quite satisfactory in this region, also in absolute terms.
3 Mass spectra and parton-hadron duality
Moving up into the IMR region M >1 GeV, 2π processes become negligible, and other hadronic processes like 4π
(including vector-axialvector mixing in case of [18]) and partonic processes like quark-antiquark annihilation q ¯q → µ+µ− take over. The two theoretical scenarios in Fig. 3
also describe this part. However, there is a very interesting and instructive difference between them. While the total yield of the data for M >1 GeV is described about equally well, the fraction of partonic processes relative to the total is small in [18] where a first-order phase transition is used, and dominant in [19] which uses a cross-over phase tran-sition. This feature is often referred to as “parton-hadron duality” and formed the basis of the successful descrip-tion of the NA50 dimuon enhancement in the IMR region in terms of thermal radiation [21]. Here, the individual sources were not even specified.
Caution should, however, be expressed as to the use of the term “duality” in this context. Parton-hadron du-ality is a statement on dilepton emission rates, dating back to the time-reversed process of hadron production in e+e− collisions. It implies that the emission rates
us-ing either partonic (pQCD) or hadronic degrees of free-dom merge together, i.e. become “dual”, if the system approaches deconfinement and chiral restoration. The va-lidity of duality down to masses of 1 GeV, mainly due to vector-axialvector mixing, was first shown by Li and Gale [22] (see also [2]). However, experiments measure yields, i.e. rates integrated over space-time. Duality in the yields is not obvious and becomes questionable, if the space-time trajectories are different for genuine partonic and hadronic processes. Such a difference automatically appears through the elementary assumption that partonic processes only act “early”, i.e. from Ti until Tc, while
hadronic processes (like nπ) only act “late”, i.e. from Tcto
thermal freeze-out Tf. If theoretical scenarios are different
in their trajectories (both as to partonic and to hadronic processes), the integrated total yields will, in general, be different. Since the scenarios of [18] and [19] in Fig. 3 are indeed very different (see above), the seemingly
equiva-lent description of the data cannot be traced to duality, but must be due to internal parameter choices.
Explicit insight beyond duality, be it real or fortu-itous, can be obtained experimentally in the following way (see [5] and in particular [23]). In contrast to real photons, virtual photons decaying into lepton pairs are character-ized by two variables, mass M and transverse momen-tum pT. Historically, the interest has largely focused on
mass because of its rich and often structured information content, including now the ρ spectral function discussed above. Transverse momentum, on the other hand, contains not only contributions from the spectral function(s), but encodes the key properties of the expanding fireball, tem-perature and, in particular, transverse (radial) flow. The latter causes a blue shift of pT, analogous to the case of
hadrons. In contrast to hadrons, however, which always receive the full asymptotic flow reached at the moment of decoupling from the flowing medium, lepton pairs are con-tinuously emitted during the evolution, reflecting a space-time folding over the temperature-flow history in their fi-nal pT spectra. Since flow builds up monotonically during
the evolution, being small in the early partonic phase (at SPS energies, due to the “soft point” in the equation-of-state), and increasingly larger in the late hadronic phase, the final pT spectra keep memory on the time ordering of
the different dilepton sources, mirrored in a characteristic mass dependence of thepT spectra. We shall come back to
this point below.
4 Acceptance-corrected mass and p
Tspectra
Quantitative insight into the physical meaning of the ex-cess dileptons requires a full correction of the data for geometrical acceptance and pair efficiencies of the NA60 apparatus, including the effects of the trigger system. Re-sults from Monte Carlo simulations of the acceptance are contained in [13,24], showing significant variations and in particular a strong decrease at low mass and low pT. In
principle, the correction requires a 4-dimensional grid in the space of M -pT-y-cosθCS(where θCSis the polar angle
of the muons in the Collins Soper frame). To avoid large statistical errors in low-acceptance bins, it is performed instead in 2-dimensional M -pT space, using the measured
y and cosθ distributions as an input. The latter are, in turn, obtained with acceptance corrections determined in an iterative way from MC simulations matched to the data in M and pT. The y-distribution is found to have the same
rapidity width as dNch/dη, σy ∼1.5 [24]. The cosθCS
dis-tributions for two mass windows of the excess and the ω are contained in [14]. Within errors, they are found to be uniform, implying the polarization of the excess dimuons to be zero, in contrast to Drell-Yan and consistent with the expectations for thermal radiation from a randomized system.
The outcome for the two major variables M and pT
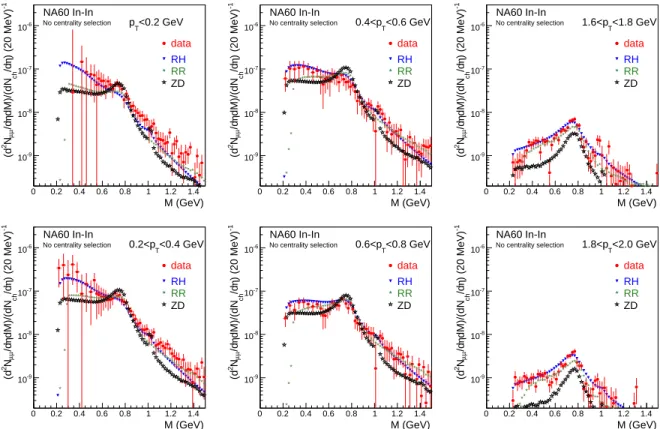
is first discussed separately for the LMR and the IMR regions. Fig. 4 shows a set of mass spectra for some se-lected slices in pT to illustrate the evolution from low to
high pT (a pT-integrated mass spectrum over the whole
mass region is contained in [11]). The spectra are normal-ized to dNch/dη in absolute terms, using the same
proce-dure as described in detail for the φ in [25] and relating Npart≃dNch/dη at η=2.9 as measured to within 10% by
the Si pixel telescope. Recent theoretical results on ther-mal radiation from three major groups working in the field are included for comparison [18,19,23,26,27], calculated absolutely (not normalized to the data). Results from a fourth one [28] only cover the 2π region and are not yet available in pT-differential form. The general agreement
between data and model results both as to spectral shapes and to absolute yields is most remarkable, supporting the term “thermal” used throughout this paper.
At very low pT, a strong rise towards low masses is
seen in the data, reflecting the Boltzmann factor, i.e. the Plank-like radiation associated with a very broad, nearly flat spectral function. Only the Hees/Rapp scenario [26] is able to describe this part quantitatively, due to their particularly large contribution from baryonic interactions to the low-mass tail of the ρ spectral function (as in [28]). This was already mentioned in connection with Fig. 3, but is much more clearly visible at low pT than without any
pT selection. At higher pT, the influence of radial flow
in-creasingly changes the spectral shapes, and at very high pT all spectra appear ρ-like. However, sizable differences
between the different theoretical scenarios also exist in this region. For example, Hees/Rapp [26] use a hard-scattering ρ which contributes to fill up the ρ region beyond the Cooper-Frye freeze-out ρ. They also use an extrapola-tion of the Drell-Yan process down to the photon point (M →0). While this contribution is small for the whole LMR region without pT selection, the low-mass/high-pT
part is in their case completely dominated by DY. The size of radial flow, the major issue here, also varies be-tween the three groups. It is recognizably too low in the hydrodynamics scenario [27], and maximal for the fireball scenario of [19,23] tailored to the NA60 hadron data.
Fig. 5 (left) shows the centrality-integrated mT
spec-tra, where mT=(p2T+ M
2)1/2, for four mass windows; the
φ is included for comparison. The ordinate is absolutely normalized to dNch/dη as in Fig. 4. Apart from a
pe-culiar rise at low mT (<0.2 GeV) for the excess spectra
(not the φ) which only disappears for very peripheral col-lisions [10,13], all spectra are pure exponentials. The rise is outside of any systematic errors as discussed in [13]. The relative yield associated with it is about 10-20%, roughly independent of mass, which excludes a connection to the low pT rise seen in pion pT spectra. The absolute
yield steeply decreases with mass, reminiscent of Dalitz de-cays. However, a consistent physical interpretation is still open. The lines in the exponential region are fits to the data with the function 1/mTdN/dmT ∝exp(−mT/Teff),
where the effective temperature parameter Teff is the
in-verse slope of the distributions. For the excess data, the fits are restricted to the range 0.4<pT<1.8 GeV (roughly
0.1<mT−M <1.2 GeV) to exclude the increased rise at low
mT. Obviously, the slopes depend on mass. Fig. 5 (right)
shows a more detailed view into the ρ-like mass window, exploiting the same side-window method as used in
con-0 0.2 0.4 0.6 0.8 1 1.2 1.4 -9 10 -8 10 -7 10 -6 10 Mass_AccCorr_AllNch_pt02 Entries -683 Mean 0.4807 RMS 0.189 RR_mass_pt02 Entries 765021 Mean 0.5664 RMS 0.2044 ZD_mass_pt02 Entries 994258 Mean 0.56 RMS 0.207 <0.2 GeV T p M (GeV) -1 ) (20 MeV) η /d ch dM)/(dN η /d µµ N 2 (d RH RR ZD data NA60 In-In No centrality selection h_RH_TotPlusOmegaT_0pt02 0 0.2 0.4 0.6 0.8 1 1.2 1.4 -9 10 -8 10 -7 10 -6 10 Mass_AccCorr_AllNch_04pt06 Entries 105 Mean 0.52 RMS 0.2246 <0.6 GeV T 0.4<p M (GeV) -1 ) (20 MeV) η /d ch dM)/(dN η /d µµ N 2 (d RH RR ZD data NA60 In-In No centrality selection h_RH_TotPlusOmegaT_04pt06 0 0.2 0.4 0.6 0.8 1 1.2 1.4 -9 10 -8 10 -7 10 -6 10 1.6<pT<1.8 GeV M (GeV) -1 ) (20 MeV) η /d ch dM)/(dN η /d µµ N 2 (d RH RR ZD data NA60 In-In No centrality selection h_RH_TotPlusOmegaT_16pt18 0 0.2 0.4 0.6 0.8 1 1.2 1.4 -9 10 -8 10 -7 10 -6 10 Mass_AccCorr_AllNch_02pt04 Entries -983 Mean 0.431 RMS 0.2064 <0.4 GeV T 0.2<p M (GeV) -1 ) (20 MeV) η /d ch dM)/(dN η /dµµ N 2 (d RH RR ZD data NA60 In-In No centrality selection h_RH_TotPlusOmegaT_02pt04 0 0.2 0.4 0.6 0.8 1 1.2 1.4 -9 10 -8 10 -7 10 -6 10 Mass_AccCorr_AllNch_06pt08 Entries -1285 Mean 0.5801 RMS 0.2327 <0.8 GeV T 0.6<p M (GeV) -1 ) (20 MeV) η /d ch dM)/(dN η /dµµ N 2 (d RH RR ZD data NA60 In-In No centrality selection h_RH_TotPlusOmegaT_06pt08 0 0.2 0.4 0.6 0.8 1 1.2 1.4 -9 10 -8 10 -7 10 -6 10 1.8<pT<2.0 GeV M (GeV) -1 ) (20 MeV) η /d ch dM)/(dN η /dµµ N 2 (d RH RR ZD data NA60 In-In No centrality selection h_RH_TotPlusOmegaT_18pt20
Fig. 4.Acceptance-corrected mass spectra of the excess dimuons in selected slices of pT. Absolute normalization as in Fig. 4.
The theoretical scenarios are labeled according to the authors HR [26], RR [23], and ZD [27]. In case of [26], the EoS-B+option
is used, leading to a partonic fraction of about 65% in the IMR (different from the left part of Fig. 3).
nection with Fig. 9 below, to determine the pT spectra
separately for the ρ peak and the underlying continuum. All spectra are purely exponential up to the cut-off at pT=3 GeV, without any signs of an upward bend
charac-teristic for the onset of hard processes. Their slopes are, however, quite different (see below).
The central NA60 results in the IMR region [11] are shown in Fig. 6. The use of the Si-vertex tracker allows to measure the offset between the muon tracks and the main interaction vertex and thereby to disentangle prompt and offset dimuons from D decays. The offset distribution is found to be perfectly consistent with no charm enhance-ment, expressed by a fraction of 1.16 ± 0.16 of the level ex-pected from upscaling the NA50 results on the IMR in p-A collisions [11]. The observed excess is really prompt, with an enhancement over Drell-Yan by a factor of 2.4±0.08. The excess can now be isolated in the same way as was done in the LMR region, subtracting the measured known sources, here DY and open charm, from the total data. Fig. 6 shows the decomposition of the total into DY, open charm and the prompt excess. The mass spectrum of the excess is quite similar to the shape of open charm and much steeper than DY; this explains of course why NA50 could describe the excess as enhanced open charm [8].
The transverse momentum spectra are also much steep-er than DY. Moreovsteep-er, the spectra depend on mass and do not show the factorization between mass and pT
char-acteristic for DY, where a common Gaussian distribution with a fixed sigma kT=0.8 GeV describes all pT
spec-tra independent of mass. The spec-transverse mass specspec-tra are shown in Fig. 7 for three consecutive mass windows. All spectra are essentially exponential. However, the steep-ening observed at very low mT in the lowest mass
win-dow, seen already before for all masses in Fig. 5 including this window, seems to be switched-off in the upper two mass windows. As in Fig. 5, the lines are exponential fits to the data, restricted again to pT≥0.5 GeV to exclude
the rise at low mT. The extracted inverse slope
parame-ters are 199±21(stat)±3(syst), 193±16±2 and 171±21±3 MeV, respectively, i.e. about the same within the (rather large) errors.
The inverse slope parameters Teff extracted from the
exponential fits to the mT spectra are plotted in the left
panel of Fig. 8 vs. dimuon mass, unifying the data from the LMR and IMR regions. In the LMR part, a finer bin-ning is used than in Fig. 5, and the coarser-binned data (contained in [13]) are left out for clarity. For M<1 GeV, a correction for Drell-Yan pairs is not done, due to their small contribution [13] and the intrinsic uncertainties at low masses [26]. In the extended LMR analysis up to 1.4 GeV, the 2 (square) points are corrected, as are all points of the IMR analysis (see above). In the region of overlap, the data are not statistically independent. The hadron data for η, ω and φ obtained as a by-product of the
cock-0 0.2 0.4 0.6 0.8 1 1.2 1.4 1.6 1.8 -8 10 -7 10 -6 10 -5 10 -4 10 -3 10
)
-2) (GeV
η
/d
ch)/(dN
Tdm
η
/d
µµ(dN
T1/m
0.2<M<0.4 GeV 0.4<M<0.6 GeV 0.6<M<0.9 GeVφ
1.0<M<1.4 GeV >30 η /d ch dN 3) × ( 6) × (-M (GeV)
Tm
NA60 In-In
0 0.5 1 1.5 2 2.5 -9 10 -8 10 -7 10 -6 10 -5 10-M (GeV)
Tm
>30 η /d ch dNNA60 In-In
)
-2) (GeV
η
/d
ch)/(dN
Tdm
η
/d
µµ(dN
T1/m
0.6<M<0.9 GeV full region peak ρ continuum 2 MeV ± =253 eff T 6 MeV ± =295 eff T 4 MeV ± =225 eff TFig. 5. Acceptance-corrected transverse mass spectra of the excess dimuons for 4 mass windows and the φ [13] (left), and a decomposition into peak and continuum for the ρ-like window (right, see text). Open charm is subtracted throughout. The normalization in absolute terms is independent of rapidity over the region measured. For error discussion see [13].
tail subtraction procedure are also included in Fig. 8, as is the single value for the ρ-peak from the right panel of Fig. 5. Interpreting the latter as the freeze-out ρ without in-medium effects, consistent with all present theoretical modeling [18,19,23,26,27], all four hadron values together with preliminary π−data from NA60 can be subjected to
1.2 1.4 1.6 1.8 2 2.2 2.4 3 10 4 10 5 10 Drell-Yan Open charm Excess 6500a6500aMD_6500a_PM_Pt000_250_Mlt_0_220 NA60 In-In dN/dM (a.u.) M (GeV)
Fig. 6. Acceptance-corrected mass spectra of all three contri-butions to the IMR spectrum: Drell-Yan, open charm and the excess (triangles). The data are integrated over centrality.
a simple blast wave analysis [14]. This results in a reason-able set of freeze-out parameters of the fireball evolution and suggests the following consistent interpretation for the hadron and dimuon data together. Maximal radial flow is reached by the ρ, due to its maximal coupling to pions, while all other hadrons follow some hierarchy in earlier
/ ndf 2 χ 7.999 / -2 Constant 12.1 ± 0.2 Slope -5.231 ± 0.404 0 0.2 0.4 0.6 0.8 1 1.2 1.4 10 2 10 3 10 4 10 5 10 / ndf 2 χ 7.999 / -2 Constant 12.1 ± 0.2 Slope -5.231 ± 0.404
totsuma6ExcessCorrinMT_M1160_1400_forpr__dykt08_ACM4000_mtchi30 NA60 In-In
1.16<M<1.4 GeV 2.00<M<2.56 GeV 1.40<M<2.00 GeV (a.u.)T dN/dmT 1/m -M (GeV) T m
Fig. 7. Acceptance-corrected transverse mass spectra of the excess dimuons for three mass windows. The data are inte-grated over centrality. For error discussion see [11].
0 0.5 1 1.5 2 2.5 100 150 200 250 300 350
(MeV)
effT
M (GeV)
) φ , ω , ρ , η hadrons ( dimuons LMR LMR, w/o DY IMR, w/o DYIn-In
>30 η /d ch dN 0 0.5 1 1.5 2 2.5 100 150 200 250 300 350(MeV)
effT
M (GeV)
) φ , ω , ρ , η hadrons ( dimuons LMR in-medium LMR, w/o DY IMR, w/o DYIn-In
>30 η /d ch dNFig. 8. Left: Inverse slope parameter Teff vs. dimuon mass for the combined LMR/IMR regions of the excess in comparison
to hadrons [13]. Right: Inverse slope parameters Teff for the “pure” in-medium part, obtained by subtraction of the ρ-peak
contribution from the total before the fits are done (see text). Open charm is subtracted throughout. Errors in the LMR part are purely statistical; the systematic errors are mostly smaller than the statistical ones [13]. Errors in the IMR part are total errors [11].
freeze-out. The Teff values of the dimuon excess rise nearly
linearly with mass up to the pole position of the ρ, but stay always well below the ρ line, completely consistent with the expectations for radial flow of an in-medium hadron-like source (here π+π− → ρ) decaying continuously into
lepton pairs.
This picture can still be refined. By modeling a ρ with the proper spectral shape and the mT spectrum as
mea-sured, its contribution can be subtracted from the total measured distribution in the full M -mT plane with the
same side-window method as used for Fig. 9 below and described in [15]. The difference, essentially a continuum, is then refit, resulting in Teff values for the “pure”
in-medium(continuum) part in the 2π region. The modified plot is shown in the right panel of Fig. 8. The appearance is striking: all values are lower, but mostly so in the bin associated with the ρ pole (by ∼20 MeV). This makes the shape even more sawtooth-like than before, and within errors the rise continues now up to about 1 GeV.
Beyond the 2π region, the Teff values of the excess
dimuons show a sudden decline by about 50 MeV down to the IMR values. This decline is even more abrupt in the right panel of Fig. 8 than in the left and obviously connected to the in-medium emission itself, not to any pe-culiarities associated with the ρ peak. Extrapolating the lower-mass trend set by a hadron-like source to beyond 1 GeV, such a fast transition is extremely hard to reconcile with emission sources which continue to be of dominantly hadronic origin in this region. A much more natural ex-planation would be a transition to a dominantly early, i.e. partonic emission source with processes like q ¯q → µ+µ−,
for which flow has not yet built up [19,23]. In this sense,
the present analysis may well represent the first data-based evidence for thermal radiation of partonic origin in nuclear collisions, overcoming parton-hadron duality in the yield description on the basis of M -pT correlations as
discussed in section 3.
Theoretically, the extension of the unified LMR and IMR results over the complete M -pT plane places severe
constraints on the dynamical trajectories of the fireball evolution. Indeed all present scenarios [18,19,23,26,27] do not any longer rely on parton-hadron duality in the rates as in [21], but explicitly differentiate between hadronic (mostly 4π) and partonic contributions in the IMR as al-ready discussed in connection with Fig. 3. The partonic fraction presently ranges from 0.65 for [26] (option EoS-B+ as used in Fig. 4) to “dominant” in [19,23,27]. The
exponential shape of the experimental mT spectra is
re-produced by the models, consistent with the expectations for thermal radiation. However, due to remaining uncer-tainties in the equation-of-state, in the fireball evolution and in the role of hard processes [26], a quantitative de-scription of the much more sensitive mT-derivative Teff
vs. M in Fig. 8 is only slowly emerging. In particular, the more recent results from the authors of [19,23,27], while very encouraging in the description of the down-ward jump, are still preliminary and have not yet been formally published in their final form. A systematic com-parison of several model results to the data in Fig. 8 is therefore presently not possible.
50 100 150 200 250 0 1 2 3 4 5 6 7 8 9 10 η /d ch dN Yield ratios continuum/ρ
ρ excess/ ρ peak/ =1.0 ω / ρ 0.2<M<1.0 GeV NA60 In-In
Fig. 9. Excess yield ratios for peak, continuum and total vs. centrality for the mass window 0.2<M <1 GeV. Open charm is subtracted throughout. No acceptance correction applied.
5 Centrality dependencies
All data presented so far correspond either to (nearly) minimum bias, selecting dNch/dη>30, or to the
semicen-tral window, selecting 110<dNch/dη<170; the results for
the two conditions are very close. However, an enormous amount of information exists on the centrality dependence of practically every variable discussed in this paper. We select two topics of particular relevance here.
The first one concerns the evolution of the shape of the excess mass spectra, following Figs. 2 and 3. In [15], we have used both an rms analysis and a more sensitive side-window method to determine separately the yields of the peak and the underlying continuum. The centrality depen-dence from the latter is shown in Fig. 9: peak, continuum and total excess yield in the mass interval 0.2<M <1.0 GeV, all normalized to the (fictitious) cocktail ρ with the assumption ρ/ω=1 (like in pp). The ω itself is directly measured, and its yield is found to be proportional to dNch/dη. The continuum and the total show a very strong
increase, starting already in the peripheral region, while the peak slowly decreases from >1 to <1. Recalling that Fig. 9 is based on the excess mass spectra before accep-tance correction like in Fig. 3, roughly representing the full ρ spectral function, the excess/ρ ratio can directly be interpreted as the number of ρ generations created by for-mation and decay during the fireball evolution, including freeze-out: the “ρ clock”, frequently discussed in the past. It reaches up to about 6 generations for central In-In col-lisions; selecting low pT this number doubles.
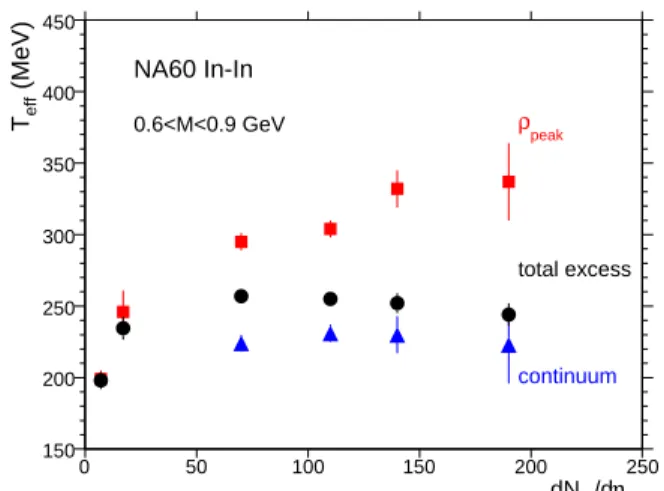
The second topic concerns the centrality dependence of the slope parameter Teff for the excess data in the ρ-like
window 0.6<M <0.9 GeV, following Fig. 4 (right). Based as before on the side-window method [15], the results are shown in Fig. 10, separately for the ρ peak, the contin-uum and the total excess. The peak is seen to show a very strong rise, with hardly any saturation. However, the errors in the more central data become quite large, reflect-ing the continuously decreasreflect-ing peak/total ratio as visible
0 50 100 150 200 250 150 200 250 300 350 400 450 η /d ch dN (MeV) eff T ρpeak continuum total excess NA60 In-In 0.6<M<0.9 GeV
Fig. 10. Inverse slope parameter Teff vs. centrality for
con-tinuum, peak and total in the mass window 0.6<M <0.9 GeV (see also 4, right). Open charm is subtracted throughout.
in Fig. 9. Conversely, continuum and total yield saturate much earlier.
The large gap in Teff between the peak and the
con-tinuum, seen already in Fig. 7, has a much-debated in-teresting physics origin. The pT spectrum of a thermal
in-medium source is softer by a Lorentz factor M/E=1/γ compared to that of a freely decaying freeze-out ρ [26]. On top, the in-medium values of Teffrepresent a
temperature-flow average, while the freeze-out ρ receives the maximal flow. These two effects contribute about equally to the to-tal. The size of the gap ultimately reaches 70-100 MeV, but closes towards peripheral collisions. The ω, with the same mass as the ρ, also shows a large gap to the ρ (com-pare Fig. 11), which also closes finally to zero for the lowest pp-like window [13].
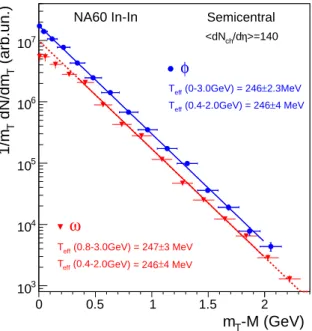
6 Evidence for ω in-medium modifications
While most of the historical discussion on light-flavor vec-tor mesons in hot and dense matter has concentrated on the short-lived ρ (cτ = 1.3 fm), the longer-lived ω (23 fm) and φ (46 fm) have received much less attention, since most of their dilepton decays occur after thermal freeze-out. Within the NA50 LMR analysis, the ω and φ have in-deed consistently been treated as ”cocktail” particles and subtracted from the total (compare Fig. 1). However, in-medium effects are expected for the (small) decay frac-tion inside the fireball, and these are actually contained in the Hees/Rapp scenario (see [26] and earlier references in there).
NA60 has addressed the ω in a way directly coupled to the cocktail subtraction procedure. Due to the high mass resolution, the disappearance of the yield at low pT out
of the narrow ω peak in the nominal pole position can sensitively be detected. The appearance of the yield else-where in the mass spectrum, originating from a mass shift, or broadening or both, is practically unmeasurable, due to the masking of the whole region by the much stronger
0 0.5 1 1.5 2 3 10 4 10 5 10 6 10 7 10 p0 9.918e+06 p1 p0 9.918e+06 p1 -M (GeV) T m Semicentral >=140 η /d ch <dN NA60 In-In (arb.un.) T dN/dm T 1/m
φ
ω
2.3MeV ± (0-3.0GeV) = 246 eff T 4 MeV ± (0.4-2.0GeV) = 246 eff T 3 MeV ± (0.8-3.0GeV) = 247 eff T 4 MeV ± (0.4-2.0GeV) = 246 eff TFig. 11. Acceptance-corrected transverse mass spectra of the ωand the φ for the semicentral bin. The Teff values correspond
to different fit ranges for the two particles. A depletion of the ω yield at low mTrelative to the fit line can clearly be recognized.
ππ → ρ process, regenerating the ρ. Sensitive experiments on ω in-medium effects with clear clues as to their char-acteristics can therefore only be done in cold nuclear mat-ter experiments [29], where ρ/ω = 1, but not in ultra-relativistic nuclear collisions. The evidence for the disap-pearance of ω’s in the low mT region is shown in Fig. 11.
As already mentioned in section 2, the ω and φ are obtained as a byproduct of the cocktail subtraction proce-dure. The data are fit with the usual mT exponential used
before in Figs. 4 and 6. With respect to this reference line, there is hardly any anomaly visible for the φ, but quite some loss for low-pT ω’s. The loss can be quantified with
respect to the reference line, extrapolating down to zero. The fit parameters Tefffor two different fit regions both for
the ω and the φ show the definition of the reference line to be quite uncritical. Forming the ratio data/reference line takes care of that part of radial flow which does not seriously affect the exponential slope.
The results are shown in Fig. 12, absolutely normal-ized as the full phase space ratio ω/Npart. The effects of
ω disappearance are quite striking: (i) a suppression of the relative yield below the reference line only occurs for pT ≤1 GeV; (ii) there is a very strong centrality
depen-dence of the suppression, reaching down to ≤ 0.5 of the reference line (the errors become huge for the central win-dow, because the ω can then hardly be recognized on top of the ππ processes at low mT); (iii) the suppression effects
are much larger than expected for the spectral distortions due to the blue shift from radial flow at low mT; a
sim-ulation in the basis of the blast wave parameters from [14] shows at most 10% effects for central collisions. The-oretical simulations addressing these results are not yet
0 0.5 1 1.5 2 2.5 3 0 0.05 0.1 0.15 0.2 part
/N
ω
(GeV) T p Peripheral SemiPeripheral SemiCentral Central 5 MeV ± =250 eff ω Central T >=0.44 β =110 MeV & < 0 f T Blast Wave /dη>=17 ch <dN >=70 η /d ch <dN >=140 η /d ch <dN >=193 η /d ch <dNFig. 12. pT dependence of the ω yield with respect to the fit
line in Fig. 11, absolutely normalized for the full phase space yield, for different centralities. The solid line for pT ≤1 GeV
shows the result from a blast-wave fit to the ω for central col-lisions. The dotted lines are only meant to guide the eye. The errors are purely statistical. The systematic errors are negligi-bly small compared to the statistical ones.
available. It should be added that the same procedure ap-plied to the φ does describe the data solely on the basis of radial flow. No effect beyond that can be recognized, within errors.
7 Conclusions
This paper, supplementing [14], contains the most com-prehensive data set on excess dileptons above the known sources which has so far become available through NA60. We have concentrated here more than before on interpre-tational aspects, in particular on the way, ”parton-hadron duality” in the yields can be overcome by a careful study of M -pT correlations. The data mediate a clear conclusion
on the dominance of partonic processes for M >1 GeV. A systematic comparison with theoretical models reveals remaining ambiguities in the modeling, but the overall agreement with the data tends by now to support the same conclusion.
References
1. R. D. Pisarski, Phys. Lett. 110B, (1982) 155
2. R. Rapp and J. Wambach, Adv. Nucl. Phys. 25, (2000) 1 3. G. E. Brown and M. Rho, Phys. Rept. 363, (2002) 85 4. L. D. McLerran and T. Toimela, Phys. Rev. D 31, (1985)
5. K. Kajantie, M. Kataja, L. .D. McLerran and P. V. Ruuska-nen, Phys. Rev. D 34, (1986) 811
6. G. Agakichiev et al. (CERES Collaboration), Eur. Phys. J. C41, (2005) 475 and earlier references therein
7. D. Adamova et al. (CERES Collaboration), Phys. Lett. B 666, (2008) 425
8. M. C. Abreu M C et al. (NA38/NA50 Collaboration), Nucl. Phys. A 698, (2002) 539 and earlier ref.
9. A. L. S. Angelis et al. (HELIOS-3 Collaboration), Eur. Phys. J. C 13, (2000) 433 and earlier ref.
10. H. .J. Specht, Nucl. Phys. A 805, (2008) 338, arXiv:0710.5433 [nucl-ex]
11. R. Arnaldi et al. (NA60 Collaboration), to be published in Eur. Phys. J. C, (2008), arXiv:0810.3204 [nucl-ex]
12. R. Arnaldi et al. (NA60 Collaboration), Phys. Rev. Lett. 96, (2006) 162302
13. R. Arnaldi et al. (NA60 Collaboration), Phys. Rev. Lett. 100, (2008) 022302
14. S. Damjanovic et al. (NA60 Collaboration), J. Phys. G 35,(2008) 104036, arXiv:0805.4153 [nucl-ex]
15. S. Damjanovic et al. (NA60 Collaboration), Eur. Phys. J. C 49, (2007) 235
16. R. Rapp, (2003), private communication and R. Rapp, nucl-th/0204003
17. M. Harada and C. Sasaki, Int. J. Mod. Phys. E 16, (2007) 2143, arXiv:hep-ph/0702205
18. H. van Hees and R. Rapp, Phys. Rev. Lett. 97, (2006) 102301; hep-ph/0603084
19. J. Ruppert, C. Gale, T. Renk, P. Lichard and J. I. Kapusta, Phys. Rev. Lett. 100, (2008) 162301; hep-ph/0706.1934 20. V. L. Eletsky, M. Belkacem, P. J. Ellis and J. I. Kapusta,
Phys. Rev. C 64 (2001) 035202
21. R. Rapp and E. V. Shuryak, Phys. Lett. B 473 (2000) 13 22. G. Q. Li and C. Gale, Phys. Rev. C 58, (1998) 2914 23. T. Renk and J. Ruppert, Phys. Rev. C 77, (2008) 024907;
hep-ph/0612113
24. S. Damjanovic et al. (NA60 Collaboration), Nucl. Phys. A 783, (2007) 327
25. M. Floris et al. (NA60 Collaboration), J. Phys. G 35, (2008) 104054, arXiv:0809.0420 [hep-ex]
26. H. van Hees and R. Rapp, Nucl. Phys. A 806 (2008) 339 27. K. Dusling, D. Teaney and I. Zahed, Phys. Rev. C 75,
(2007) 024908; hep-ph/0701253
28. E. L. Bratkovskaya, W. Cassing and O. Linnyk, arXiv:0805.3177 [nucl-th].
29. M. Kotulla et al. (CBELSA/TAPS Collaboration), Phys. Rev. Lett. 100, 192302 (2008)
![Fig. 3. Excess dimuons for semicentral collisions compared to the theoretical model results by Hees/Rapp [18] (left) and Renk/Ruppert et al](https://thumb-eu.123doks.com/thumbv2/123doknet/14018491.457155/3.918.93.795.145.431/excess-dimuons-semicentral-collisions-compared-theoretical-results-ruppert.webp)
![Fig. 5. Acceptance-corrected transverse mass spectra of the excess dimuons for 4 mass windows and the φ [13] (left), and a decomposition into peak and continuum for the ρ-like window (right, see text)](https://thumb-eu.123doks.com/thumbv2/123doknet/14018491.457155/6.918.85.802.160.511/acceptance-corrected-transverse-spectra-dimuons-windows-decomposition-continuum.webp)
![Fig. 8. Left: Inverse slope parameter T eff vs. dimuon mass for the combined LMR/IMR regions of the excess in comparison to hadrons [13]](https://thumb-eu.123doks.com/thumbv2/123doknet/14018491.457155/7.918.112.795.147.456/inverse-parameter-dimuon-combined-regions-excess-comparison-hadrons.webp)