AERODYNAMIC PERFORMANCE MEASUREMENTS OF A FULLY SCALED, FILM-COOLED, TURBINE STAGE
by
CHRISTOPHER M. SPADACCINI
S.B. Aeronautics and Astronautics, Massachusetts Institute of Technology, 1997
Submitted to the Department of Aeronautics and Astronautics in partial fulfillment of the requirements for the degree of
MASTER OF SCIENCE at the
MASSACHUSETTS INSTITUTE OF TECHNOLOGY September 1999
@ Massachusetts Institute of Technology 1999. All rights reserved.
Departmen f Aeronautics a Atronautics ugust 30, 1999
Certified by
Dr. Gerald R. Guenette Principal Research Engineer Department of Aeronautics and Astronautics, Gas Turbine Laboratory Thesis Supervisor Accepted by MASSACHUSETIS INSTITUTE OF TECHNOLOGY
DEC
281999
LIBRARIES
V IProfessor Nesbitt W. Hagood Associate Professor of Aeronautics and Astronautics Chair, Department Graduate Programs
Allthnr
AuthorV
-AERODYNAMIC PERFORMANCE MEASUREMENTS OF A
FULLY SCALED, FILM-COOLED, TURBINE STAGE by
CHRISTOPHER M. SPADACCINI
ABSTRACT
The MIT Blowdown Turbine short duration test facility was used to experimentally measure the aerodynamic performance of a film-cooled turbine stage. Turbine torque, speed, mass flow, temperature, and pressure were measured and used to calculate efficiency. Pressure ratio, corrected speed, and coolant mass flow were varied parametrically over a range of conditions and compared to a baseline. No distinct trend was seen in the pressure ratio tests. Efficiency increased approximately 2.2% with a corrected speed increase of 20%. This trend is a result of a corresponding decrease in blade loading. An efficiency decrease of 2% was shown for a two-fold increase in coolant mass flow. A preliminary comparison to a previous uncooled test series showed a 2% decrease in efficiency with a 12% coolant-to-mainstream mass flow ratio.
To complete these tests, an uncooled turbine configuration was modified to a film-cooled configuration. A solid blade and nozzle guide vane set was machined via electro-discharge machining, laser drilling, and laser welding to provide film-cooling holes and manifold chan-nels. The effective area (CdA) of the film-cooling holes was measured and part-to-part variations quantified.
A coolant feed system was constructed to provide coolant flow to the turbine. Flow to the rotor blades, nozzle guide vanes, and tip casing was metered and controlled independently. Thick walled, squared edged, choked orifices were used. A set of experiments were performed to show that supersaturated coolant flow could be adequately controlled by this method.
Thesis Supervisor: Dr. Gerald R. Guenette Title: Principle Research Engineer
Department of Aeronautics and Astronautics Gas Turbine Laboratory
ACKNOWLEDGMENTS
I would like to thank Dr. Gerald Guenette for his guidance advising this research and for contributing to nearly every aspect. Also, Professor Alan Epstein for his suggestions and academic counseling.
I am greatly indebted to Lori Martinez, Holly Anderson, Viktor Dubrowski, James Letendre, Bill Ames, Mariano Hellwig, and Tom Ryan for their administrative and technical support. A special thanks to the students who worked with me on the Blowdown Turbine: Jason Jacobs, Leo Grepin, Yi Cai, and especially, Rory Keogh who was more of a mentor than a fellow student.
I would also like to thank the other students at the Gas Turbine Laboratory who have made my experience here a more enjoyable one, especially Dan Kirk and Dave Underwood. Also, my office-mates, Adam, Mez, Waleed, and Bruno, as well as my other friends at the GTL: Amit, Luc, Zolti, Kevin, Brian, Tony, Jon, and Margarita.
Over the past two years many friends outside of the lab have helped to make this experience a memorable one. Especially my roommates Erin, Marco, and Jon, as well as Ming, Andrew, Amy, Ivy, Eva, and Bergen. Also my friends from CT: Pat, Joe, Amy, Chris, Pete, Rico, and Matt.
Finally, I would like to thank my family for all of the support and encouragement they have given me over the past two years of this work.
This program was sponsored by the US Department of Energy and ABB Power Generation Systems. Their support is gratefully acknowledged.
CONTENTS
1 Introduction 1.1 Background ... 1.2 Previous Work ... 1.3 M otivation ... 1.4 Objectives ... 1.5 Thesis Outline ...2 Blowdown Turbine Test Facility
2.1 Introduction ...
2.2 Facility Configuration . . . . 2.2.1 Introduction ...
2.2.2 Supply Tank and Main Valve . . . 2.2.3 Test Section ...
2.2.4 Downstream Translator . . . .
2.2.5 Eddy Current Brake Torque Meter
2.2.6 Critical Flow Venturi Nozzle . . .
2.2.7 Coolant Feed System . . . .
7 23 . . . . 23 . . . . .. . 24 . . . . . . 25 . . . .. . 26 . . . . .. . 27 29 . . . . . 29 . . . . . 30 . . . . 30 .. . . . . 30 . . . . 30 . . . . . 32 . . . . . 35 .. . . . . 36 .. . . . . 36
2.3 Test Procedures ... 2.4 Scaling of Test Conditions ... 2.5 Instrumentation . ...
2.5.1 Introduction ...
2.5.2 Total Temperature Instrumentation 2.5.3 Total Pressure Instrumentation . 2.5.4 Other Instrumentation ... 2.5.5 Transducer Calibration ... 2.6 Data Acquisition . ... 2.7 Summary . ...
3 Film-Cooled Turbine Fabrication
3.1 Introduction ...
3.2 Film-Cooled Turbine Geometry . ... . 3.2.1 Film-Cooled Turbine Blade . . . . 3.2.2 Film-Cooled Turbine Nozzle Guide Vane . . 3.2.3 Film-Cooled Turbine Tip Casing ... 3.3 Electro-Discharge Machining . . . .
3.3.1 Introduction ...
3.3.2 Blade Manifold Channels . . . .
3.3.3 Nozzle Guide Vane Manifold Channels . . . 3.4 Laser Drilling ...
3.4.1 Introduction ... ...
3.4.2 Blade Cooling Holes . ... .
8 49 . . . . . . . . . . . . .. . 49 . . . . . . . . 49 . . . . . . . . 49 . . . . . 52 . . . . . . . . 53 . . . . . . . . 53 . . . . 53 .. . . . . 54 . . . . . 55 . . . . 56 . . . . . .. . 56 .. . . . . 59
3.4.3 3.4.4
Nozzle Guide Vane Cooling Holes ... Tip Casing Cooling Holes . ...
3.4.5 Cleaning Procedures 3.5 Laser Welding... 3.6 Summary ...
4 Film-Cooling Hole Discharge
4.1 Introduction ...
4.2 Reynolds Number Effects . 4.3 Calibration Apparatus . . .
Coefficient Ca
4.4 Discharge Coefficient Calibrations . . . .
4.4.1 Theory and Procedures ... 4.4.2 Global Blade Cooling Hole Effective
4.4.3 Discrete Blade Row Effective Area 4.5 Conclusions... . .
4.6 Summary ... . .. ...
5 Coolant Flow Metering
5.1 Introduction ... . ...
5.2 Coolant Feed System ...
5.3 Critical Flow Metering ... .
5.3.1 Calculation Procedure . . . .
5.3.2 Critical Flow Coefficient . . . .
5.4 Coolant Flow Metering Experiment . . . . .
t1 . . . . . 61 . . . . . . . . . 61 . . . . . 62 . . . . 63 . . . . 63 libration 65 . . . . . . . . 65 . . . . 66 . . . . . 67 . . . . . 68 . . . . 68 Area . . . .. . . . . . 70 . . . . . 7 1 . . . . 72 . . . . 73 75 . . . . 75 . . . . 75 . . . . 77 . . . . . 77 . . . . . 78 ... . . . . 80
5.4.1 Method ...
5.4.2 Experimental Configuration . ... 5.4.3 Test Matrix . ...
5.5 Results ...
5.5.1 Volume Calibration ...
5.5.2 Critical Flow Coefficients for Supersaturated CO2 5.6
5.7
Conclusions . ...
Summary . ...
6 Uncooled Turbine Performance Testing
6.1 Introduction . ...
6.2 Efficiency Calculation . ...
6.2.1 Mechanical Efficiency . . . .. 6.2.2 Transient Corrections . . . ..
6.2.3 Corrected Mechanical Efficiency . . 6.3 Test Matrix...
6.4 Results ...
6.5 Conclusions . ... . ...
6.6 Summary ... . ...
7 Film-Cooled Turbine Performance Testing
7.1 Introduction ...
Cooled Turbine Mechanical Efficiency Calculation . Test Matrix ... 10 87 . . . . 87 . . . . . 87 . . . . . 87 . . . . 88 . . . . . 91 . . . . 92 .. . . . .. . 93 . . . . . 94 . . . . 94 97 . . . . 97
7.4 Results . . . .. . . . . . .. . 7.4.1 Baseline Conditions . . . .
7.4.2 Variation in Coolant Flow . . . .
7.4.3 Variation in Pressure Ratio . . .
7.4.4 Variation in Corrected Speed . . 7.4.5 Comparison to Uncooled Turbine
7.5 Conclusions ... 7.6 Summary ... Tests .... 104 .... 105 8 Conclusions 8.1 Review of Objectives... .. ... 8.2 Summary of the Work ... . ... 8.3 Recommendations for Future Work . . . . . . . . . .. A Turbine Blade Discrete Row CdA A .1 Introduction . .... .. . ... . ... ... .... . .. . ... A.2 Figures ... . .. ... B Coolant Flow Metering Experimental Data B.1 Introduction ... . .. ... B .2 Figures ... . . . .... C Film-Cooled Turbine Experimental Data C.1 Introduction ... .... . ... C.2 Figures ... 11 . . . . . . . 99 .. . . . . . . 99 .. . . . . 101 . . . . . . . . . 102 .. . . . . 102 . . . . . 104 107 107 107 108 111 111 111 119 119 119 135 135 135
LIST OF FIGURES
MIT Blowdown Turbine test facility...
Blowdown Turbine facility main valve . ... Test section cut-away. ...
Test section flow path ...
Downstream translator motion . ... Critical flow venturi nozzle. ... Coolant feed system ...
Total temperature and pressure for matching Reynolds Number Typical differential pressure transducer calibration trace ... 2-1 2-2 2-3 2-4 2-5 2-6 2-7 2-8 2-9 3-1 3-2 3-3 3-4 3-5 3-6 3-7 3-8
ABB uncooled turbine blade. .. ABB uncooled turbine NGV. .. ABB cooled turbine blade... ABB cooled turbine NGV ....
Blade cooling manifold passages. Blade fixture for EDM ...
NGV cooling manifold passages. NGV fixture for EDM ...
and y .. . . . . . . 50 . . . . .. . 50 . . . . 5 1 . . . . 52 . . . . . 55 . . . . 56 . . . . . . . . . 57 . . . . . . . . . . . . 57
3-9 3-10 3-11 4-1 4-2 4-3 4-4 4-5 5-1 5-2 5-3 5-4 5-5 5-6 5-7 5-8
Typical laser drilled hole cross section . ... Blade fixture for laser drilling.. ...
NGV platform modifications for laser drilling . ...
Losses in an orifice ...
Schematic of discharge coefficient calibration apparatus . ... Turbine blade CdA ...
Discrete blade row CdA ...
Leading edge row CdA for ten blades . . . . ...
Coolant feed system schematic ...
Schematic of coolant flow experimental configuration . . ...
Toroidal throat critical flow venturi nozzle for coolant flow experiments. Coolant tank pressure for argon. ...
Coolant tank temperature for argon. ... Argon mass flow rate...
CO2 Critical Flow Coefficient for unsaturated conditions . ...
CO2 Critical Flow Coefficient for supersaturated conditions ...
6-1 Typical uncooled turbine raw and corrected power . ...
6-2 Typical uncooled turbine uncorrected and corrected mass flow rate. . 6-3 Typical uncooled turbine mechanical efficiency. . ...
6-4 Uncooled turbine efficiency vs. pressure ratio for two rotor tip gaps. 6-5 Uncooled turbine efficiency vs. corrected speed for two rotor tip gaps.
7-1 Baseline cooled turbine experiment . . . . ...
14
7-2 7-3
7-4
7-5
7-6
Coolant mass flow for four different tests . ... Turbine efficiency vs. coolant mass flow. . ... Cooled turbine efficiency vs. pressure ratio . . . . ....
Cooled turbine efficiency vs. corrected speed . . . . ...
Efficiency for comparable uncooled and cooled turbine tests..
A-1 Blade #054 cooling hole effective area.
A-2 Blade #011 cooling hole effective area. A-3 Blade #077 cooling hole effective area. A-4 Blade #023 cooling hole effective area. A-5 Blade #048 cooling hole effective area. A-6 Blade #017 cooling hole effective area. A-7 Blade #052 cooling hole effective area. A-8 Blade #092 cooling hole effective area. A-9 Blade #004 cooling hole effective area.
A-10 Blade #062 cooling hole effective area. A-11 Blade #056 cooling hole effective area.
A-12 Blade #064 cooling hole effective area.
B-1 Coolant flow test #001. ... B-2 Coolant flow test #002. ... B-3 Coolant flow test #003. ...
B-4 Coolant flow test #004 . . . . .
B-5 Coolant flow test #005 . . . . .
15 .. . . . . . 101 .. . . . . 102 .. . . . . . 103 .. . . . . 103 . . . . . 104 .. . . . . . 112 . . . . . 112 .. . . . . 113 .. . . . . 113 .. . . . . 114 .. . . . . . 114 .. . . . . 115 .. . . . . 115 .. . . . . 116 .. . . . . 116 .. . . . . . 117 .. . . . . 117 . . .. . . . . . . . . . . 120 . . . . . . . . . . 121 . . . . . . . .. . 122 .. . . . . . . . . . 123 . . . . . . . . . . 124
B-6 Coolant flow test #006. B-7 Coolant flow test #007. B-8 Coolant flow test #008. B-9 Coolant flow test #009. B-10 Coolant flow test #010. B-11 Coolant flow test #011. B-12 Coolant flow test #012. B-13 Coolant flow test #013. B-14 Coolant flow test #014.
C-1
C-2 C-3
Film-cooled turbine test Film-cooled turbine test Film-cooled turbine test
#001. #002. #003. C-4 Film-cooled turbine test #004. C-5 Film-cooled turbine test #005. C-6 Film-cooled turbine test #006. C-7 Film-cooled turbine test #007. C-8 Film-cooled turbine test #008. C-9 Film-cooled turbine test #009. C-10 Film-cooled turbine test #010. C-11 Film-cooled turbine test #011.
. . . . . . . . .. . 125 . . . . . . . . . . 126 . . . . . . . . . . .. . 12 7 . . . . 128 . . . . . . . . . . .. . 129 . . . . . . . . . . . .. . 130 . . . . . . . . .. . 13 1 . . . . 132 . . . . 133 . . . . 136 . . . . 137 . . . . . . . . . . 138 . . . . . . . . . . 139 . . . . 140 . . . . 14 1 . . . . 142 . . . .. . 14 3 . . . . . . . . . .. . 144 . . . . . . . . .. . 145 146
LIST OF TABLES
2.1 Typical Blowdown Turbine operating conditions. 2.2 Blowdown Turbine instrumentation...
Blade cooling holes . ... NGV cooling holes... ...
Test matrix for coolant flow experiments. Summary of tank volume measurements.
Uncooled turbine baseline test conditions. Uncooled turbine test matrix . . . . .
Cooled turbine baseline test conditions. Cooled turbine test matrix ...
. . . . . 42 3.1 3.2 5.1 5.2 6.1 6.2 7.1 7.2 . . . . . 53 . . . . . 92 . . . . . 92
NOMENCLATURE
Roman
a A Ageometric Ae f fective Cd CR h I Lref rh M N Nmech Ncor PQ
R Re t T speed of sound [m/s] area [m2 ] geometric area [m2 ] effective area [m2] discharge coefficient critical flow coefficient enthalpy [J/kg]moment of inertia [kg-m2]
reference length [m] mass flow rate [kg/s] Mach Number angular velocity [rps] mechanical speed [rps] corrected speed
pressure [Pa]
heat per unit mass [J/kg] gas constant [J/kg.K] Reynolds Number entropy [J/kg-K] time [s]
u V Wc
Greek
Script
velocity [m/s] volume [m 3 ] corrected flowspecific heat ratio, Cp/CV error efficiency dynamic viscosity [kg/m.s] pressure ratio density [kg/m3 ] temperature ratio angular velocity [rad/s]
power [Watts] torque [N-m]
Superscripts
Subscripts
0 stagnation quantity
1 turbine inlet
2 turbine exit
CHAPTER
1
INTRODUCTION
1.1
Background
The aerodynamic performance of axial flow turbines has increased dramatically over the past fifty years. Currently, polytropic efficiencies exceed 90% and turbine inlet tempera-tures are on the order of 18000K. Improvements in efficiency have been driven by a better understanding of turbine fluid mechanics and more powerful computational tools. The rel-atively high turbine inlet temperatures have been achieved via advances in blade materials and internal and external cooling schemes. Thus, modern turbine designs have culminated in a much higher power per unit mass flow and a substantial increase in efficiency compared to their predecessors. Empirical observations acquired through years of turbine testing on engines, rotating rigs, cascades, and other sub-scale experiments are largely responsible for these advances.
Currently, steady state turbine testing has become expensive and impractical at the aca-demic level. A rig test with inlet temperatures of only 4500K will typically cost around $5 million. As a result, experimental turbine research at this level is no longer common. A typical engine development program will usually include one or even zero turbine rig tests. In the case of the power generation industry, where large gas turbines are used, test rigs are simply not considered due to the immense size and power requirements. These components are tested in service and lead to conservative turbine designs and little or no performance improvement. Aerodynamic efficiency measurement accuracy in a full scale engine is only on the order of 1-2% and is considerably less than that required for today's sophisticated turbine design systems.
A similar situation existed for turbine heat transfer and cooling. However, during the 1980s, a new technology based on transient testing techniques has been developed at MIT's Gas Turbine Laboratory (GTL)[1]. Researchers at the GTL have been able to obtain highly accurate and detailed measurements of turbine heat transfer characteristics using this method. Time scales characteristic of heat transfer phenomena within a turbine are on the order of hundreds of microseconds. The technique is based on this realization. With instrumentation of adequate time response, tests less than a second long may be sufficient to establish steady state behavior. Although the instantaneous power generated during such a short duration test may be quite high (several megawatts), the energy required to conduct the test is relatively low. Also, by scaling all relevant non-dimensional properties, such as Reynolds Number, total pressure ratio, gas-to-wall temperature ratio, and corrected speed, turbine inlet temperature and rotor tip velocity can be reduced significantly [2]. These factors reduce the construction, maintenance, and power costs of turbine testing in addition to increasing safety margins.
Researchers also believe that transient testing may be useful for aerodynamic performance measurements (e.g., blade loading, efficiency). With the development of aerodynamic in-strumentation with fast time response and the ability to measure shaft torque and turbine mass flow, Guenette[3] has proposed measuring turbine efficiency to an accuracy of 0.5%. Based on this realization, a test program to measure the adiabatic efficiency of both an uncooled and a corresponding cooled turbine, has been undertaken. This thesis is a result of these efforts.
1.2
Previous Work
The MIT Blowdown Turbine transient test facility was one of the first successful short duration turbine experiments. Since its development in the early 1980s, the Blowdown Turbine has been used to study many aspects of turbomachinery fluid physics and heat transfer. This work is briefly reviewed.
1. The Blowdown Turbine facility was designed and constructed by Guenette[4]. This initial work focused on the individual component design and fabrication,
instrumen-tation, and the importance of time and physical scaling. Heat transfer testing of the tip casing and nozzle guide vanes (NGVs) was also conducted.
2. The effect of film cooling on blade heat transfer was studied by Abhari[5]. Heat transfer coefficients, measured on both a cooled and uncooled turbine, were compared. The time unsteady nature of blade heat transfer was examined using these data, as well as cascade data and a physics-based model.
3. Shang[6] examined the influence of turbine inlet temperature non-uniformities on blade heat transfer. Radial temperature distortions were found to have a large effect on turbine heat transfer, while circumferential distortions did not. The experimental study was conducted in conjunction with a computational investigation.
4. Particle-image velocimetry (PIV) was used to study the unsteady nature of turbine fluid mechanics by generating an image of the instantaneous velocity field in the Blowdown Turbine. These data were then compared to CFD calculations by Grepin[7].
5. The latest research focuses on measuring the aerodynamic performance of both an uncooled and a corresponding film-cooled turbine. Ultimately, the efficiency loss due to coolant flow injection will be quantified. Initial research conducted by Keogh[8] and Cai[9] resulted in the development of the instrumentation and facility modifications required for these measurements. Preliminary analyses of these data were carried out by Jacobs[10].
1.3
Motivation
In an effort to improve the performance of the gas turbine cycle, turbine researchers and designers have devoted most of their resources to increasing turbine inlet temperature. In addition to the development and implementation of high temperature alloys and other advances in materials technology, this increase is the result of improved cooling techniques. Full coverage of the turbine blading by film-cooling is one of the most effective means of sustaining higher temperatures and is commonly employed in all high performance engine designs.
It can be expected that further rises in inlet temperature will require not only more effective application of the cooling flow, but also increases in the fraction of flow used for this cooling. Some advanced design concepts are now projecting overall coolant-to-main flow ratios approaching 33%. At these levels, the injected flow is a major component of the overall turbine through-flow. If the advanced life and performance goals of future systems are to be met, these coolant/main flow interactions must be identified and understood. However, little research in rotating facilities has focused on the effect of these coolant/main flow interactions on turbine aerodynamic performance. This is due to the high level of experimental and analytical capability required to study such phenomena. With recent advances at the MIT Blowdown Turbine facility, this area will begin to receive more at-tention. Analysis by Guenette[3] and facility modifications and instrumentation developed by Keogh[8] now allow for accurate measurement of turbine adiabatic efficiency. Therefore, this facility can be utilized to study coolant/main flow interactions in axial flow turbines.
1.4
Objectives
The primary objectives of this work are:
1. To construct a geometrically scaled, fully rotating, single stage, film cooled turbine for testing in the MIT Blowdown Turbine facility.
2. To modify the facility to allow for independent control of coolant flow to the rotor blades, NGVs, and tip casing. This includes all associated coolant system instrumen-tation.
3. To test a film-cooled turbine stage under fully scaled conditions in the Blowdown Turbine facility and obtain aerodynamic performance measurements.
4. To conduct a preliminary comparison of the cooled turbine performance with that of the corresponding uncooled turbine. Uncooled data were obtained in a previous test series and were analyzed by Jacobs[10].
5. To provide a detailed data set for use in physics-based modeling efforts and CFD code validation.
1.5
Thesis Outline
This chapter introduces the content of the thesis, reviews previous Blowdown Turbine re-search, and outlines the motivation and objectives of this work.
Chapter 2 introduces the MIT Blowdown Turbine facility and reviews all primary compo-nents. Facility scaling issues and typical run conditions are discussed. Modifications to the facility to allow for coolant flow are also presented.
In chapter 3, the manufacturing of a scaled, film-cooled turbine is presented. The use of ad-vanced machining techniques, including electro-discharge machining (EDM), laser drilling, and laser welding are discussed.
Knowledge of the discharge coefficients of each row of film cooling holes is required for later calculations and modeling. In chapter 4, an apparatus for measuring these discharge coefficients is presented along with data for the rotor blade cooling holes.
Chapter 5 discusses the problems associated with the flow of supersaturated CO2 in the
coolant feed system. Metastable flow metering with thick walled, square edged, choked orifices was validated by comparison with flow through a toroidal throat, critical flow venturi nozzle.
Chapter 6 reviews the uncooled turbine performance data first analyzed by Jacobs[10]. The method of calculating efficiency propounded by Keogh[8] is also re-examined.
Chapter 7 includes a description of the cooled turbine tests, as well as a detailed discussion of the data. Some analysis and a preliminary comparison of the cooled and uncooled turbine aerodynamic performance is also presented.
Chapter 8 concludes the thesis with some final observations and recommendations for future work.
CHAPTER
2
BLOWDOWN TURBINE TEST FACILITY
2.1
Introduction
The MIT Blowdown Turbine test facility is a short-duration, blowdown wind tunnel for testing a fully rotating turbine stage. The facility is capable of rigorously simulating the fluid physics and heat transfer phenomena which occur in a turbine. This is accomplished by matching all critical non-dimensional parameters including Reynolds Number, total pressure ratio, gas-to-wall temperature ratio, mainstream mass flow ratio and coolant-to-mainstream momentum flux ratio. The transient environment of the blowdown facility provides up to 800 ms of quasi-steady state turbine operation. The important fluid and heat transfer phenomena occur on extremely small time scales, on the order of the inverse of the blade passing frequency, and can be observed in the 800 ms test window. Therefore, quasi-steady state measurements can be made in a fraction of a second, capturing several hundred flow time scales provided that instrumentation with adequate time response is available. Although the facility was originally designed around a 0.75 scale turbine from the Rolls Royce Advanced Core Engine (ACE), it now houses a 0.25 scale ABB GT24 first low pressure turbine stage.
This chapter reviews the MIT Blowdown Turbine facility. Overall configuration and oper-ational procedures are described. Scaling of the turbine operating point for achieving full scale similarity is discussed. Individual components are examined as well as instrumentation and the recently modified coolant feed system. The data acquisition system is also briefly presented.
2.2
Facility Configuration
2.2.1
Introduction
The MIT Blowdown Turbine test facility is shown in Figure 2-1. The facility consists of seven primary components: the supply tank, fast acting valve, test section, eddy current brake torque meter, critical flow venturi nozzle, coolant feed system (not shown), and dump tank. Each of these components will be discussed and a detailed review of the overall design of the facility can be found in reference [4].
2.2.2 Supply Tank and Main Valve
The supply tank is a large cylindrical tank which is capable of holding gas up to pressures of 150 psia. The supply tank can also be heated to obtain the appropriate test gas temperature. The tank is wrapped in a metal jacket through which heat transfer oil is circulated. By regulating the temperature of this oil, the tank temperature can be controlled. A gas mixing fan is mounted inside the tank to ensure gas temperature uniformity.
The supply tank is separated from the rest of the tunnel by the main valve. This valve is a fast acting, axially traversing, plug valve. When closed, the valve seals the supply tank from the test section and when open, forms a smooth annular flow path. Figure 2-2 shows the valve. The valve is initially actuated by 1200-1400 psi argon supply bottle. The force from the argon begins to open the valve and the test gas, usually at pressures of 50-105 psia, flows out of the supply tank and forces the valve completely open. Valve dynamics are controlled by the expansion of the test gas into internal damping chambers. The valve is opened in approximately 50 ms and the flow transient due to this opening is 300 ms. A detailed review of the main valve design and dynamics can be found in reference [4].
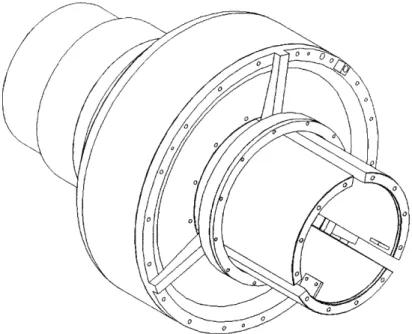
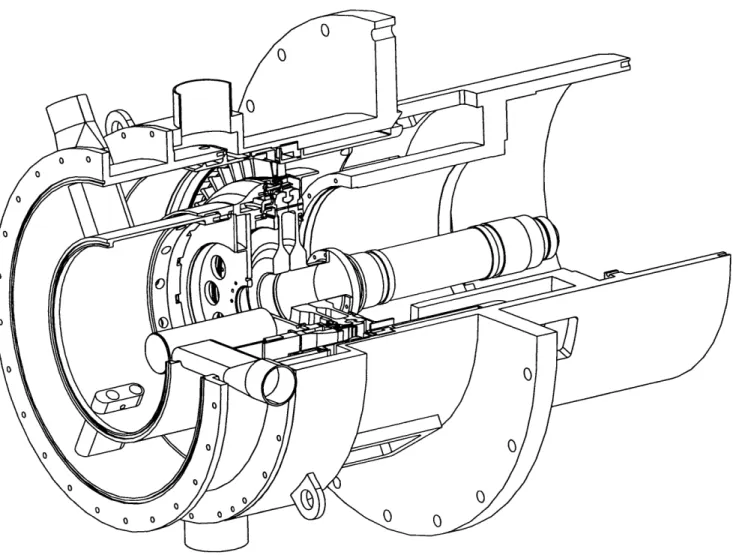
2.2.3 Test Section
A cut-away of the test section is shown in Figure 2-3. The test section houses the forward frame, rotor assembly, and downstream translator. The forward frame mates to the main valve upstream and contains the nozzle guide vanes (NGVs) downstream. The forward
Critical-Flow
Venturi Dump Tank
Starter Motor Housing 1 Meter Test Section Eddy Current Brake Supply Tank c 5" o w a
Figure 2-2: Blowdown Turbine facility main valve.
frame is followed by the rotor assembly which consists of the rotor discs, blades, and a large cylindrical drum (not shown). The drum is inserted into the eddy current brake torque meter which will be discussed in subsection 2.2.5.
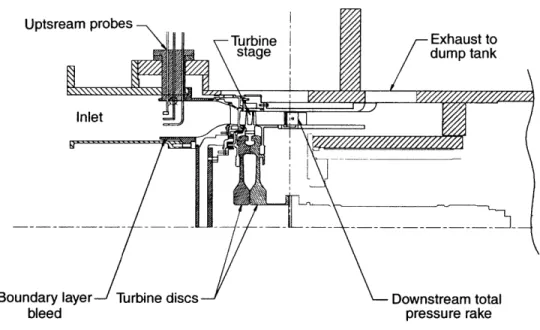
Figure 2-4 shows a cross-sectional view of the test section flow path. Upstream of the turbine stage a boundary layer bleed provides clean inlet flow. Downstream of the rotor the flow is exhausted through an adjustable throttling area. During the usable portion of the test, this area is choked. By varying this area via a throttle plate, the desired pressure ratio across the turbine can be achieved. Also shown in Figure 2-4 are upstream and downstream measurement locations. Downstream total temperature and pressure probes are mounted on a circumferential translator. This device will be discussed in subsection 2.2.4.
2.2.4 Downstream Translator
Upstream of the turbine stage it can be assumed that the flow is circumferentially symmet-ric. This allows for stationary upstream measurements to be representative of the entire
Figure 2-4: Test section flow path.
flow field. Downstream of the turbine this is not the case. The presence of the NGVs causes a circumferential non-uniformity in the form of a wake. Thus, stationary flow field measurements will be biased by their circumferential location; the temperature and pres-sure inside and outside of a wake are not the same. In order to avoid this complication the downstream probes must be circumferentially traversed during the usable test window. This is the purpose of the downstream translator.
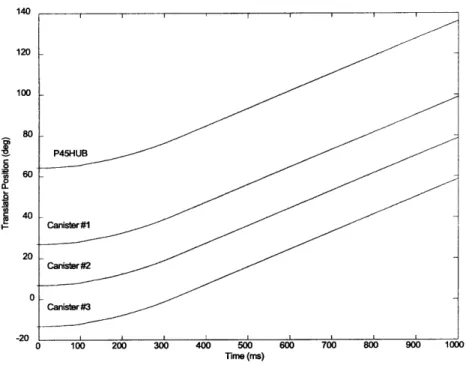
The translator is a large cylindrical drum located downstream of the rotor. It contains three "canisters" in which probes can be mounted. They are spaced 200 apart and contain the appropriate electrical connections for either a total temperature or pressure rake. Located 400 ahead of the first canister is a static pressure tap, labeled P45HUB.
The translator is free to rotate 3500 and is restricted by a spring loaded hard stop. This stop is designed to prevent the translator from freely spinning and destroying the canisters' electrical wiring. The translator is driven by a servo-motor which provides approximately 3 in-lbs of torque through an equivalent 13.5:1 gear ratio and is computer controlled. Figure 2-5 shows typical translator motion during an experiment. The translator rotates at a constant angular velocity of approximately 0.25 rps during the usable test window. All instruments are between 00 and 120' during this time. These locations correspond to wind tunnel strut locations behind which measurements are contaminated.
120 100 80 0 0 20 0-Canister #3 -20 0 100 200 300 400 500 600 700 800 900 100 Time (ms)
Figure 2-5: Downstream translator motion.
2.2.5
Eddy Current Brake Torque Meter
The eddy current brake torque meter serves the purpose of braking the turbine and holding a relatively constant corrected speed during the test window. It also provides a measure of shaft torque. A large, cylindrical, inconel drum which is connected to the rotor assembly inserts into the eddy current brake torque meter. The braking mechanism consists of a series of electromagnets arranged circumferentially inside the facility. Spinning the drum in the magnetic field induces a current. This current, through resistive heating of the drum, dissipates the power produced by the turbine. In the presence of the magnetic field, the current opposes the rotation of the drum and provides a braking torque. By adjusting the brake excitation voltage, the torque provided by the brake can be varied. This is how turbine corrected speed is controlled.
The braking system was modified by Keogh[8] so that it can be used to measure shaft torque. By mounting the brake assembly on bearings and reacting the braking torque through load cells, torque can be measured. Ultimately, this measurement is used to compute turbine power.
2.2.6 Critical Flow Venturi Nozzle
A large critical flow venturi nozzle is located downstream of the test section and is used
to measure the total facility mass flow. After passing through the test section, the test gas flows through the venturi nozzle and its total temperature and pressure are measured. From these data and knowledge of the venturi discharge coefficient, the mass flow can be calculated. After passing through the venturi the flow exhausts into the dump tank. The venturi itself is a smooth-walled, geometrically well defined nozzle. It was built by Flow Systems Inc. and it's discharge coefficient was calibrated by Colorado EESI. This calibration is traceable to the National Institute for Standards and Technology (NIST). A cross section of the critical flow venturi nozzle is shown in Figure 2-6 and a more detailed review of its design and usage can be found in reference [8].
Flow conditioner
Venturi nozzle
Upstream duct
Figure 2-6: Critical flow venturi nozzle.
2.2.7
Coolant Feed System
Previous testing of the ABB turbine was done with an uncooled configuration. There were no film-cooling holes and as a result, no need for a coolant feed system. However, recent testing on the film-cooled version of the turbine stage required such a system. There was
NGV coolant feed
Tip casing coolant feed
Blde cooltnt feed
Manifold
Coolant supply tank
Figure 2-7: Coolant feed system.
an existing coolant system which would need modifications to be used. It was necessary to install additional plumbing to feed the coolant into the turbine and to control the coolant mass flow splits to the rotor blades, NGVs, and tip casing independently. The system consists of a coolant supply tank, a fast-acting pneumatic ball valve, a pipe network, and several orifice plates for metering the flow. Like the facility itself, the cooling system operates in a blowdown mode.
The coolant supply tank is 3.97 ft3 and has a pressure rating of 450 psia. Like the main supply tank, it is surrounded by a metal jacket and insulation for controlling tank temper-ature. A flow of liquid nitrogen mixed with compressed air is used to cool the tank lining and the test gas to the desired temperature.
The fast-acting ball valve at the tank exit is actuated by a 1000 psi argon bottle. It is triggered simultaneously with the main valve and closes approximately 1.2 seconds later.
The piping network feeds the coolant from the supply tank into the test section and to the turbine. An overhead view of this network can be seen in Figure 2-7. Three independent feeds are required. One each to the rotor blades, NGVs, and tip casing. The flow is split in a manifold downstream of the ball-valve. Each split is metered by a thick, square edged, choked orifice with known discharge coefficient. This sets the mass flow ratios to each turbine component in an accurate, reliable, and inexpensive manner.
2.3
Test Procedures
Preparations for a blowdown experiment begin by determining the desired conditions for achieving full-scale turbine operating similarity. This analysis is presented in section 2.4. For the purposes of this discussion, it is assumed that these conditions consist of the up-stream total temperature and pressure, coolant total temperature and pressure, test gas composition, mechanical speed, throttle area, and brake excitation. The experiment then proceeds as follows:
1. The entire facility is evacuated to approximately 0.5 torr and the throttle plate is positioned for the predetermined area.
2. The main supply tank is heated to the desired upstream total temperature and is brought to thermal equilibrium.
3. The main valve is sealed and the supply tank is filled with the test gas to the desired upstream total pressure.
4. Simultaneously, the coolant supply tank is filled with it's test gas to the desired pressure and cooled to the predetermined temperature.
5. At this post-fill state, all differential pressure transducers are calibrated by cycling their back-pressure between vacuum and atmosphere. This provides a scale factor for each transducer. Instrumentation and calibration are discussed in further detail in section 2.5.
7. The data acquisition system and translator servo-motor controller are set to stand-by mode and are waiting to be triggered.
8. The turbine rotor is then accelerated to the desired mechanical speed by a starter motor.
9. Once this speed is exceeded, the motor is powered down and the rotor spins freely in the vacuum. It is decelerated by bearing friction.
10. When the decelerating rotor reaches the preset speed, triggering occurs causing the main valve and coolant ball valve to open. Simultaneously, the data acquisition system begins collecting data, the downstream translator begins it traverse, and the eddy current brake torque meter is energized.
11. The test gases then flow through the test section and quasi-steady state operation is reached after a 300 ms transient. The useful test window is approximately 300-1000
ms.
12. After approximately 1.2 seconds the coolant ball-valve closes and the brake is turned off.
13. The rotor decelerates and comes to a stop.
14. Once the gas inside the tunnel stabilizes, all differential pressure transducers are re-calibrated to check for drift.
15. The tunnel is re-evacuated and cooled to room temperature.
2.4
Scaling of Test Conditions
Validity of scaled wind tunnel experiments depends on similarity between the test flow and the actual flow being simulated. In dimensionless form, the equations for momentum and energy transfer produce non-dimensional parameters which characterize the flow field. Sim-ilarity between experiment and reality only requires that these non-dimensional parameters are matched. For a turbine stage, corrected mass flow and total temperature ratio depend
on four dimensionless parameters: total pressure ratio, corrected speed, Reynolds number, and specific heat ratio 7[4]. Equation 2.1 shows the functional form of this relationship.
_h_____ NLre,f 7
, - f 7r, ref,"M (2.1)
[Po,1L2ef
'
k'
R'
[Lref'f (2)These are the parameters that govern similarity in the Blowdown Turbine and can be matched with the proper operating conditions. Operating conditions consist of a test gas composition, upstream total temperature and pressure, coolant total temperature and pres-sure, mechanical speed, throttle area, and brake excitation.
For an uncooled turbine test, supply tank total temperature and pressure are set to simulta-neously match Reynolds Number and specific heat ratio. Reynolds number can be written in terms of mass flow as
Re = (2.2)
pLref
Corrected flow is equal to the stage design corrected flow and is known. It can also be expressed in terms of mass flow as
W , 2 (2.3)
FTO,1Lref
A relationship for total temperature, total pressure, and Reynolds number for a given corrected flow can be obtained by combining equations 2.2 and 2.3.
Po = Re (2.4)
Lref WC
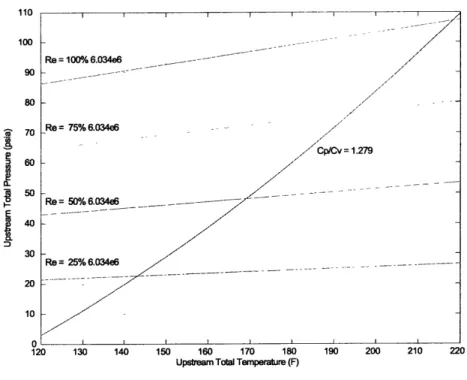
With this relationship, a total temperature can be selected and the pressure required for Reynolds Number similarity can be calculated. From this temperature and pressure, -can be obtained from a table of gas properties and compared to the desired value. Total temperature is adjusted until specific heat ratio similarity is obtained. This process is demonstrated graphically in Figure 2-8 where lines of constant Reynolds number and -y are plotted on a total temperature and pressure plane.
110 100 -Re = 100% 6.034e6 90 -80 70 Re= 75% 6.034e6 //7Cp/Cv 60 50 7 Re= 50 6.034e6 40 30 Re = 25% 6.034e6 20 10 0 120 130 140 150 160 170 180 190
Upstream Total Temperature (F)
200 210 220
Figure 2-8: Total temperature and pressure for matching Reynolds Number and -y. A test gas
of pure CO2is assumed.
set to match full scale corrected speed by applying the definition of corrected speed:
Nmech = To Ncor
Lref (2.5)
For a film-cooled turbine test two additional parameters must be satisfied. Momentum flux ratio and coolant-to-mainstream mass flow ratio are matched. To match the full scale momentum flux ratio, the coolant-to-mainstream temperature ratio must be simulated. This requires a main supply tank temperature which is very high and a low coolant temperature.
As a result, the afore mentioned method of matching Reynolds Number and specific heat ratio no longer holds. In some cases, Reynolds Number can not be matched because the initial pressure of the supply tank would be greater than safety limits would allow. To match y, the test gas composition must be varied. Mixtures of argon and CO2 are typical.
The coolant total pressure is selected to match the coolant-to-main flow mass fraction of the full scale engine. This is based on the areas of the choked orifices in the coolant feed system and is discussed further in Chapter 5.
Table 2.1: Typical Blowdown Turbine operating conditions.
Parameter Full Scale Engine MIT BDT
Working Fluid Air CO2
Specific Heat Ratio 'y 1.28 1.28
Mean Metal Temperature 1100 K 300 K
Metal/Gas Temp. Ratio 0.647 0.647
Midspan NGV Chord 0.15 m 0.0365 m
Reynolds Number 5.6 x 10⁶ 5.6 x 10⁶
Inlet Total Pressure 15 atm 7 atm
Exit Total Pressure 7.43 atm 3.47 atm Inlet Total Temperature 1700 K 464 K Exit Total Temperature 1470 K 401 K
Prandtl Number 0.928 0.742
Design Rotor Speed 3600 rpm 5954 rpm
Design Mass Flow 312 kg/s 23.3 kg/s
Coolant/Main Flow 9.8% 9.8%
Turbine Power Output 91 MW 1.2 MW
Test Time continuous 1500 ms
set the test pressure ratio the downstream throttle plate must be adjusted. The throttle area can be approximated using average values for y, and assumed values for discharge coefficient, Cd, and adiabatic stage efficiency, r?. However, several blowdown experiments are required to fine tune the pressure ratio and simple scaling from previous tests is more effective.
The eddy current brake torque meter excitation voltage must be set at a certain level to absorb the turbine power and maintain a constant corrected speed. The calculation of this voltage is based on a model of the device which was developed by Guenette[4] during its design.
Table 2.1 summarizes the conditions of a typical blowdown experiment and compares them to that of a full scale engine.
2.5
Instrumentation
2.5.1
Introduction
In a transient testing environment there are stringent requirements on the accuracy and time response of instrumentation. Several highly accurate, fast time response temperature and pressure probes were developed by Cai[9] for use in these conditions. Some of these probes as well as other instrumentation which was used in the Blowdown Turbine will be reviewed here. In addition, the calibration of differential pressure probes will be discussed.
2.5.2 Total Temperature Instrumentation
Upstream of the turbine stage are three fast time response total temperature probes. The type K thermocouple junctions are 0.0005" diameter and are accurate to 0.130 K. The three probes are spaced 1200 apart on the inlet annulus.
There are two total temperature probes located in the critical flow venturi nozzle and one just upstream. These probes are also type K thermocouples with 0.0005" diameter junction
and have similar time response and accuracy to the upstream probes.
The cooling system is instrumented with seven type K thermocouples. These probes have 0.003" junctions and do not have the time response of the afore mentioned sensors due to their larger size. These probes are located at points upstream of the choked orifices and as close as possible to where the coolant enters the test section.
All of the thermocouples are referenced to an Omega TRCIII Ice Point reference cell. Their signals are also amplified prior to be recorded by the data acquisition system.
2.5.3 Total Pressure Instrumentation
The primary concerns in the design of a pressure sensor are fast time response and flow angle insensitivity. The second criteria is particularly important for downstream measurements where a probe is exposed to NGV wakes and is circumferentially translated.
manufactured by Kulite, were used. The primary disadvantage of these transducers are that they tend to drift with changes in temperature. This is the reason for the extensive calibration routines used during every experiment.
Downstream of the turbine stage a rake type pressure probe with eight heads is employed to survey the pressure in the radial direction. The probe is mounted on the downstream translator to resolve flow characteristics in the circumferential direction. To allow a large range of inlet flow angles to the probe, a 150 beveled impact head was employed. Acceptable flow angles are estimated to be ±27.50. The transducers on this rake are 100 psig differential Kulites. More information on the design of this probe is available in reference [9].
In addition to this rake, there are differential sensors located upstream of the turbine and in the supply, coolant, and dump tanks. There are also several highly accurate pressure sensors mounted throughout the facility for use as a calibration reference. These transducers are manufactured by Sensotec. The coolant system is instrumented with several lower accuracy Sensotec 100 psig transducers and one 300 psig transducer.
2.5.4 Other Instrumentation
Several other pieces of instrumentation are used in the Blowdown Turbine facility. Turbine speed and translator motion are monitored by their respective digital encoders. Several vibrometers are mounted on the shaft and bearings to record vibrations during an exper-iment. The eddy current brake torque meter is instrumented with two load cells which provide a measure of shaft torque. The brake voltage and current are also recorded by the data acquisition system. A list of all instrumentation is provided in Table 2.2.
2.5.5 Transducer Calibration
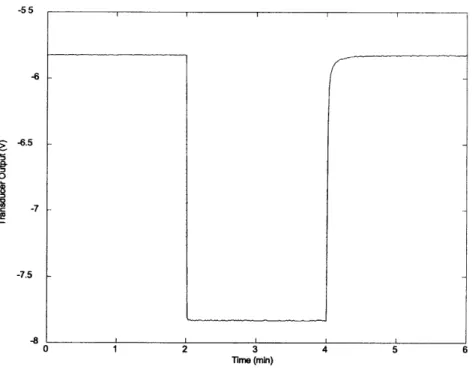
All differential pressure transducers are calibrated immediately after the supply tank is filled and at the conclusion of each test. Calibration data just before and after each experiment allows transducer drift to be quantified. Figure 2-9 shows a typical calibration trace of a differential pressure transducer. This figure and the calibration sequence are described below.
Table 2.2: Blowdown Turbine instrumentation.
Sensor Name Type Location
PREF150 PREF050 PREF300 FTACH ATACH VTOT ITOT IBRK DSTPOS ECBF,1-2 FBRING RBRING PTO,A-B PTCO PDMP PT2,A-C PNOZ TT2,A-C PTC1 PTC2V PTC2B PCCV PCCC PT45R,1-8 P45HUB P45A TTMFM1 TTNOZ,1-2 TTCO TTC1 TTC2B TTCBV TTCBC TTCCV TTCCC Absolute Pressure Absolute Pressure Absolute Pressure Digital Speed Analog Speed Excitation Current Current Digital Encoder Load Cells Vibrometer Vibrometer Differential Pressure Differential Pressure Differential Pressure Differential Pressure Differential Pressure Temperature Gauge Pressure Gauge Pressure Gauge Pressure Gauge Pressure Gauge Pressure Differential Pressure Differential Pressure Differential Pressure Temperature Temperature Temperature Temperature Temperature Temperature Temperature Temperature Temperature Supply Tank Test Section - Upstream
Coolant Supply Tank Shaft
Shaft
Eddy Current Brake Eddy Current Brake Eddy Current Brake Downstream Translator
Eddy Current Brake Forward Bearing
Rear Bearing Supply Tank Coolant Tank
Dump Tank Test Section - Upstream
Venturi Nozzle Test Section - Upstream Cooling System -Manifold
Cooling System - NGVs Cooling System - Blades Cooling System - NGVs Cooling System - Tip Casing
Downstream Translator Downstream Translator Test Section - Downstream Venturi Nozzle - Upstream
Venturi Nozzle Coolant Tank Exit Coolant System Manifold
Coolant System -Blades Coolant System - NGVs Coolant System - Tip Casing
Coolant System - NGVs Coolant System - Tip Casing "
-5 5 -6 -6.5 5 -7 I--7.5 S1 2 3 4 5 6 Time (min)
Figure 2-9: Typical differential pressure transducer calibration trace.
1. All transducers are provided a vacuum back-pressure reference by an external vacuum pump. For a post-fill calibration this produces a zero pressure differential across the transducers which are located inside the tunnel. For those in the supply or coolant tanks, a pressure differential equal to the initial tank pressure is recorded.
2. Data is taken at this condition for approximately two minutes as shown by the first segment of the trace in Figure 2-9.
3. After two minutes, the back-pressure reference is exposed to atmospheric pressure. Data is acquired for two minutes as shown in Figure 2-9.
4. After four minutes, the back-pressure reference is returned to vacuum where it remains for the experiment.
5. This procedure is repeated after the blowdown experiment has been completed.
These data provide a voltage change for each differential transducer which corresponds to the local atmospheric pressure. A transducer scale factor can then be computed. Transducer zeros are taken to be the average output prior to the opening of the main valve. The scale
and zero can then be used in the data reduction process via the linear calibration relation:
P = (Volts - Zero) Scale (2.6)
2.6
Data Acquisition
The data acquisition system monitors all instrumented channels at a sampling rate sufficient for capturing time scales of interest during the experiment. For aerodynamic performance measurements, 5 kHz is adequate. The system typically acquires data for 2-4 seconds depending on the experimental conditions being monitored. The current hardware includes a Pentium II 450 MHz computer which is programmed with LabVIEW lab automation software.
2.7
Summary
This chapter reviewed the MIT Blowdown Turbine test facility. Facility configuration and individual components were described as well as typical test procedures. Analysis for scal-ing of all relevant non-dimensional parameters was presented. Instrumentation and data acquisition were then discussed.
CHAPTER
3
FILM-COOLED TURBINE FABRICATION
3.1
Introduction
In a previous test series, an uncooled version of the ABB turbine was performance tested[8] [10]. In order to quantify the losses due to coolant flow injection, a film cooled turbine was fab-ricated and tested. This turbine should have a similar overall geometry (blade and NGV shape) to the uncooled turbine, but with film-cooling injection holes and all other associated passages. In this chapter, the fabrication of this film-cooled turbine is described.
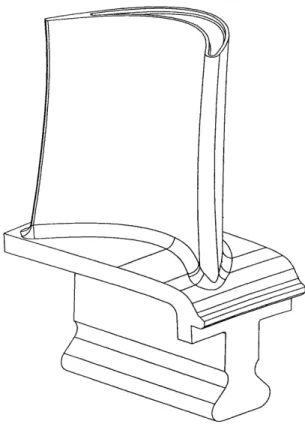
Due to monetary considerations and time restrictions, the existing uncooled turbine was converted to the film-cooled turbine. This was accomplished by the use of sophisticated machining techniques, such as electro-discharge machining (EDM) and laser machining. The uncooled turbine blade and NGV geometry can be seen in Figures 3-1 and 3-2. Fabrication of the film-cooled turbine proved to be difficult, costly, and time consuming. The complex geometry of the holes and passages pushed existing manufacturing technologies to their limits. The cooling hole geometries and machining techniques will be reviewed here.
3.2
Film-Cooled Turbine Geometry
3.2.1
Film-Cooled Turbine Blade
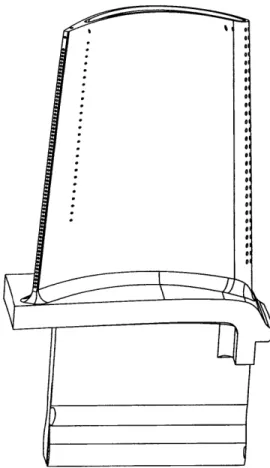
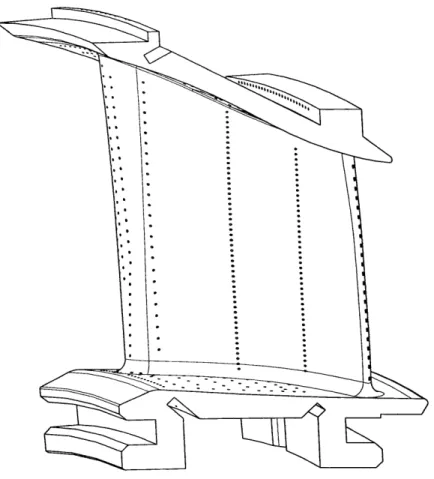
The scaled ABB film-cooled turbine blade can be seen in Figure 3-3. The blade cooling configuration consists of five rows of coolant injection holes: two on the leading edge, one on the suction surface, one on the pressure surface, and one directly out of the trailing edge.
Figure 3-1: ABB uncooled turbine blade.
Figure 3-3: ABB cooled turbine blade.
There are also "dust-holes" which are not part of any of the distinguishable rows. Each hole is also oriented at a compound angle. The numbers and sizes of the holes are summarized in Table 3.1. Some details are omitted due to their proprietary nature.
The internal passages of the actual ABB turbine have not been replicated. The purpose of this work is to study the effects of film-coolant injection; therefore, only simple manifold channels through the blade are needed. Two channels will be used to feed the blade cooling holes; one for the leading edge and suction surface rows, and one for the pressure surface
Table 3.1: Blade cooling holes.
Row Number of Holes Diameter Location
1 17 0.008" suction surface
2 29 0.008" leading edge
3 29 0.008" leading edge
4 26 0.008" suction surface
Figure 3-4: ABB cooled turbine NGV.
and trailing edge rows. These passages should provide a relatively constant wall thickness.
3.2.2 Film-Cooled Turbine Nozzle Guide Vane
The scaled ABB film-cooled nozzle guide vane can be seen in Figure 3-4. The NGV cooling configuration consists of 12 rows of coolant injection holes on the airfoil surface, as well as several holes on the upper and lower platforms. Like the blade, each hole is oriented at a compound angle. Table 3.2 summarizes the important features of this layout. Again, some details are omitted for proprietary reasons.
Like the cooled turbine blade, the internal passages of the actual ABB NGV have not been replicated. Two vertical channels were required to feed all of the airfoil surface cooling holes. Coolant will be supplied to the platform holes via manifolds above and below the locations where the NGVs mate to the facility.
3.2.3
Film-Cooled Turbine Tip Casing
The rotor tip casing (the outer annulus wall surrounding the blade tips) also requires film cooling holes. The actual ABB geometry could not be directly scaled and accommodated in the MIT Blowdown Turbine facility. As a result, a geometry which provided the same coolant flow, but could be fabricated for use in the Blowdown Turbine, was devised. This configuration consists of two rows of film cooling holes located at the leading and trailing edges of the tip casing ring. There are 1544 leading edge holes with a 0.012" diameter and
1200 trailing edge holes with a 0.015" diameter.
3.3
Electro-Discharge Machining
3.3.1
Introduction
Electro-discharge machining (EDM) is a process by which an electrode, usually made of a copper-tungsten alloy, is used to "burn" a detail into a metal piece. The piece which is to be machined is submerged in a water and oil solution while the energized electrode cuts the metal. This is required to keep the part cool and to flush away debris as it is burned away. Different types of metals respond differently to the EDM process and various burn rates can
Table 3.2: NGV cooling holes.
Row/Group Number of Holes Diameter Location
1 25 0.021" trailing edge 2 44 0.008" pressure surface 3 51 0.008" pressure surface 4 26 0.008" pressure surface 5 28 0.008" leading edge 6 21 0.008" leading edge 7 29 0.008" leading edge 8 19 0.008" leading edge 9 45 0.008" leading edge 10 42 0.008" leading edge 11 40 0.008" leading edge 12 22 0.008" leading edge A 107 0.008" upper platform B 91 0.008" lower platform
be achieved. The power used for burning a piece is set based on the type of material being cut, the desired rate of burn, and the desired finish. The quality of the finish is determined by the amount of "over-burn" provided by the electrode. The electrode does not actually come into contact with the part and does not apply any load. It is the field created by the electrode that actually burns the metal. The power of this field, or over-burn, can be adjusted to improve the finish of the cut. Over-burns of 0.002-0.020" are common.
There are two types of EDM processes; wire EDM and plunge, or vertical, EDM. Wire EDM is the simplest and fastest process. The electrode consists of a wire which passes through the material in the same fashion as conventional band saw. The disadvantage of this method is the physical constraint of the wire itself. This limits the work to two-dimensional details that pass through the entire part.
Plunge EDM is a slower and more complicated process, but can produce a more complex detail. The electrode is actually machined to the shape of the desired cut and then plunged vertically into the material. The detail of the cut is limited only by the ability to machine the electrode. Plunge EDM has a slower burn rate than a wire cut simply because there is significantly more material being removed at one time. Another difficulty with the vertical EDM process is the ability to remove debris as it burns away. With a wire cut there is a hole passing through the entire part allowing EDM fluid to flow through and remove debris. This is not always the case with plunge EDM causing it to be a slower process. If debris is not properly removed, the particles can become charged and cause additional burning. Both the plunge and wire EDM processes were used to manufacture the cooling manifold passages in the blades and NGVs. All EDM work was performed on two-axis Computer Numerical Control (CNC) machines by Johnson Precision Inc.
3.3.2 Blade Manifold Channels
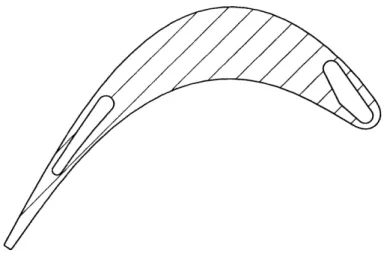
The blade cooling manifold channels proved to be challenging to fabricate. Figure 3-5 shows a cross section of these passages. The forward manifold was cut using plunge EDM while the rear was a wire cut.
Figure 3-5: Blade cooling manifold passages.
top of the part and another from the bottom. This was done to follow the contour of the leading edge which can be seen in Figure 3-1. An approximately constant wall thickness of 0.050" was maintained. However, this process required a high degree of accuracy so that the two plunges would mate correctly inside the blade. To achieve this, a complex fixture was designed to hold each blade in the identical position. The fixture and blade can be seen in Figure 3-6.
The rear channel was produced with a simple wire cut directly through the blade. A vertical plunge was not possible for this channel due to the slender geometry. An electrode with this geometry would actually burn itself away before passing through the part. The tolerances of this channel also required a high degree of precision, therefore the same fixture was used. The blade material also caused a problem with the EDM process. The parts were originally fabricated out of an aluminum casting alloy; AL-2618. This particular alloy contained sporadic impurities, or inclusions. When the electrode encountered these inclusions, the impurity would burn away creating a hole through the piece. As a result, several blades were destroyed in the EDM process.
3.3.3
Nozzle Guide Vane Manifold Channels
The NGV manifold passages were not as difficult to machine as the blade. A cross-section of these passages is shown in Figure 3-7. The relative ease of machining these details was a result of using only the wire EDM process. Again, precision cuts were required to maintain
Figure 3-6: Blade fixture for EDM.
a relatively constant wall thickness and a custom designed fixture was required. This is shown in Figure 3-8.
3.4
Laser Drilling
3.4.1 Introduction
Laser drilling was chosen to fabricate the film cooling holes due to its speed, precision, and ability to drill extremely small, deep holes. No other method was found to fabricate the 1/4 scale (0.008" diameter) ABB cooling holes. However, even the laser was not capable of drilling some of the holes in the scaled geometry. This was due to their large length-to-diameter ratios (L/D) and shallow angles. The laser was able to handle an L/D up to approximately 15. The limitations of the laser and contingency procedures for difficult holes will be discussed in later sections. The machines used for this work were of the 5-axis CNC type and all work was performed by Laser Services Inc.
Figure 3-7: NGV cooling manifold passages.