HAL Id: hal-00296445
https://hal.archives-ouvertes.fr/hal-00296445
Submitted on 14 Feb 2008
HAL is a multi-disciplinary open access
archive for the deposit and dissemination of
sci-entific research documents, whether they are
pub-lished or not. The documents may come from
teaching and research institutions in France or
abroad, or from public or private research centers.
L’archive ouverte pluridisciplinaire HAL, est
destinée au dépôt et à la diffusion de documents
scientifiques de niveau recherche, publiés ou non,
émanant des établissements d’enseignement et de
recherche français ou étrangers, des laboratoires
publics ou privés.
Chemical isolation in the Asian monsoon anticyclone
observed in Atmospheric Chemistry Experiment
(ACE-FTS) data
M. Park, W. J. Randel, L. K. Emmons, P. F. Bernath, K. A. Walker, C. D.
Boone
To cite this version:
M. Park, W. J. Randel, L. K. Emmons, P. F. Bernath, K. A. Walker, et al.. Chemical isolation in
the Asian monsoon anticyclone observed in Atmospheric Chemistry Experiment (ACE-FTS) data.
Atmospheric Chemistry and Physics, European Geosciences Union, 2008, 8 (3), pp.757-764.
�hal-00296445�
© Author(s) 2008. This work is distributed under the Creative Commons Attribution 3.0 License.
Chemistry
and Physics
Chemical isolation in the Asian monsoon anticyclone observed in
Atmospheric Chemistry Experiment (ACE-FTS) data
M. Park1, W. J. Randel1, L. K. Emmons1, P. F. Bernath2,3, K. A. Walker2,*, and C. D. Boone2 1National Center for Atmospheric Research, Boulder, Colorado, USA
2Department of Chemistry, University of Waterloo, Waterloo, Ontario, Canada 3Department of Chemistry, University of York, Heslington, York, UK
*now at: Department of Physics, University of Toronto, Toronto, Ontario, Canada
Received: 2 August 2007 – Published in Atmos. Chem. Phys. Discuss.: 25 September 2007 Revised: 8 January 2008 – Accepted: 16 January 2008 – Published: 14 February 2008
Abstract. Evidence of chemical isolation in the Asian monsoon anticyclone is presented using chemical con-stituents obtained from the Atmospheric Chemistry Exper-iment Fourier Transform Spectrometer instrument during summer (June–August) of 2004–2006. Carbon monoxide (CO) shows a broad maximum over the monsoon anticy-clone region in the upper troposphere and lower stratosphere (UTLS); these enhanced CO values are associated with air pollution transported upward by convection, and confined by the strong anticyclonic circulation. Profiles inside the anticyclone show enhancement of tropospheric tracers CO, HCN, C2H6, and C2H2 between ∼12 to 20 km, with
max-ima near 13–15 km. Strong correlations are observed among constituents, consistent with sources from near-surface pol-lution and biomass burning. Stratospheric tracers (O3, HNO3
and HCl) exhibit decreased values inside the anticyclone be-tween ∼12–20 km. These observations are further evidence of transport of lower tropospheric air into the UTLS re-gion, and isolation of air within the anticyclone. The rel-ative enhancements of tropospheric species inside the an-ticyclone are closely related to the photochemical lifetime of the species, with strongest enhancement for shorter lived species. Vertical profiles of the ratio of C2H2/CO (used to
measure the relative age of air) suggest relatively rapid trans-port of fresh emissions up to the tropopause level inside the anticyclone.
1 Introduction
The Asian summer monsoon is the dominant circulation fea-ture spanning Southeast Asia to Afghanistan during North-ern Hemisphere (NH) summer. The Asian monsoon
circu-Correspondence to: M. Park (mijeong@ucar.edu)
lation is a thermally direct circulation dominated by a low-level thermal low and an upper-low-level anticyclone (Krishna-murti and Bhalme, 1976). Flanked by the equatorial and sub-tropical jets, the anticyclone acts as strong transport barrier to chemical constituents, such as water vapor (Dethof et al., 1999) and ozone (Randel and Park, 2006), in the upper tro-posphere and lower stratosphere (UTLS). Carbon monoxide transported upwards by the monsoon convection is trapped within the monsoon anticyclone in the upper troposphere (Li et al., 2005). Recent satellite observations have highlighted the strong isolation of carbon monoxide within the monsoon anticyclone, extending into the lower stratosphere (Fu et al., 2006; Park et al., 2007).
The Atmospheric Chemistry Experiment (ACE) is a Canadian-led satellite mission launched in 2003. The ACE Fourier Transform Spectrometer (ACE-FTS) instrument pro-vides vertical profiles of a few dozen chemical species cover-ing the middle troposphere to thermosphere (∼10–100 km), with data available from the polar regions to the tropics (Bernath et al., 2005). In this study we use ACE-FTS mea-surements to explore the consequences of vertical transport within the Asian monsoon anticyclone. In particular, we focus on the ACE-FTS measurements of carbon monoxide (CO), hydrogen cyanide (HCN), ethane (C2H6)and
acety-lene (C2H2), which have common sources of biomass
burn-ing (Andreae and Merlet, 2001) and major sinks of reac-tion with hydroxyl radical (Logan et al., 1981). The pho-tochemical lifetimes of these species span the range of 0.5– 5 months, which make them useful as tracers of transport in the troposphere and lower stratosphere. We also include analyses of methyl chloride (CH3Cl), which is produced by
biomass burning and has a lifetime of about a year (Blake et al., 1996; Yoshida et al., 2004), and carbonyl sulfide (OCS), with sources of anthropogenic and oceanic emissions (Watts, 2000) and a lifetime of several years (Chin and Davis, 1995; Blake et al., 2004).
758 M. Park et al.: Chemical isolation in the Asian monsoon anticyclone
Table 1. Photochemical lifetimes.
Species Lifetime CO 2–3 monthsa HCN 5 monthsc,d,e C2H6 1–2 monthsb,d C2H2 0.5–1 monthsa,b CH3Cl 1 yearb,f,i OCS 4.3 yearsg,h aXiao et al., 2007 bLogan et al., 1981 cLi et al., 2000 dZhao et al., 2002 eSingh et al., 2003 fBlake et al., 1996 gBlake et al., 2004 hChin and Davis, 1996 iYoshida et al., 2004
Numerous observational studies of tropospheric pollutants have been made based on aircraft observations (e.g., Smyth et al., 1996; Blake et al., 1996; Talbot et al., 1999; Singh et al., 2003; Russo et al., 2003). However, space-based obser-vations are limited and relatively new. Tropospheric CO has been obtained from several satellite instruments, including Measurement of Air Pollution from Satellites (Connors et al., 1999), Interferometric Monitor for Greenhouse gases (Cler-baux et al., 2003), Measurements Of Pollution In The Tropo-sphere (Deeter et al., 2004; Edwards et al., 2006), Microwave Limb Sounder (Waters et al., 2006), and Tropospheric Emis-sion Spectrometer (Beer, 2006), and these data have been used for studies of tropospheric pollution and long-range transport. However, ACE–FTS has the advantage of simulta-neous retrieval of numerous species in addition to CO. A few previous studies have used ACE-FTS measurements of CO, HCN, C2H6, C2H2, and methanol (CH3OH) to study the
ef-fect of biomass burning emissions in the UTLS region (Rins-land et al., 2005; Dufour et al., 2006; Coheur et al., 2007), and our work extends those analyses with focus on the Asian monsoon region.
2 Data description
The ACE mission was launched on 12 August 2003 into a high inclination (74◦) circular orbit at 650 km altitude. The high resolution infrared ACE-FTS measures solar absorption spectra from 750 to 4400 cm−1 using the solar occultation technique. The primary goal of the ACE mission is focused on polar ozone chemistry and dynamics, and the majority of measurements are obtained over high latitudes (Bernath et al., 2005). The vertical field of view of the instrument is 3 km, and measurements during each occultation are ob-tained with a vertical sampling of 2–6 km (depending on the angle of the sun with respect to the spacecraft velocity vec-tor); the constituent profile retrievals are available on a (over-sampled) 1 km vertical grid (Boone et al., 2005). The data here are based on version 2.2 retrievals (including the up-dated ozone). The C2H6and C2H2data are research
prod-ucts retrieved to higher altitudes (up to 21 km for C2H6and
18 km for C2H2)for this study, and we focus on observations
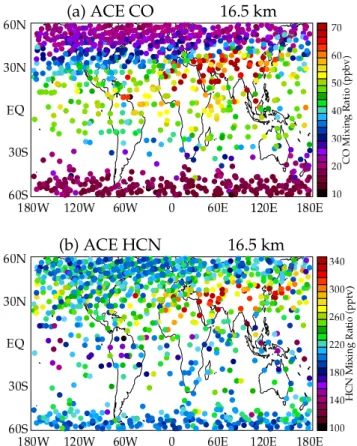
Fig. 1. Global map of (a) CO and (b) HCN mixing ratios at 16.5 km
for June–August (2004–2006). Approximate data range is 10–70 parts per billion by volume (ppbv) for CO and 100–340 parts per trillion by volume (pptv) for HCN.
during NH summer (June–August) of 2004–2006. Due to the orbit geometry, most of the low latitude observations occur in August during this period.
The chemical species analyzed here include tropospheric constituents CO, HCN, C2H6, C2H2, OCS, and CH3Cl, and
stratospheric species O3, HNO3, and HCl. The
photochemi-cal lifetimes of these constituents, which span the range from ∼1 month to longer than 1 year, are provided in Table 1. These numbers are estimated in the troposphere but are al-most constant up to the UTLS region. For data screening purposes, we exclude profiles with values outside of three-sigma variance between 60◦S and 60◦N. This method typ-ically excludes less than 1% of profiles depending on the species. The estimated fitting errors of version 2.2. CO and version 2.2 updated ozone are 2-6% and 2–7% in the UTLS region, respectively. The CO retrieval errors are better than 5% from the upper troposphere to 40 km (Clerbaux et al., 2007). The ACE-FTS ozone reveals a high bias of up to 40% in the comparison with non-coincident aircraft data in the up-per troposphere (Hegglin et al., 2007). Paup-pers detailing the validation studies for version 2.2 products (including the up-dated ozone, see Dupuy et al., 2008) will be available in a special issue of Atmos. Chem. Phys. on validation of ACE.
Fig. 2. Scatter plot of ACE CO (16.5 km) versus Ertel’s
poten-tial vorticity (EPV) at 100 hPa calculated from the NCEP/NCAR reanalysis data between 20◦–40◦N latitude. High CO (≥60 ppbv) values are marked as dots and low CO (<60 ppbv) values are shown as pluses, respectively.
3 Chemical isolation in the anticyclone
Figure 1a shows CO mixing ratio amounts at 16.5 km for all of the ACE-FTS observations during June-August 2004– 2006. The majority of points at mid to high latitudes lie in the stratosphere (where CO≤20 parts per billion by volume, ppbv) and in the upper troposphere (where CO ranges 40– 50 ppbv, see Clerbaux et al., 2005). There is a broad maxi-mum in CO over the Asian monsoon region (0◦–120◦E and 10◦–40◦N), and a similar maximum is evident for altitudes ∼12–20 km (not shown). HCN mixing ratios (Fig. 1b) also exhibit a maximum in this region, roughly coincident with the CO maximum. Daily observations of CO from MLS data have demonstrated that CO maxima at 100 hPa (∼16 km) oc-cur within the Asian monsoon anticyclone throughout sum-mer (Li et al., 2005; Park et al., 2007). Based on these pre-vious observations, it is likely that the highest CO values seen in Fig. 1a represent individual ACE-FTS measurements within the anticyclone. To examine the behavior of other at-mospheric constituents in the monsoon anticyclone, we use the CO values to identify profiles within the boundary of the anticyclone (i.e., the high values in Fig. 1a). Profiles “inside” are defined where CO is higher than 60 ppbv between 0◦– 120◦E and 10◦–40◦N at 16.5 km (see Fig. 1a) and the rest of the profiles between 10◦–40◦N are regarded as “outside” the anticyclone (representing background conditions). As an additional confirmation that these high CO values occur within the anticyclone, we calculated Ertel’s potential vor-ticity (EPV) at the individual ACE observation locations us-ing National Centers for Environmental Prediction/National Center for Atmospheric Research (NCEP/NCAR) reanalysis
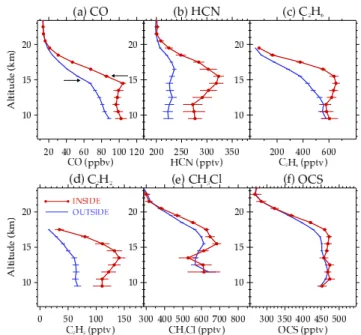
Fig. 3. Average profile of tropospheric tracers ((a) CO, (b) HCN, (c) C2H6, (d) C2H2, (e) CH3Cl, and (f) OCS) inside (solid) and
outside (dashed) of the monsoon anticyclone, respectively. Two-sigma standard error from the mean is denoted as solid line.
data, and Fig. 2 shows a scatter plot of the CO-EPV relation-ship for all the observations over 20◦–40◦N. The monsoon anticyclone is in general characterized by a region of low EPV (Randel and Park, 2006). Figure 2 shows an overall anticorrelation between CO and EPV, such that the high CO measurements (dots) are primarily associated with low EPV, i.e., near or within the anticyclone. Based on this definition, there are ∼40 profiles inside and ∼240 profiles outside the anticyclone for observations over June–August 2004–2006.
We compare in Fig. 3 the average vertical profiles of tro-pospheric constituents (CO, HCN, C2H6, C2H2, CH3Cl, and
OCS) inside and outside of the anticyclone, respectively. For each group of profiles we calculate the mean and the standard error of the mean (the sample standard deviation, divided by the square root of the number of observations, shown as error bars in Fig. 3). Substantial enhancements within the anticy-clone are observed for CO, HCN, C2H6, and C2H2in Fig. 3,
with significant differences up to ∼20 km. While the outside or background profiles exhibit monotonic decreases with alti-tude, profiles inside the anticyclone show conspicuous max-ima near 15 km for CO, HCN and C2H6, and near 13 km for
C2H2 (which has a significantly shorter lifetime, Table 1).
The long-lived tracers (CH3Cl and OCS) show slight
en-hancements within the anticyclone over ∼14–18 km (Fig. 3e and f). The higher mixing ratios within the anticyclone prob-ably result from a combination of rapid vertical transport and horizontal confinement (Li et al., 2005; Randel and Park, 2006), and the elevated mixing ratios can be regarded as “fin-gerprints” of the near-surface pollutant concentrations. In
760 M. Park et al.: Chemical isolation in the Asian monsoon anticyclone
Fig. 4. Same as Fig. 3 but for stratospheric tracers ((a) O3, (b)
HNO3and (c) HCl). Note the stratospheric tracers have log-scale x-axis.
contrast, the outside or background profiles represent pho-tochemically aged air, so that the inside-outside differences may be dependent on the lifetime of the individual species (as explored below). We note that the average mixing ra-tios shown in Fig. 3 are within the range of those obtained in aircraft field measurements in the lower and middle tropo-sphere (Smyth et al., 1999; Blake et al., 1999; Singh et al., 2003; Xiao et al., 2007).
Figure 4 compares inside versus outside profiles for the stratospheric tracers – O3, HNO3 and HCl. Each of these
tracers shows reduced mixing ratios inside the anticyclone over ∼12–20 km compared to outside profiles, and this be-havior is consistent with enhanced transport of tropospheric air into the anticyclone. These observations are consistent with the relative minimum in ozone within the anticyclone shown in Randel and Park (2006) and Park et al. (2007).
Tracer-tracer correlations are useful to diagnose air mass characteristics and relationships among different species. Figure 5 shows scatter plots of tropospheric tracers versus CO, for HCN, C2H6, C2H2, OCS, and CH3Cl (for data at
16.5 km). Overall, each of the tropospheric tracers show strong correlations with CO, with high CO values inside the anticyclone (orange plus signs) associated with high values of other species. C2H6and C2H2exhibit relatively compact
correlations with CO, suggesting similar sources for these species (Blake et al., 2003). There is significantly more scatter in the HCN versus CO diagram than other species (Fig. 5a), which is similar to results from the TRACE-P air-craft observations, and this may be a signature of different sources and sinks for HCN and CO (Singh et al., 2003). CH3Cl and OCS also exhibit some correlation with CO, but
relatively smaller differences between inside and outside pro-files. Figure 5f shows a scatter plot for two stratospheric trac-ers (HCl vtrac-ersus O3), showing a highly compact relationship.
This occurs due mainly to the stratospheric chemical origin of the two species and long lifetime in the upper troposphere (Marcy et al., 2004). Low ozone inside the anticyclone is also correlated with high CO (not shown). The compact re-lationships between ozone and the other stratospheric tracers (e.g., HF and HNO3)are consistently found between 15 and
18 km.
Fig. 5. Scatter plots of CO (ppbv) versus (a) HCN (pptv), (b) C2H6
(pptv), (c) C2H2(pptv), (d) CH3Cl (pptv) and (e) OCS (pptv), and (f) O3(ppbv) versus HCl (ppbv) at 16.5 km. Pluses indicate
mea-surements inside and dots indicate outside of the monsoon anticy-clone, respectively. The dashed line in each panel is derived from the photochemical lifetimes of each species (see text for detail).
The compact linear relationships among CO, C2H6 and
C2H2 in Fig. 5 are consistent with common sources from
biomass burning. In this case chemical loss is the primary mechanism that determines the slope of the scatter plots, which in turn is related to the relative chemical lifetimes of the species (Ehhalt et al., 1998). We test this in a simple way, by including a line in the scatter plots associated with the respective e-folding time of the two species assuming χi=χ0×exp (−τco/τi). Here χi represents the ith chemical species, χ0represents the initial concentration, τcoand τiare the chemical lifetimes of CO and the ith chemical species, respectively. The initial concentrations are set to be the max-ima for CO and the ith species, τco is fixed as 2.5 months, and the other τi lifetimes are taken as the mean values from Table 1. These slopes for each of the tropospheric tracers are included in Fig. 5. Note that these slopes are linear on a log-log plot (Ehhalt et al., 1998), but appear logarithmic on the linear axes in Fig. 5. Overall there is quite reasonable agreement between the theoretical curves and the observed distributions for both C2H6and C2H2versus CO. As noted
above, there is significantly more scatter in the HCN versus CO distribution (and likewise for CH3Cl versus CO),
prob-ably signifying distinct sources, but the overall distribution follows the respective slopes calculated from the lifetimes. For OCS, there is less agreement with the theoretical curve, but the application of such an idealized model is questionable for such a long lifetime (over 4 years for OCS). However, the overall good agreement with theory for the other tropo-spheric tracers is consistent with the differences between air inside and outside the anticyclone being primarily a result of relatively young air inside versus photochemically aged air outside. Also, the agreement in slopes is consistent with the approximate lifetimes of the constituents as listed in Table 1.
Fig. 6. (a) Normalized difference between average profiles inside
and outside the anticyclone for the tropospheric tracers, i.e., CO (solid), HCN (dotted), C2H6(dashed), and C2H2(dash dot). (b)
Ratio of C2H2/CO inside (open circle) and outside (plus) the
anti-cyclone, respectively.
In order to compare the average vertical profiles inside and outside the anticyclone among the species, we calculate the differences between the mean profiles in Fig. 3, and then nor-malize the differences for each tropospheric constituent to a maximum value of 1.0 (Fig. 6a). Here we focus on the species CO, HCN, C2H6, and C2H2,which show the largest
enhancements in Fig. 3. The tracer differences in Fig. 6a have maxima near 15 km, and the exact altitudes of maximum val-ues differ somewhat among the tracers (∼15 km for CO and HCN, ∼17 for C2H6 and ∼13 km for C2H2), although the
significance of these differences is unclear given the ∼3 km vertical resolution of the ACE-FTS data. We also include in Fig. 6b the ratio of C2H2/CO for the inside and outside
pro-files, as an indicator of the relative age of an air mass (Smyth et al., 1999; Xiao et al., 2007). The typical range of the ratio is 0.2–2.2 (pptv/ppbv), consistent with the data in Fig. 6b, and a ratio less than one indicates photochemically aged and well-mixed air (Talbot et al., 1999). The C2H2/CO ratio
in-side the anticyclone in Fig. 6b is larger than one, indicating relatively young air transported up to ∼16 km. The ratio is less than one outside the anticyclone, signifying photochem-ically aged and well-mixed air mass as the background.
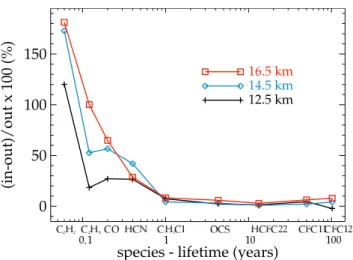
The level of enhancement inside the anticyclone with respect to the background can be defined as 1[X]/[X]outside5100, where [X] represent the constituent
mixing ratio and 1[X] is [X]inside−[X]outside(see Coheur et
al., 2007). The enhancement of tropospheric tracers inside the anticyclone is compared in Fig. 7 for different altitudes, plotted as a function of lifetime of the respective species. The enhancement is larger for the shorter-lived constituents and also systematically increases with altitude for C2H2, C2H6
and CO. The C2H2level increases up to 190% in Fig. 7 and
it can be as large as 2200% for a young biomass burning
Fig. 7. Level of enhancement (%) of the nine tropospheric
trac-ers at 12.5, 14.5 and 16.5 km. The log-scale x-axis represents the chemical lifetime of the tracers in years (CH3Cl – 1 year).
Fig. 8. Level of enhancement (%) of the stratospheric tracers, O3
(solid), HNO3(dashed), and HCl (dash dot).
plume (Coheur et al., 2007). The overall increased enhance-ment for shorter lifetimes is consistent with relatively young air inside the anticyclone, and older air in the background (as implied for the distributions seen in Fig. 5). There is also a systematic increase in enhancement with altitude over 12– 17 km for the shorter-lived species; this may be a signature of systematically older air with higher altitude for the outside or background profiles.
Figure 8 shows the level of enhancement for the strato-spheric tracers. Here the values are negative because these tracers are depleted within the anticyclone as shown in Figs. 4 and 5. There are systematic decreases in the stratospheric tracers over ∼11–20 km, with O3 and HNO3
762 M. Park et al.: Chemical isolation in the Asian monsoon anticyclone
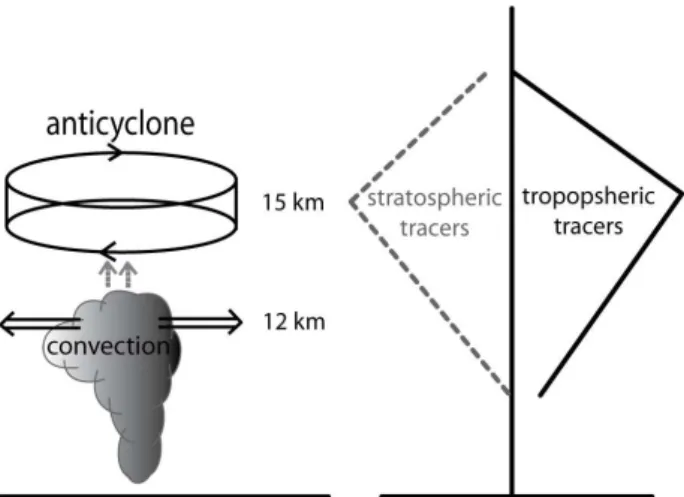
Fig. 9. Schematic diagram showing (left) level of maximum
con-vective outflow (∼12 km) versus monsoon anticyclonic circulation (∼15 km). (Right) Level of maximum increase (decrease) in the tropospheric (stratospheric) tracers.
decreases up to ∼40% and HCl decreases near ∼60%. The vertical profiles of these changes are consistent with the tro-pospheric tracer enhancement seen in Fig. 6a, and the strato-spheric tracers provide further evidence of transport of lower tropospheric air to altitudes near and above the tropopause.
4 Summary and discussion
The Asian summer monsoon circulation acts as a transport barrier to the chemical species from upper troposphere to lower stratosphere during NH summer (Li et al., 2005; Ran-del and Park, 2006; Park et al., 2007). Due to vertical transport from deep convection and strong isolation within the anticyclone, chemical constituents often show relative maxima or minima over the monsoon region. In this study, we show further evidence of chemical isolation in the an-ticyclone using chemical constituents observed by the ACE-FTS for the period covering summer (June–August) of 2004– 2006. ACE-FTS data allow study of constituents with a va-riety of photochemical lifetimes, and provide information on the detailed vertical structure within the anticyclone.
CO vertical profiles show significant enhancement over the monsoon anticyclone from ∼12–20 km altitude. The HCN profiles show maxima almost in the same region as CO. Using the clear signal of high CO (Fig. 1a), we define pro-files to be “inside” the anticyclone where CO is higher than the threshold (60 ppbv at 16.5 km) and term “outside” the an-ticyclone to be the rest of the observations over the latitude band 10◦–40◦N. The observations with enhanced CO are as-sociated with relatively low potential vorticity (Fig. 2), con-sistent with the region of the anticyclone. The selection of “inside” profiles is not very sensitive to the threshold CO val-ues chosen in this study. Averaged profiles inside the
anticy-clone show strong enhancements for the tropospheric tracers CO, HCN, C2H6, and C2H2over approximately 10–20 km
(Figs. 3 and 6), with relative maxima near 15 km (some-what lower for C2H2). Relatively weak enhancements
in-side the anticyclone near 15 km are also observed for CH3Cl
and OCS. There are corresponding decreases in stratospheric tracers (O3, HNO3and HCl) inside the anticyclone over the
same altitude range (Figs. 4 and 8).
The maxima (minima) in the tropospheric (stratospheric) constituents over 13–15 km may suggest that this is the alti-tude of strongest outflow from deep convection in the mon-soon region. However, this altitude is somewhat higher than the maximum convective outflow level (∼12 km) inferred from tropical radiative balance (Folkins and Martin, 2005) or cloud height estimates (Gettelman et al., 2002; Liu and Zipser, 2005). Figure 9 shows a schematic diagram illus-trating the vertical profiles of the circulation features in the monsoon region compared with the tracer profiles identified in this study. The right panel of Fig. 9 shows the level of max-imum increase (decrease) in the tropospheric (stratospheric) tracers, which is close to ∼15 km. The left panel high-lights the main convective outflow level near ∼12 km, with the strongest closed circulation of the anticyclone somewhat above this level (∼12–16 km; Randel and Park, 2006). The mechanism(s) of vertical transport above 12 km are a subject of ongoing research, but likely involve large-scale circula-tion in the anticyclone (Park et al., 2007), overshooting deep convection (Dessler and Sherwood, 2004), or the dynami-cal divergence mechanism discussed in Folkins et al. (2007). Although the detailed mechanism(s) leading to formation and maintenance of the tracer profiles are not understood at present, the ACE-FTS data provide detailed observations to test idealized or more realistic models.
There exist substantial correlations between CO and the tropospheric tracers in the UTLS region. Compact correla-tions are found between CO and C2H6, and between CO and
C2H2, suggesting common sources for these species.
Some-what higher scatter is observed between CO and HCN, con-sistent with aircraft observations, and this may signify dif-ferent sources for the two species. The observed slopes of the correlations among different tropospheric species are in reasonable agreement with calculations based on published lifetimes (Fig. 5), and this demonstrates that the differences between profiles inside and outside of the anticyclone are consistent with distinct photochemical ages. This conclusion is consistent with the ratio of (C2H2/CO) in Fig. 6b, which
suggests relatively younger air inside the anticyclone. The relative enhancements of tropospheric species inside the anticyclone are closely related to the photochemical life-time of the species (Fig. 7). The largest enhancements are ob-served for species with the shortest lifetimes (namely C2H2),
with relatively small differences found for lifetimes of 1 year or longer. The enhancements are also larger for higher alti-tudes (between 12 and 17 km), and this may reflect the in-crease in photochemical age with altitude of species in the
background atmosphere. Stratospheric tracers show a ∼40– 60% decrease within the anticyclone over ∼11–20 km alti-tude range.
Acknowledgements. This work was partially supported under the NASA ACMAP and EOS programs. We thank Cathy Clerbaux and Ken Bowman for discussions and comments on the manuscript. Funding for ACE is provided primarily by the Canadian Space Agency. The National Center for Atmospheric Research is operated by the University Corporation for Atmospheric Research under sponsorship of the National Science Foundation.
Edited by: M. G. Lawrence
References
Andreae, M. O. and Merlet, P.: Emission of trace gases and aerosols from biomass burning, Global Biogeochem. Cy., 15(4), 955–966, 2001.
Beer, R.: TES on the Aura Mission: Scientific Objectives, Mea-surements, and Analysis Overview, IEEE T. Geosci. Remote, 44, 1102–1105, 2006.
Bernath, P. F., McElroy, C. T., Abrams, M. C., et al.: Atmospheric Chemistry Experiment (ACE): Mission overview, Geophys. Res. Lett., 32, L15S01, doi:10.1029/2005GL022386, 2005.
Blake, N. J., Blake, D. R., Sive, B. C., et al.: Biomass burning emissions and vertical distribution of atmospheric methyl halides and other reduced carbon gases in the South Atlantic region, J. Geophys. Res., 101, 24 151–24 164, 1996.
Blake, N. J., Blake, D. R., Wingenter, O. W., et al.: Influence of southern hemispheric biomass burning on midtropopsheric dis-tributions of nonmethane hydrocarbons and selected halocarbons over the remote South Pacific, J. Geophys. Res., 104, 16 213– 16 232, 1999.
Blake, N. J., Blake, D. R., Simpson, I. J., et al.: NMHCs and halocarbons in Asian continental outflow during the Trans-port and Chemical Evolution over the Pacific (TRACE-P) Field Campaign: Comparison With PEM-West B, J. Geophys. Res., 108(D20), 8806, doi:10.1029/2002JD003367, 2003.
Blake, N. J., Streets, D. G., Woo, J.-H., et al.: Carbonyl sulfide and carbon disulfide: Large-scale distributions over the western Pacific and emissions from Asia during TRACE-P, J. Geophys. Res., 109, D15S05, doi:10.1029/2003JD004259, 2004. Boone, C. D., Nassar, R., Walker, K. A., Rochon, Y., McLeod, S.
D., Rinsland, C. P., and Bernath, P. F.: Retrievals for the Atmo-spheric Chemistry Experiment Fourier Transform Spectrometer, Appl. Opt. 44, 7218–7231, 2005.
Chin, M. and Davis, D. D.: A reanalysis of carbonyl sulfide as a source of stratospheric background sulfur aerosol, J. Geophys. Res., 100(D5), 8993–9006, doi:10.1029/95JD00275, 1995. Clerbaux, C., Hadji-Lazaro, J., Turquety, S., M´egie, G., and Coheur,
P.-F.: Trace gas measurements from infrared satellite for chem-istry and climate applications, Atmos. Chem. Phys., 3, 1495– 1508, 2003,
http://www.atmos-chem-phys.net/3/1495/2003/.
Clerbaux, C., Coheur, P. –F., Hurtmans, D., Barret, B., Carleer, M., Colin, R., Semeniuk, K., McConnell, J. C., Boone, C., and Bernath, P.: Carbon monoxide distribution from the
ACE-FTS solar occultation measurements, Geophys. Res. Lett., 32, L16S01, doi:10.1029/2005GL022394, 2005.
Clerbaux, C., George, M., Turquety, S., Walker, K. A., et al.: CO measurements from the ACE-FTS satellite instrument: data anal-ysis and validation using ground-based, airborne and spaceborne observations, Atmos. Chem. Phys. Discuss., 7, 15 277–15 340, 2007.
Coheur, P.-F., Herbin, H., Clerbaux, C., Hurtmans, D., Wespes, C., Carleer, M., Turquety, S., Rinsland, C. P., Remedios, J., Hauglus-taine, D., Boone, C. D., and Bernath, P. F.: ACE-FTS observation of a young biomass burning plume: first reported measurements of C2H4, C3H6O, H2CO and PAN by infrared occultation from space, Atmos. Chem. Phys., 7, 5437–5446, 2007,
http://www.atmos-chem-phys.net/7/5437/2007/.
Connors, V. S., Gormsen, B. B., Nolf, S., and Reichle, H. G., et al.: Spaceborne observations of the global distribution of carbon monoxide in the middle troposphere during April and October 1994, J. Geophys. Res., 104, 21 455–21 470, 1999.
Deeter, M. N., Emmons, L. K., Edwards, D. P., Gille, J. C., and Drummond, J. R.: Vertical resolution and information content of CO profiles retrieved by MOPITT, Geophys. Res. Lett., 31, L15112, doi:10.1029/2004GL020235, 2004.
Dessler A. E. and Sherwood, S. C.: Effect of convection on the summertime extratropical lower stratosphere, J. Geophys. Res., 109, D23301, doi:10.1029/2004JD005209, 2004.
Dethof, A., O’Neill, A., Slingo, J. M., and Smit, H. G. J.: A mech-anism for moistening the lower stratosphere involving the Asian summer monsoon, Q. J. Roy. Meteor. Soc., 125, 1079–1106, 1999.
Dufour, G., Boone, C. D., Rinsland, C. P., and Bernath, P. F.: First space-borne measurements of methanol inside aged south-ern tropical to mid-latitude biomass burning plumes using the ACE-FTS instrument, Atmos. Chem. Phys., 6, 3463–3470, 2006, http://www.atmos-chem-phys.net/6/3463/2006/.
Dupuy, E., Walker, K. A., J. Kar, J., et al.: Validation of ozone mea-surements from the Atmospheric Chemistry Experiment (ACE), Atmos. Chem. Phys. Discuss., 8, 2513–2656, 2008,
http://www.atmos-chem-phys-discuss.net/8/2513/2008/. Edwards, D. P., Emmons, L. K., Gille, J. C., Chu, A.,
et al.: Satellite-observed pollution from Southern Hemi-sphere biomass burning, J. Geophys. Res., 111, D14312, doi:10.1029/2005JD006655, 2006.
Ehhalt, D. H., Rohrer, F., Wahner, A., Prather, M. J., and Blake, D. R.: On the use of hydrocarbons for the determination of tropo-spheric OH concentrations, J. Geophys. Res., 103(D15), 18 981– 18 998, 10.1029/98JD01106, 1998.
Folkins, I., and Martin, R.: The vertical structure of tropical con-vection and its impact on the budgets of water vapor and ozone, J. Atmos. Sci., 62, 1560–1573, 2005.
Folkins, I., Fueglistaler, S., Lesins, G., and Mitovski, T.: A low-level circulation in the tropics, J. Atmos. Sci., accepted, 2007. Fu, R., Hu, Y., Wright, J. S., Jiang, J. H., Dickinson, R. E., Chen,
M., Filipiak, M., Read, W. G., Waters, J. W., and Wu, D. L.: Short circuit of water vapor and polluted air to the global strato-sphere by convective transport over the Tibetan Plateau, Proc. Nat. Acad. Sci., 103, 5664–5669, 2006.
Gettelman, A., Salby, M. L., and Sassi, F.: Distribution and influ-ence of convection in the tropical tropopause region, J. Geophys. Res., 107(D10), 4080, doi:10.1029/2001JD001048, 2002.
764 M. Park et al.: Chemical isolation in the Asian monsoon anticyclone
Hegglin, M. I., Bernath, P. F., Boone, C. D., Daffer, W. H., Hoor, P., Manney, G. L., Schiller, C., Strong, K., and Walker, K. A.: Vali-dation of ACE-FTS satellite data in the upper troposphere/lower stratosphere (UTLS) using non-coincident measurements, At-mos. Chem. Phys. Discuss., 7, 13 861–13 882, 2007.
Jacob, D. J., Crawford, J. H., Kleb, M. M., Connors, V. S., Bendura, R. J., Raper, J. L., Sachse, G. W., Gille, J. C., Emmons, L., and Heald, C. L.: The Transport and Chemical Evolution over the Pacific (TRACE-P) aircraft mission: design, execution, and first results, J. Geophys. Res., 108(D20), 1–19, 2003.
Krishnamurti, T. N. and Bhalme, H. N.: Oscillations of a monsoon system. Part I. Observational aspects, J. Atmos. Sci., 33, 1937– 1954, 1976.
Li, Q., Jacob, D. J., Bey, I., Yantosca, R. M., Zhao, Y., Kondo, Y., and Notholt, J.: Atmospheric hydrogen cyanide (HCN): Biomass burning source, ocean sink?, Geophys. Res. Lett., 27, 357–360, 2000.
Li, Q., Jiang, J. H., Wu, D. L., Read, W. G., Livesey, N. J., Wa-ters, J. W., Zhang, Y., Wang, B., Filipiak, M. J., Davis, C. P., Turquety, S., Wu, S., Park, R. J., Yantosca, R. M., and Jacob, D. J.: Trapping of Asian pollution by the Tibetan anticyclone: A global CTM simulation compared with EOS MLS observations, Geophys. Res. Lett., 32, L14826, doi:10.1029/2005GL022762, 2005.
Liu, C. and Zipser, E. J.: Global distribution of convection pene-trating the tropical tropopause, J. Geophys. Res., 110, D23104, doi:10.1029/2005JD006063, 2005.
Logan, J. A., Prather, M. J., Wofsy, S. C., and McElroy, M. B.: Tropospheric chemistry – A global perspective, J. Geophys. Res., 86, 7210–7254, 1981.
Marcy, T. P., Fahey, D. W., Gao, R. S., Popp, P. J., Richard, E. C., Thompson, T. L., Rosenlof, K. H., Ray, E. A., Salawitch, R. J., Atherton, C. S., Bergmann, D. J., Ridley, B. A., Wein-heimer, A. J., Loewenstein, M., Weinstock, E. M., Mahoney, M. J.: Quantifying Stratospheric Ozone in the Upper Troposphere with in Situ Measurements of HCl, Science, 9, 304, 261–265, doi: 10.1126/science.1093418, 2004.
Park, M., Randel, W. J., Gettelman, A., Massie, S. T., and Jiang, J. H.: Transport above the Asian summer monsoon anticyclone inferred from Aura MLS tracers, J. Geophys. Res, 112, D16309, doi:10.1029/2006JD008294, 2007.
Randel, W. J. and Park, M.: Deep convective influence on the Asian summer monsoon anticyclone and associated tracer variability observed with Atmospheric Infrared Sounder (AIRS), J. Geo-phys. Res., 111, D12314, doi:10.1029/2005JD006490, 2006.
Rinsland, C. P., Dufour, G., Boone, C. D., Bernath, P. F., and Chiou, L.: Atmospheric Chemistry Experiment (ACE) measure-ments of elevated Southern Hemisphere upper tropospheric CO, C2H6, HCN, and C2H2 mixing ratios from biomass burning
emissions and long-range transport, Geophys. Res. Lett., 32, L20803, doi:10.1029/2005GL024214, 2005.
Singh, H. B., Salas, L., Herlth, D., Kolyer, R., Czech, E., Viezee, W., Li, Q., Jacob, D. J., Blake, D., Sachse, G., Harward, C. N., Fuelberg, H., Kiley, C. M., Zhao, Y., and Kondo, Y.: In situ measurements of HCN and CH3CN over the Pacific Ocean: Sources, sinks, and budgets, J. Geophys. Res., 108(D20), 8795, doi:10.1029/2002JD003006, 2003.
Smyth, S., Bradshaw, J., Sandholm, S., et al.: Comparison of free tropospheric western Pacific air mass classification schemes for the PEM-West A experiment, J. Geophys. Res., 101, 1743–1762, 1996.
Smyth, S., Sandholm, S., Shumaker, B., et al.: Characterization of the chemical signatures of air masses observed during the PEM experiments over the western Pacific, J. Geophys. Res., 104, 16 243–16 254, 1999.
Talbot, R. W., Dibb, J. E., Scheuer, E. M., Blake, D. R., Blake, N. J., Gregory, G. L., Sachse, G. W., Bradshaw, J. D., Sandholm, S. T., and Singh, H. B.: Influence of biomass combustion emissions on the distribution of acidic trace gases over the southern Pacific basin during Austral springtime, J. Geophys. Res., 104, 5623– 5634, 1999.
Watts, S. F.: The mass budgets of carbonyl sulfide, dimethyl sulfide, carbon disulfide and hydrogen sulfide, Atmos. Environ., 34, 761– 779, 2000.
Waters, J. W., Froidevaux, L., Harwood, R. S., et al.: The Earth Observing System Microwave Limb Sounder (EOS MLS) on the Aura satellite, IEEE T. Geosci. Remote, 44(5), 1075–1092, 2006. Xiao Y., Jacob, D. J., and Turquety, S.: Atmospheric acetylene and its relationship with CO as an indicator of air mass age, J. Geo-phys. Res., 112, D12305, doi:10.1029/2006JD008268, 2007. Yoshida, Y., Wang, Y., Zeng, T., and Yantosca, R.: A
three-dimensional global model study of atmospheric methylchlo-ride budget and distributions, J. Geophys. Res., 109, D24309, doi:10.1029/2004JD004951, 2004.
Zhao, Y., Strong, K., Kondo, Y., Koike, M., Matsumi, Y., Irie, H., Rinsland, C. P., Jones, N. B., Suzuki, K., Nakajima, H., Nakane, H., and Murata, I.: Spectroscopic measurements of tropospheric CO, C2H6, C2H2, and HCN in northern Japan, J. Geophys. Res.,
107(D18), 4343, doi:10.1029/2001JD000748, 2002.