Design and Implementation of a Supply Chain Management System at an Emerging Optical Networking Component Supplier
by Erik A. Stewart B.S. Mechanical Engineering Washington University, 1995
Submitted to the Department of Mechanical Engineering and the Sloan School of Management in Partial Fulfillment
of the Requirements for the Degrees of Master of Science in Mechanical Engineering
and
Master of Science in Management at the
Massachusetts Institute of Technology June 2002
t2002 Massachuseos Institute of Technology A sI'ihts reserved
Signature of Author _ ,___ ,---__z________
Sloan Scl'ool ofkManagement- Depj#ent of Mechanical Engineering May 9, 2002 Certified by
Charles H. Fine Chrysler Leaders for Manufacturing Professor of Management, Thesis Advisor Certified by
Lionel C. Kimerling Thomas Lord Professor,# Matpial SciencAnd Engieering, Thesis Advisor Certified by
Stanley B. Gershwin S5prieajc Scientist, Thesis Reader
Accepted by
Ain A. Sonin Professor of Mechanical Engineering Chairman, Committee on Graduate Studies, Department of Mechanical Engineering
Accepted by ____________ ___________
AetdbMargaret C. Andrews
MASSACHUSETTS INSTITUTE Executive Director of Master's Program
OF TECHNOLOGY Sloan School of Management
Design and Implementation of a Supply Chain Management System at an Emerging Optical Networking Component Supplier
by Erik A. Stewart
Submitted to the Department of Mechanical Engineering and the Sloan School of Management in Partial Fulfillment of the Requirements for the Degrees of Master of Science in Mechanical Engineering and Master of Science in Management at the Massachusetts Institute of Technology
June, 2002 Abstract
Giga, located in Copenhagen Denmark, designs and manufactures circuits for optical networking systems. Like many optical networking component suppliers in the late 1990
and early 2000, Giga grew rapidly, and increased product volumes, head count and revenue by ten fold in only two years. This growth however occurred with little infrastructure in place to support the explosion in orders. This work will describe the development and implementation of a Supply Chain Management system to support Giga's emergence as a high volume supplier. The focus will be on developing a system to meet the needs of a startup-manufacturing firm. The work will demonstrate the use of a novel three-phase approach used to develop and implement a system in Giga. The implementation process covers a containment phase, a reliable system development phase and finally an advanced planning system phase. The work will also describe the design of a push/pull supply chain system, practical application of business process mapping to develop a repeatable system, and the modeling tools used to control the supply chain. The push/pull system, introduced in the second phase, allows the company to minimize inventory despite large demand variability and long fabrication lead times. Supporting the management of the supply chain are software tools that are used to manage the inventory counts and outstanding orders. This work will describe how these tools were modified to support the development of a more reliable and faster Supply Chain
Management system.
Thesis Supervisors and Reader
Lionel Kimerling, Director of MPC & Microphotonics Center and Thomas Lord Professor of Material Science & Engineering
Charles H. Fine, Chrysler Leaders for Manufacturing Professor of Management
Stanley Gershwin, Associate Director for the Lab For Manufacturing & Productivity/ Sr Research Scientist
Executive Summary
Intel Corporation has begun to enter the communications industry as a supplier of integrated circuits and modules. On March 21, 2000 Intel acquired Giga. Giga, located in Herlev Denmark, designs and manufactures integrated circuits for optical networking systems, and became part of the Optical Components Division (OCD) of Intel's
Communications Group (ICG).
Like many optical networking component suppliers in late 1990s, Giga grew rapidly, and increased product volumes, head count and revenue by ten fold in only two years. This growth however occurred with little infrastructure in place to support the explosion in orders. By 2001 the supply chain had grown to include dozens of suppliers and inventory points, with hundreds of unique products. The task of managing orders and inventory levels became unmanageable, taking weeks to return customer requests. In addition, large changes in demand in the industry caused major fluctuation in inventory. And finally, the data systems handling information on inventories were incomplete and inaccurate. These systems contained little information on product status and provided several opportunities for inventory to leave the system unchecked.
The challenge facing Giga was first the need to manage orders and inventory and second to turn their supply chain into a competitive advantage. This challenge had to be met at the lowest possible cost. Standard MRP/EPR systems would cost Giga a large percent of their current annual revenue and were therefore not an option. Standard MRP/ERP systems were also too large requiring additional overhead to manage them. As an emerging high volume supplier to the optical networking industry Giga needed to find a solution that would help streamline the supply chain, cut costs, cut turn time, and
minimize inventory within their tight cost constraints.
This work will describe the development and implementation of a Supply Chain Management system to support Giga's emergence as a volume supplier from a custom build to order firm. The focus will be on developing a system to meet the needs of a startup-manufacturing firm. The work will demonstrate the use of a novel three-phase
approach used to develop and implement a system in Giga. The implementation process covers a containment phase, a reliable system development phase and finally an advanced planning system phase. The work will also describe the design of a push/pull supply chain system, practical application of business process mapping to develop a repeatable system, and the modeling tools used to control the supply chain. The push/pull system, introduced in the second phase, allows the company to minimize inventory despite large demand variability and long fabrication lead times. Supporting the management of the supply chain are software tools that are used to manage the inventory counts and
outstanding orders. This work will describe how these tools were modified to support the development of a more reliable and faster Supply Chain Management system.
The three primary contributions to Intel from this work are (1), the use of a novel three stage approach of implementation, (2) the implementation of a push/pull supply chain design, and (3) the development of low cost easy to use Supply Chain Management system.
Acknowledgements
This thesis has been made possible through the help of many people and organizations. I would like to acknowledge the Leaders for Manufacturing Program for its support of the work and Intel Corporation and Giga for providing the environment and experience on which this work is based. I would like to thank the people at Giga for their support and advice during my internship, Randal Graham, Kenth Wrist-Jensen, Jennifer Nishimoto, Jon Frommelt, Kim Liu, Eric Damore, Jordan Plawner and Micheal Norrengaard. I would also like to thank the team from Intel Penang, Kumar Chaturbhuj, Hoon Hoon Heng, and Sok In Cheah.
I would like to extend my special thanks to Chris Richard at Intel, my internship sponsor
who was instrumental in the development of the three-phase process, Charlie Fine, Lionel Kimerling and Stanley Gershwin, my advisors at MIT, who provided specific support for,
advice regarding and endorsing of my activities.
Finally I would like to thank my wife Valerie Brown for her careful reading and editing and for her support and advice during the writing of this work.
Table of Contents
I Integrated Circuit Manufacturing for Optical Networking Products... 13
1.1 The Optical Networking Industry ... 13
1.2 Giga A/S (OCD), History and Background ... 14
1.3 O bjectives... 27
1.4 A p proach ... 29
2 Design and Implementation of a Supply Chain Management System... 31
2.1 The Change Process... 31
2.2 Business Process Standardization... 35
2 .3 P h ase I... 3 6 2 .4 P h ase II... 44
2 .5 P h ase Ill ... 54
2.6 The Future State ... 54
3 Results ... 61
3.1 Responsive Supply Chain M anagement System ... 61
3.2 Reliable Data Access and a Consolidated View ... 61
3.3 Inventory Control System ... 61
3.4 Continuous Improvement Team ... 62
3.5 Foundation for MRP/SAP... 62
4 Discussion ... 63
4.1 Design Strategy ... 63
4.2 Three Phase Change Management Process... 64
4.3 ERP/M RP Requirements for Emerging Companies... 65
4.4 M aterials Requirements Planning ... 66
4.5 The move along the Hayes W heelwright Curve ... 67
5 References... 69
6 APPENDIX... 71
6.1 A: Build Plan Calculation Details ... 71
Table of Figures
Figure 1: The Communications Market ... 13
Figure 2: Giga 's Revenues from 1988 to 1999... 14
Figure 3: The Intel Communications Group Organization Chart ... 15
Figure 4: ICG/Giga Organization Chart... 16
Figure 5: Supply Chain Nodes... 18
Figure 6: Key to Event Flow Charts... 21
Figure 7: The Supply Chain Process Flow ... 21
Figure 8: The Supply Chain Event Flow at the start of the work... 22
Figure 9: Event Flow from Fabrication to Tested Wafers ... 22
Figure 10: Event Flow from Assembly to Assembled Die Inventory... 23
Figure 11: Event Flow from Assembled Die through Test... 23
Figure 12: Event Flow from Tested Die to the Customer... 24
Figure 13: Data Entry for Material Management... 25
Figure 14: Data Flow Chart for the Supply Chain Management Models... 26
Figure 15: The Supply Chain Control System Architecture... 28
Figure 16: Example Business Process Map... 36
Figure 17: Phase I Event Flow Map... 38
Figure 18: Business Process and Mapping to Suppliers... 39
Figure 19: Phase I Business Process Gantt ... 40
Figure 20: Requirements Calculation from the Supplier Build Plan... 42
Figure 21: The Supplier Build Plan Inventory Sheet... 43
Figure 22: The Supplier Build Plan Request to Build Sheet... 43
Figure 23: Business Process Overlap Matrix... 47
Figure 24: The Build Plan Reset Process ... 48
Figure 25: The Demand Rationalization Process ... 48
Figure 26: The Customer Change Request Process... 49
Figure 27: Phase II Customer Upside Request Business Process... 50
Figure 28: Giga's Supply Chain Inventory Strategy, the Push-Pull System ... 52
Figure 29: Phase II Inventory Tracking Sheet. ... 53
Figure 30: Wafer Build Plan for Phase II ... 54
Figure 31: Simpli#cation of the Build Plan Model... 56
Figure 32: Phase III: The Consolidate Wafer Inventory & Data Sheet... 57
Figure 33: Phase III: The Consolidate Component Inventory & Data Sheet... 57
Figure 34: Phase III Inventory Calculation in the Build Plan ... 59
Figure 35: Hayes-Wheelwright Representation of Giga 's Manufacturing Changes ... 68
Figure i: Division Build Plan Calculations... 71
Figure ii: Supplier Build Plan Calculations... 72
Figure iii: Giga Build Plan Calculations ... 72
I
Integrated Circuit Manufacturing for Optical Networking
Products
1.1 The Optical Networking Industry
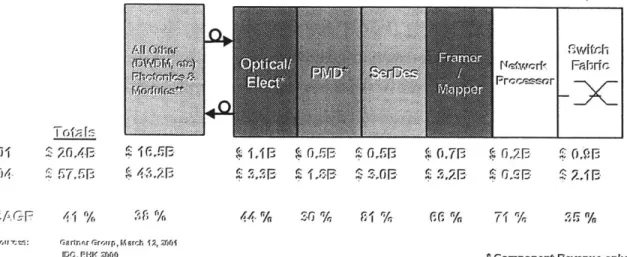
In 2001 the optical communications hardware market was forecast by the Gartner Group to grow at a compounded annual growth rate of 41% to a total of $57.5B by 2004. Within this market Optoelectronics represented about $14.4B by 2004. Optoelectronic modules act as the interface between the optical and the electrical signals in an area network. The primary function of the module is to translate electrical signals to optical signals when moving from an electrical network to optical transmission and vice versa. The components in these modules and their forecasted market growth are shown in Figure 1.
S f T G..n.rr..p of: h2, ..00
or, ! Z26,- ~1,f oiI 61 5R6,5R G JrF 0,7(F 0 F
104- r 5J-F T( .- ,P F 'k '~F ,Z ) C-2 F:, 2.11F
1D C. F I( 2~J( ) 'Ccmrcranf R'-'a-mmiq rily
*
in rcudv inorarinntRi idri, Ravanurt from ((-IE - PR60f) dresgn.
Figure 1: The Communications Market [Gartner Group, March 12, 2001J. Intel's entrance into the optoelectronic market was primarily through the acquisition of companies who designed and manufactured the building blocks seen in Figure 1. Giga was a leader in 10 Gigabit/sec networking products, specifically multiplexers and
demultiplexers, serializers and deseralizers (SerDes in Figure 1), responsible for the combination and separation of signals before and after optical transmission.
The major companies in this market are Broadcom, AMCC, Lucent, and JDS Uniphase. Customers include Cisco, Marconi, Agilent, Nortel and again JDS Uniphase. The most recent trend in the market was the move towards more integrated modules. This trend was being driven by the complexity of the components and therefore the need for close coordination when building whole modules. Ultimately, instead of selling packaged die to customers like JDS, complete models would be sold.
1.2 Giga A/S (OCD), History and Background 1.2.1 History
Giga was founded by Finn Helmer in 1988 in Copenhagen Denmark. Since
establishment Giga has developed, manufactured and marketed high-speed integrated circuits. These standard products are aimed at mixed and analog signal transmission within optical communications. In 1994 Giga introduced the first fully integrated 2.5
Gigabit/sec standard devices. In 1997 Giga was first to introduce a 10 Gigabit/sec transmitter in bipolar silicon and a 10 Gigabit/sec chip set in gallium arsenide. In 1999 Giga introduced the first ever 10 Gigabit/sec receiver in bipolar silicon and become a volume supplier. In 2000 they were volume producers of their third generation of 10 Gigabit/sec products. By 2000, through a supplier base, Giga had an annual capacity in excess of 10 million units. From 1999 to 2000 capacity grew by a factor of five.
1988 1989 1990 1991 1992 1993 1994 1995 1996 1997 1998 1999
Year
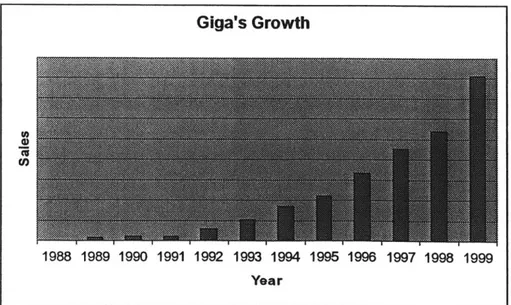
Figure 2: Giga's Revenues from 1988 to 1999 Giga's Growth
U)
a)
From 1993 to 1999 the compounded annual growth rate was 47%. Growth from 1998 to
1999 was over 50%. In the first quarter of 2000 reached record levels. Giga has research and development sites and offices in Denmark, Germany, the Baltics, and in North America in California.
1.2.2 Giga Organization
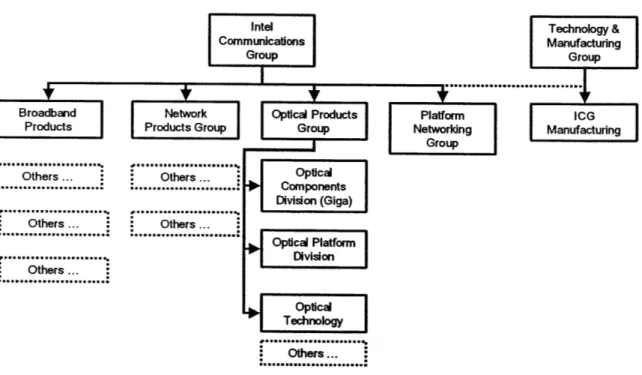
After Intel acquired Giga, it became part of the Intel Communications Group (ICG). During the writing of this work Giga was reorganized to various parts of ICG, finally being placed in the Optical Products Group (OPG) and was given the name Optical Components Division (OCD) and is shown in Figure 3. At the time of this work Giga had a large and dependent customer base for packaged die, and therefore remained fairly independent. ICornmunicationsl Group flT~I Broadband Products *Others... ... Others ... ...,... S Others ... Network Products Group Others ... ... Others ... ... Optical Products Group Optical Components Division (Giga) Optical Platform Division Optical Technology Others ... Platform Networking Group Technology & Manufacturing Group ICG Manufacturing
Figure 3: The Intel Communications Group Organization Chart
Although Giga now reported directly into the ICG organization individuals within Giga did not necessarily report directly to management in ICG. The manufacturing
reported only indirectly to the ICG VP. They also reported to either a corporate office or the Technology and Manufacturing Group that was responsible for running Intel's
manufacturing operations. This shared reporting structure was also seen internally at Giga. This, I believe, was primarily driven by the need to balance corporate
consolidation with regional control.
GMICG Giga Div Intel Corp ntel Corp
M.n ufacn.g. Manager Materials Finance
Gig Finance
Manufacturing Ops Giga Finance
Strategist (LFM Manager Manufacturing Controller
Supervisor) Manager
LFM Intern Materials Planning Supplier
Manager Manager Manager
Materials Divisional
Planner uatrnma
SAP New
Analyst Products
Planner
* Dotted lines; indirect reports. Solid lines; direct reports. Dashed boxes; US location
Figure 4: ICG/Giga Organization Chart
From my perspective the real control and responsibility was divided by geography. Relationships between all the members in the organization were very good. The goals and objectives of the ICG manufacturing GM were very much in line with the Giga Divisional manager. The dotted line management structure is very typical in Intel and everyone involved was generally familiar with this structure and comfortable having multiple supervisors. I also was managed in this structure, being responsible to both the
Operations manager in Denmark and the Manufacturing Strategist in Oregon.
The Logistics Department was divided into two groups, Planning and Materials. The planning organization was responsible for converting demand forecasts into Wafer Fabrication, Wafer Sort, Assembly and Final Test orders. The Materials organization
would then convert these requirements, based on inventory positions, to orders for the suppliers and issue Purchase Orders (POs). The roles and responsibility of the staff were as follows.
1. Division Planner (DP) - The DP is responsible for consolidating the forecast (Judged Demand) for ratification by the Division Management and for entering the data into the Division Build Plan model'. The DP is responsible for monitoring and tracking trends and orders through monthly forecast reviews, trending, tracking volume performance and delivery performance to schedule, prioritization, and highlighting issues to management.
2. Supplier Manager (SM) - The SM is responsible for the relationships with the
suppliers. The SM must understand where the suppliers are moving in regards to technology, volumes, etc. The SM negotiates pricing and contracts and looks for new suppliers. The SM also handles business issues such as on time delivery problems.
3. Materials Planner (MP) - The MP deals directly with suppliers at the execution level. The MP is responsible for insuring that suppliers execute to the Supplier Build Plan. The MP is also responsible for buying piece parts to support the Supplier Build Plan. The parts are mostly dedicated to Giga production and special parts for a few suppliers.
4. Finance Analyst - Responsible for valuing inventory for the monthly budget that
is used to calculate margins. Calculates reserves. Scrutinizes procurement. Double checks ordering work. Questions the Judged Demand from a financial perspective.
5. Giga Factory Planner (FP) - Responsible for the daily execution of internal demand, mostly test.
The Build Plan Model was an Excel based tool used to managing orders. It will be described in more
1.2.3 Giga Supply Chain
1.2.3.1 The Supply Chain
Prior to the writing of this work the supply chain had grown to be complex with varying degrees of control and management. The manufacturing of product was outsourced for almost all high-volume production and for much of the new products in development.
All products follow the same basic flow, which is common to all integrated circuits (ICs)
manufactured today. First individual ICs, commonly referred to as die, are manufactured
on wafers2 in Wafer Fabrication. Next the wafers are tested for good die in Wafer Sort.
Following Wafer Sort the good die are cut from the wafers and packaged. This is
commonly known as Assembly. Following Assembly the packaged die go through Final Test. Wafer Fabrication was outsourced generally to two vendors, Wafer Sort was handled internally with a single vendor providing some limited support, while almost all Assembly was handled by several external vendors. Final Test was handle both
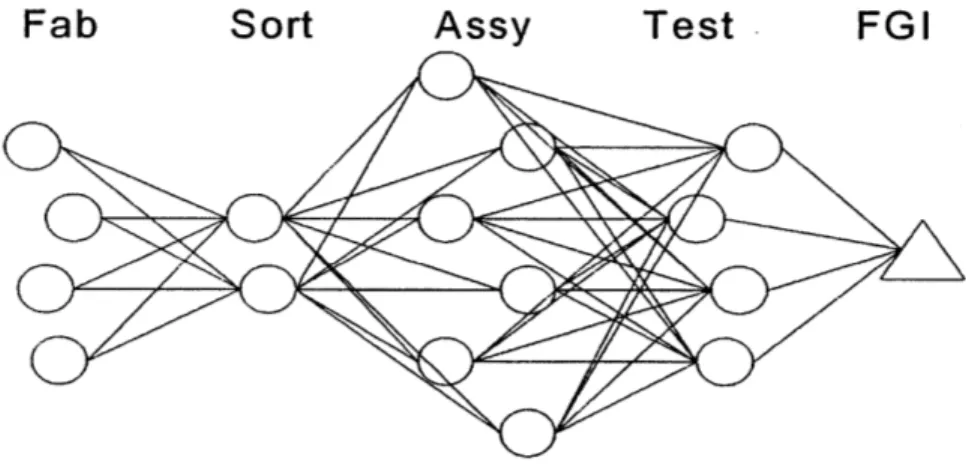
internally and externally. The supply chain as it was in 2001 is shown in Figure 5.
Fab
Sort
Assy
Test
FGI
Figure 5: Supply Chain Nodes (FGI -finished goods inventory)
In addition to the large number of vendors, the flow of material was also more complex than expected for the relatively small quantities being manufactured. In a typical flow, product fabricated in Germany would be shipped to the Giga warehouse in Denmark then
2 A wafer is the single unit of production used in the first step of IC manufacturing. A single wafer can be
sorted internally in Wafer Sort or sent out again to a Wafer Sort supplier. Sorted wafers were again returned to the Giga warehouse, then sent to Malaysia for Assembly and then
sent either to Giga for Final Test or to another Final Test supplier in Malaysia, before finally being shipped to the Intel central warehouse in Amsterdam to await customer delivery.
The complex supply chain architecture and the requirement for frequent shipping were further complicated by the lack of a single software system to track material or a single business process to follow when filling orders. The software systems were comprised of
an ERP3 tool
called Navision, a factory control system call PCS (Production Control
System) that had been built internally, and a dozen different Excel4 tools and SAP.
1.2.3.2 The Supply Chain Business Processes
Three primary business processes were executed by the planning organization. There was a monthly process of loading new forecasts into the Division Build Plan model. There was the weekly process of reconciling the Division Build Plan content to insure that final test out requests matched actual customer orders. And whenever there were changes to customer orders, the orders in the Division Build Plan model were changed. These processes were not all apparent at the onset of the supply chain redesign project, but were discovered and documented as progress was made. The only apparent process at the beginning was the Build Plan Reset process.
Build Plan Reset: On a monthly basis marketing would publish an updated forecast of demand covering 8 to 9 months. The divisional planner would then load this new
forecast into an Excel file called the Division Build Plan model. New build requirements for the suppliers were then calculated and sent to management for approval. Upon
approval these requests were sent to the materials organization to recalculate orders based on inventory positions. The material planner would then issue purchase orders for
demand due in four weeks.
3 ERP refers to Enterprise Resource Planning
Demand Rationalization: To prevent orders from being fulfilled without customer
demand, the SAP analyst would check SAP orders (booked) against the Judged Demand entered into the Division Build Plan model and initiate the cancellation of build request to the supplier if necessary. This was done for orders moving into the lead-time horizon.
Customer Order Changes: Whenever customers requested increases in existing orders
(also known as upside) or new orders that were beyond the capacity stated in SAP the Giga materials group would be requested by the customer representative to determine feasibility. They in turn would contact the suppliers to check for extra capacity and then notify the customer representative of feasibility. This process took anywhere from one to two weeks.
These three processes were not always synchronized. In addition, not everyone involved in the planning process would be informed of changes needed to support one of these three processes. This was causing changes to be made to demand in the models without knowledge of everyone involved. Section 1.2.3.3 will describe, once an order has been approved, the process for executing an order.
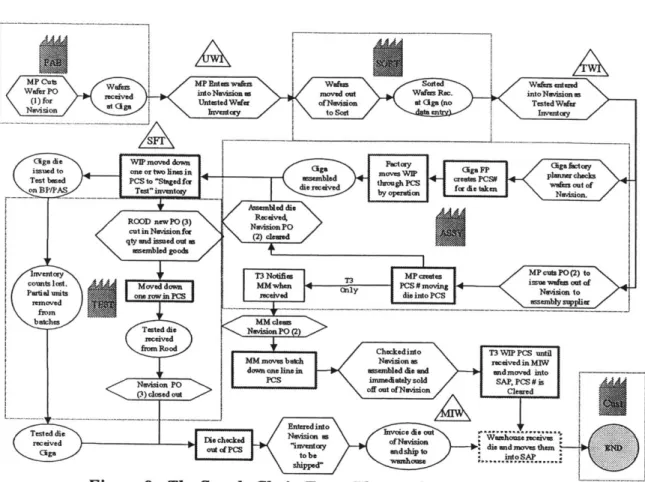
1.2.3.3 Supply Chain Event Flow and Management
The business processes described in section 1.2.3.2 translated demand or forecasts into
requests that were then sent out to the various suppliers. Once the requests were
determined it was then necessary to execute these requests by issuing POs and inventory. To fully understand the baseline system the Supply Chain Management Team created an event flow map showing what activities were necessary to completely move an order through the supply chain. This event map will be described in pieces. The following key shown in Figure 6 should be used to understand each flow diagram.
5 The Supply Chain Management Team was fonmd early in the project and is described in more detail in
EL
A simplified flow map of the supply chain is shown in Figure 7. Figure 7 shows the path
material follows, from Wafer Fabrication to the Customer. Between each step is an opportunity to hold partially finished goods.
udstom....
[UWI: Unsorted Wafer Inventory, TWI: Tested Wafer Inventory, SFT: Staged for Test, MIW: Integrated Warehouse]
Figure 7: The Supply Chain Process Flow
Material is moved from Wafer Fabrication (FAB) to the Customer based on customer demand. The standard followed generally was to issue up to eight weeks of inventory to the Assembly (ASSY) suppliers who in turn would produce to a four-week schedule that was reset every week. Wafer orders were placed based on demand for new die. Each lot represented several months of inventory so orders were rare. The entire event flow is shown in Figure 8 and will be explained in parts.
Navision activity
PCS activity
SAP activity
Other activity - for example receipt of goods
Manufacturing Operation, material as WIP
Inventory Location, material as inventory
MP - Materials Planner DP - Divisonal Planner
FP - Factory Planner MM - Materials Manager
Cuts Wuss MP Enewadsm Wseated
navid -ut -~ Wdu Rec.
Wafns entered
intoNvisionmi
(t fr Untested Wafer ofNavision at Gga (no Tested Wafer
bwaiso
Ivnay . toSeat Invandy
Qga die WIP moved dawn Factory Gge flctry
issued to one or two in oinls sm .W Gg dajP
as s ea d l W.siasy P SAP P Pi-1
Test based PC~to 'Stagedibc Ofrough PCs ,oan out of
oo oon ofp/zto '
iercevd o detoe
BVP/A Test"inventoey by operation Navisicn.
Assemded die
ROOD newpo(3) NCaifo
cut in Novsane
qty and issued owt a(2 ld
assembled goodB
Inventory '~ ' T3oe .3moving
coutslet-Moved down MM~h ~ Cnly C# vngNavisica to
Partial uits omeravin pcs received die into PCs -l ~le
balches TCle ow
frmRood TChwckedinto T3 WIP PCs until
MM moves buich Nvvision a received in MFIW
dmem ons line in assombled da mAn andmoved into
rCS immedidtely sold SAP, PCs# is
an off out OfNevision CIere
.. ...
Figure 8: The Supply Chain Event FHow at the start of the work The event flow for wafer movement was fairly simple. With approved orders the Materials Planner would issue POs and then receive wafers from the Wafer Fabrication Suppliers. The management of the data and material is shown in Figure 9.
MPOrsMpg -1es lvwrs Wikfas %W ers ordered
Wir Oinftwon a moved out WorsRe. into Navision a
(i amUnlarbMdWer of Novision at Gign (no Tooted Wfe
Naiin ntry to Sort vniy
To Assembiy
subcons
Figure 9: Event Flow from Fabrication to Tested Wafers
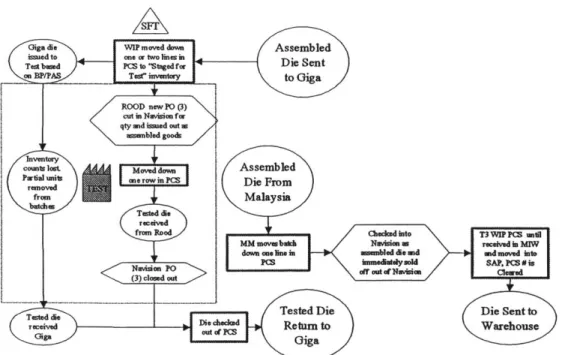
The first deviation in the process occurs when die are issued to assembly. Depending on whether or not the product goes to Giga or externally changes the management methods. For example if Giga is to receive and assemble the die then the factory planner checks out
wafers from Navision, creates a tracking number in PCS and moves the material (WIP) through the system. If the die are sent out to be assembled then the MP creates a PO in Navision and a tracking number in PCS. Deviations such as the one just explained occur
again when die are sent to be tested in Final Test as shown in Figure 10.
Assembled Gigs Fwtw aisaf-owy
Die sent to sonbe mdo PC.Q""
dierwirve ftowl P ~ for ie MwIIS, ow or
Giga by entif.um.
d >
(2) clewed()t
recehd &*nto Ps leono, to
Die Issued to either Supplier or Giga MMOI we Assembled Die sent to Malaysia
Figure 10: Event Flow from Assembly to Assembled Die Inventory
Next assembled die enter the Staged for Test Inventory and are sent to either Giga or
Rood (a Wafer Sort and Final Test supplier) for testing or they go directly to a Malaysia supplier for testing.
WIPa
a*owl" do Assembled TedbsdI to "taged for -- O
Ban /PAS Tosd" inventory to Gjga
cut in .Don o
qty and issitod out a Wsembled goods
Inventory
counts.: A" yIved P.d.. Assembled
J'atia unt; norwinpms Die From
fro Malaysia
Tested die received
frorn Rtood Mocked into T3WVPwC unil
reeVAMvOd D'RtroWre a e N
Finally tested die are moved to the consolidated warehouse, either from Malaysia, Giga or Rood. ie Sent to Warehouse from Malaysia
Die Sent to Navision as *Invoice die out dieeivet Warehous -U18 ol
Warehouse die and moves them
from Giga waehouse ...-..
Figure 12: Event Flow from Tested Die to the Customer
1.2.3.4 Giga's Enterprise Resource Planning and Materials Resource Planning Several systems supported the Supply Chain Management at Giga. One of the primary problems at Giga was the lack of connectivity of these systems. Following is a brief description of each system.
" Production Control System (PCS): This was a software system developed by
Giga several years prior to this work. The system was developed to handle material flow, routes and inventory in the factory. In the current environment it was also being used to supplement as an MRP tool, holding some inventory data on Wafer Sort and Giga Assembly and Final Test.
" Navision: Navision was an off the shelf ERP tool. The version used at Giga did
not have the MRP module installed and was used to handle POs and in costing the inventory each month. It was also used as an MRP tool as it held inventory data, but not by design.
" SAP: SAP was the ERP system used by Intel. Giga's interface to SAP was
limited to finished goods and in storing customer orders. Once material reached the warehouse it was entered into SAP. SAP provided the customer
orders from customers. Any upside beyond what was shown in inventory (which included a forecasted inventory) had to be approved manually.
* Division Build Plan & Supplier Build Plan Models: Giga also used a series of Excel based tools as an MIRP system. The first was the Division Build Plan model that would convert demand into assembly and test requirements. The second were the Supplier Build Plan models that were used to adjust the requirements for each supplier based on inventory positions.
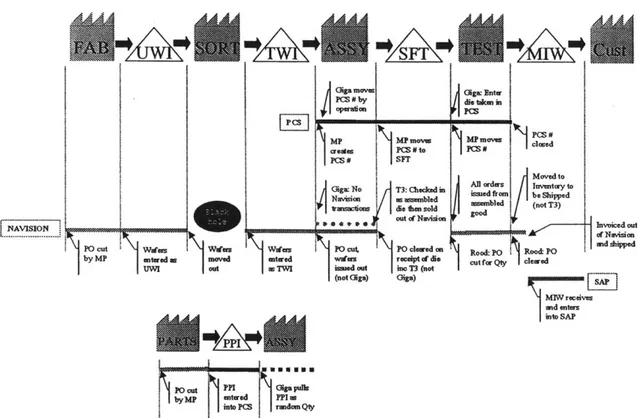
In addition to the number of exceptions that existed in the system the number of di fferent data tools used also increased the complexity and left room for error. The entire process flow in Figure 8 is shown again in Figure 13 but with respect to the data system reveals the level of software complexity.
pc# SFT
OiMgEnter
sCL7 s 1 die aken i n
--- o ut avs
M P I o l M i o v e a c l se d
Gig: No T3: Chocd in m ro Rd be Shppped.
Navii d asaemobled insl nsebled (not T3)mu bans tc i ons sold n good
Fitgredure M yout moved itsd tained out warns (not recptd. in T3 (n t Thes cutsf ymQt m hcwed
Gigs) Gigs) vLPA]
AA" Ato SAP
intoP~s 1 radom Qy
Figure 13: Data Entry for Material Management
Figure 13 describes each of the various software systems used. These systems, however, handled only the P0 data, some inventory data and final inventory positions. There is no
direct link to the demand or the forecasted demand. In order to get the orders to cascade through the system from the customer to the Wafer Fabrication suppliers, a series of Excel based planning tools were used. The "Black Hole" refers to the fact that any wafers checked out for Wafer Sort were no longer tracked in any system.
The conversion of demand forecasts and real orders into Wafer Fabrication, Wafer Sort, Assembly and Test build requirements was completed in the Division Build Plan model. This model, however, would only calculate the Final Test requirements. The Materials Planner then calculated the remaining requests in a series of supplier models. To complete this task a large amount of data needed to be copied from the Division Build Plan model and placed in the Supplier Build Plan models. The data flow is shown in Figure 14. Judged Demand CGID/ RGID FGI from SAP Test Outs Ts I -+Change Request SOld
Commits Giga Test
& Fab
BP
i iu. ~--- ----. ~ ~-- .. .....J ...
.
..e .
ADI Assembly Wafer
& Sort Inventory
WMP
Figure 14: Data Flow Chart for the Supply Chain Management Models Following through Figure 14 from left to right; finished goods inventory and the current orders (CGID/RGID) are extracted from SAP, Marketing's forecast, the Judged Demand, is also downloaded from a separate system and all of this data is then ported into the
Assembly Outs Change Request
Division Build Plan model. After calculating deltas between demand and inventory in the Division Build Plan model data on test needs, the old commits and assembly needs are extracted and put into several dozen models (one for each supplier). The supplier models are then loaded with inventory numbers from suppliers, Navision, and PCS. The material planner then reconciles for inventory and determines how many units need to be fabricated, sorted, assembled and tested. The supplier models then generate requests for each supplier on the quantities that must be manufactured. To understand in more detail the calculations completed in each model refer to Appendix A.
The net effect of the complexities in the system was three fold. (1) The planner and the materials manager spent fifty percent of their time tracking down data, entering data and recalculating changes with little or no confidence in the accuracy of the result. (2) Inventory counts were consistently in error. And at the end of Q2 2001 inventory was well in excess of 40 weeks, with customer lead-times of only 4 weeks. (3) It took well over two weeks to make any commits to customers upside, hurting the bottom line. A company may win orders through its ability to deliver more quickly than competitors. Delivery time reduction needs to be corporate wide, not just in the manufacturing lead
time, but also in the time it take to process orders6.
In summary Giga's Supply Chain Management system was not in good shape. Exceptions were the rule, data was inaccurate, and inventory was out of control. 1.3 Objectives
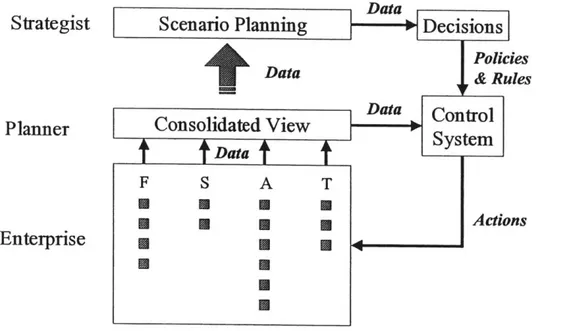
The primary objective of the work was to provide Giga scenario planning capability. This depended on the need for a robust, reliable and repeatable supply chain control system. Figure 15 outlines the general architecture and logic behind a functioning planning system. The most pressing need was for a consolidated view of the data in the enterprise. From the consolidated view, data could be passed to a control system, where decisions on builds could be made (eg, how many die to order from the foundries to
6 T. Hill, 0 1994. There are several examples cited in this text of delivery improvement through business
support inventory targets before assembly). Or, data could be passed to a scenario planning system, where strategic decisions could be analyzed, to check for example, if inventory targets were in fact big enough to handle certain levels of upside.
Strategist
Planner
Enterprise
Scenario Planning Decisions
Policies
+ Data & Rules
Consolidated View D b yteo
Data S
F S A T
Actions
* U
Figure 15: The Supply Chain Control System Architecture
As described in Chapter One it was found that neither the enterprise, consolidated view nor the control system was in a state that would allow for a scenario planning system. As a result of the need for a foundation for a Scenario Planning System the objectives of the work turned to the delivery of a repeatable, reliable and robust planning system.
The stated vision of the project became:
I.
2.
Stated vision: Clear visibility and control of our supply chain
Unstated vision: Give customers what they want, when they want it, at the lowest possible price (flexibility, delivery performance, quality & reliability, & cost). The objective of the work to support this vision was as follows:
2. Consolidated View: Create a single report of all supply chain data.
3. Control System: Implement inventory policies, rules & targets.
1.4 Approach
1.4.1 Methodology
This work will present a novel methodology used to develop and implement a Supply Chain Management system in an emerging IC manufacturing company. The details of this methodology will be discussed in more detail in Chapter Three. The approach was as
follows:
1. Develop of a Repeatable System: Take the best of what existed and standardize
it to make it repeatable.
2. Develop a Reliable System: Take the repeatable system and make it reliable and accurate.
3. Develop a Quick System: Take the reliable system and make it work quickly to
shorten response time.
Based on this approach the work was divided into three phases. Phase I was referred to as the Containment Phase as the objective was to make it repeatable, Phase II the Development of Giga's Planning System as the objective was to make the system reliable, and Phase III the Development of a Build to Order System as the objective was to make the system quick and responsive.
Supporting the work and critical to the success of the project was the formation of a cross functional team. This team had representation from finance, planning, materials,
manufacturing, and by the end of Phase II representation from the primary Assembly and Final Test supplier.
1.4.2 Structure of Thesis
In the remaining chapters I shall discuss the change process undertaken at Giga, the design, development and implementation of the planning system, results, discussion and conclusions.
Chapter Two will describe the development and implementation of the Supply Chain Management system at Giga. I discuss in detail the process of change, the development of the system and the restructuring of the modeling tools used to support the management of the supply chain.
Chapter Three will present results from the implementation of the new Supply Chain Management system.
Chapter Four presents a discussion on Supply Chain Management for emerging
companies as well as on the design of low cost Supply Chain Management tools or MRP systems.
2 Design and Implementation of a Supply Chain Management
System
2.1 The Change Process
2.1.1 Team formation
In order to support the design and development of a Supply Chain Management system
for Giga it was critical to form a team. A cross-functional7 team was assembled from
most of the critical areas affected by changes in the Supply Chain Management system, namely Planning, Materials, Finance, Suppliers, Supplier Management and
Manufacturing. The team was a "heavy weight"7 team, meaning that the team had
decision power and could move ahead on changes without waiting for a lengthy approval process. This allowed the team to make decisions quickly. The team membership included: " Materials Manager " Material Planner " Divisional Planner " Planning Manager " Supplier Manager
" A/T Supplier (Phase II only) " MIT/LFM Intern
" Operations Manager (sponsor, not core member)
" Giga Manufacturing Manager (not core member, phase I only)
To accomplish the task of building a new Supply Chain Management system in less than
six months8 required the participation of the entire planning organization. The team
helped throughout the project by ensuring a high level of buy-in on the work, as all
7'7. Ancona, Kochan, Scully, Van Maanen, & Westney. @1999 ' The LFM internship was completed from June to December 2001
members were part of the process. The team also helped to insure that the work was comprehensive, taking into account all aspects of the business. Implementation time was also reduced, as those affected by the change were already part of the development process, requiring no additional education or buy-in.
2.1.2 The 3-Phase Process
A three-phase process guided the development and implementation of the Supply Chain
Management system. This three-phase process was based on the principle that without first establishing a baseline no future improvements could be made with certainty. This process would follow the three basic steps:
1. Develop of a Repeatable System: Take the best of what existed and standardize it
to be repeatable, whether or not it was the best way.
II. Develop a Reliable and Accurate System: Take the repeatable system and make it
reliable and accurate.
III. Develop a System for Low Cost & Speed: Take the reliable system and make it work quickly to shorten response time, and at the lowest cost with minimum overhead (inventory and people).
Most methodologies used for reengineering systems and business process revolves around the Plan-Do-Check-Act (PDCA) approach pioneered by W. Edward Deming 9.
PCDA is most useful in the context of continuous improvement but does not provide a
framework for the scope of each cycle. One approach to developing a solution for Giga may have been to develop a complete solution from the start and then attempt to
implement it. The approach used in this work focused, instead, on first bringing the business processes into control before developing or implementing a solution. The
three-phase methodology most closely matches the Capability Maturity Model0 used in
helping software organizations improve the maturity of their software processes. This methodology rates and organizations maturity as follows:
9Deming, (1986
I. Initial. The software process is characterized as ad hoc, and occasionally even
chaotic. Few processes are defined, and success depends on individual effort and heroics.
2. Repeatable. Basic project management processes are established to track cost, schedule, and functionality. The necessary process discipline is in place to repeat earlier successes on projects with similar applications.
3. Defined. The software process for both management and engineering activities is
documented, standardized, and integrated into a standard software process for the organization. All projects use an approved, tailored version of the organization's standard software process for developing and maintaining software.
4. Managed. Detailed measures of the software process and product quality are collected. Both the software process and products are quantitatively understood and controlled.
5. Optimizing. Continuous process improvement is enabled by quantitative
feedback from the process and from piloting innovative ideas and technologies.
The first phase describes the movement of the organization from Initial to Defined. The second phase from Defined to Managed and the third phase from Managed to
Optimizing.
To guide the team through each phase in the project a new vision and set of deliverable were created. Although the deliverables did not map exactly to the overall three-phase
structure initially proposed the basic idea of the three phases were maintained. The new vision and deliverable helped to clarify the transition between phases. They also allowed
for a higher degree of focus by the team. Automation, sophisticated planning and build to order were not immediate goals, allowing focus to be maintained each step of the way.
Phase Vision Deliverables
I: Containment Gain Control * Improve Quality by Reducing Errors.
of the Improve Flexibility by shortening BP cycle
* Improve Delivery through better inventory
System management
* No bells and whistles -just what we need to get the job done.
* Standardize how we execute orders and manage inventory
* Simplify our modeling tools * Clean up Navision and PCS
II: Development Design a * Improve Flexibility with strategic inventory
of Giga's Solution for positioning
* Consolidate inventory data
Planning Giga 9 Improve Quality with a more robust MRP system
System 0 Improve Delivery with accurate lead time
estimates
0 Eliminate PCS
0 Shorten Lead time
III: Develop a Make the * Enable Build to Order
Build To Order supply chain * Enable instant confirmation of upside
* Develop a single Build Plan
System a competitive * Move to an off the shelf MRP system
advantage * Enable a self managing system (auto calculations)
This approach allowed for a systematic improvement of the Supply Chain Management system. Each phase would be fully completed and implemented before moving on to the next. As a result, real, tangible results were possible. Had the ideal system been fully designed from the start it is very possible none of the ideas would have been
implemented. The formation of the team and use of the three phases has also built an organization in the logistics department that is focused on continuous improvement. Small steps, in this case, have led to the development of a sophisticated system, with little cost and over the course of only six months.
2.2 Business Process Standardization
2.2.1 Business Process Mapping
This work demonstrates a practical use of business process mapping as a methodology for analyzing problems and creating change in an organizations. Key to discovering the problems at Giga and in formulating solutions was the mapping of the business process
and systems used. In Chapter One the process of handling orders through the supply chain was described in detail using event flow mapping, as an example.
At the start of the project the process mapping of the supply chain processes utilized a
holistic approach, showing in a single map all transactions in the management of material
through the supply chain. To help in the reading of the map each event type was assigned a unique shape. In addition the location in the supply chain that the event took place was marked with a factory symbol and the name of the location, such as Fab or Assembly.
The event flows shown in Chapter One were created from data collected during interviews of each member of the planning organization. Each team member had a different piece of the story to tell, as they had been traditionally responsible for separate suppliers. No single member of the planning organization knew the complete process. Once mapped the flow chart was presented to the team and reworked several times producing the final event map.
Once the map was created it was instrumental in conveying to the organization the need to simplify and find a better process to follow. This final process too was mapped and is shown later in this chapter. This event map was then converted to a sequence of steps and applied to a Gantt chart to help standardize the timing and ownership of each event. This Gantt is also shown later in the Chapter.
As the project progressed the necessity of a holistic view of the system changed to a need to look at the details. By the end of Phase I the details of the business processes were more critical. At this time a new method of process mapping was utilized. In this case
the maps were limited to a single business process and were people rather than process centric. A good example of this is the process of creating wafer orders and is shown in the Figure 16. I I I Lii
1=
I
MP FAB TO3 Wafer Po PO Rec'd Issue SBuild PrSp. Sort? Ship Wafers to Sort Site Wafers Rec'd Receipt Confirmation PO Closed Inventory Updated In Workstream?Figure 16: Example Business Process Map
The process shown in Figure 16 had been represented by only two events in the event map from Chapter One. This approach also emphasizes the ownership and timing or sequence of each event. The migration from a whole systems view of major events to a detailed process flow of the business activities was key to developing solutions that would be effective in the system at large.
2.3 Phase !
2.3.1 Phase I Process Standardization
The first phase of the project focused on containment; building a repeatable system. Using the event flow mapping of the entire supply chain, the team focused on developing
a standard process. With the objective of having a single approach for managing orders the team chose the supplier relationship that worked the best. All of the interactions were
copied exactly to ensure standardization. The objective of Phase I was to make a
repeatable system, not necessarily an optimal one. The primary changes were as follows:
" A Sort PO was created to track quantities in Navision.
* A Sort Tracking Sheet was created to keep count of die in Giga's sort facility. * A PO was cut for all assembly suppliers, including Giga.
" Suppliers were required to send pre-alerts to the MIP for all die moving to test.
* A test PO was cut for all suppliers, including Giga
" One PO was cut for each supplier each month for four weeks of demand
(amended Purchase Orders would be cut for changes). A monthly PO would be cut instead of having one cut for every batch or single order.
* Inventory was issued to the assembly suppliers to support the four weeks of demand plus four additional weeks of forecasted demand. This minimized shipping and allowed upside at the assembly sites.
* The MRP modeling tools were simplified and data links between the inventory and the Division Build Plan model and the Supplier Build Plan models were created.
Nevishon MY
WIP moved down Assembled sMn cut PO (3) Wafea en it
Figue 17 howfns the eevet flow fo PeIrmteo m ap wede toseeM& therdi
Cs o Sta a zed foda ented PCS#moving e f NAsion O t Nt sih n as
entire inventory to beaced io tasking die into PCS to oembly Tested Waret
Thes nets i pcess o dshetip Invento
ors te ud ler Ionped sue
used eah press tofind omolv to find te be sadar
Ftgappl7 stowllspplers hent mappig Phand Iroeths flow a how nset
standardization now planned for Phase I. All exceptions were removed from the process.
Regardless of where the materials were to be shipped the same transactions were
executed. Besides making the work easier for the materials planner it also allow the
entire inventory to be tracked in some fashion, whether in Navision or in a tracking sheet.
The next step in the process of standardization was to develop a business process. To
accomplish this task the team worked through each major activity involved in creating orders to send to suppliers. In addition we mapped which suppliers at that time actually used each process to find commonality. The objective here was to find the best standard
Figure 18: Business Process and Mapping to Suppliers
Using the event map with Figure 18 and assigning timing and ownership, a Gantt chart outlining the events was created. This Gantt chart then became the standard process used
by the planning organization for Phase I. It also revealed to the team the total amount of
time allocated to turning a forecast into orders. This time was set to be just about three weeks. This was close to the estimated turn time of one month and was thought to be lower due to the optimistic estimates of each event.
NTEL WEEK I INTEL WEEK 2 INTEL WELK 3 OWNER EVENT 1.1 1.2 1.3 1.4 1.5 2.1 2.2 2.3 2.4 2.5 3.1 3.2 3.3 3.4
3.5 4.1
issue Pos for weeks . ev
Dieand waters Issue tosuppBR-
-MP weeks of BP. (weeks 3-11) event
SUBCONS Send MP weekly YAP status report. event
[
i
....1.1.1.".Figure 19: Phase I Business Process Gantt
With a repeatable business process the core of Phase I was completed. The only remaining work was to standardize the modeling tools used to generate the orders.
2.3.2 Separation of New Products from High Volume
New Product Introductions or NPI is a necessary core competency of a high tech company like Giga. To increase the Giga's focus on NPI and to simplify the planning process of high volume products the two were separated. NPI would no longer be managed in the Division Build Plan model.
Previously, all products, whether in the development phase or already for sale in volume were included in the Build Plan models. A separate NPI model was created, which could be used to track the products movement through the supply chain on a batch-by-batch basis. In addition an NPI planner position was created to manage this process.
Subsequently all of the NPI products were removed from the Division Build Plan model. These products represented about 10% of the total number of line items. They were left, however, in the Supplier Build Plan models, as the material planner would continue to be the sole contact for creating build request.
BP1, auto-loaded with Judged DP Demand, CGID/RGID, & FOL
DP Calculate change requests. 3 days
DP Publish Build Plan. event
Auto-Load assembly & test outs MP change requests Into Subcon BP. I days
Send Materials Planner inventory
SUBCONS reports. event
MP Load Inventories Into subcon BPs. 2 days
Calculate assembly, test fab
MP requests. 1 days
Publish Subcon Build Plans and
MP send out event
React to DECOMMIT Immediately. SUBCONS Stop production If necessary. event
MUO Determine OP feasibility a-y- -
-STBNS Deadline for commas warnings. eiviein-
-ffjEnters inal commit into oyr I 11 1 1s
Buld Plan Published (delyed r
DP only for GM absence). event
3 days
2.3.3 Phase I Build Plan Model Simplification
The Build Plan models were a key element to the management of the supply chain. They were the only connection between customer orders and the inventory and generated all supplier requests to manufacturing product. As described in the first chapter, data was loaded into the Division Build Plan model from SAP along with forecasted demand and finished goods inventory.
At the start of the project there was a limited amount of data automation to move data into the model. In addition, the model's size was well over 40 megabytes. To simplify the use of the model, code was written which automated the downloading of all of the needed data; the finished goods inventory, customer orders and forecasted demand. In addition changes were made to the formulas in order to reduce the amount of errors and subsequently the size of the model. The model was reduced to less than 12 megabytes. The next step in the simplification process was to connect the Supplier Build Plan models to the Division Build Plan. This was accomplished by writing code that extracted the Final Test requirements from the Division Build Plan and placed them into each of the Supplier Build Plan files. This reduced the data population time from three days to less than five minutes, freeing up more time for the Material Planner and reducing the time it took to respond to customer upside requests and new demand forecasts.
The final step in creating a better modeling system for Phase I was the standardization of the output. Previously each Supplier Build Plan was slightly different. The differences were due to the fact that each supplier expected a different format for their forecast and a
different build horizon. Some were only issued POs for a week's worth of work and inventory to support it while others received four weeks.
To standardize the Supplier Build Plan models one format was chosen and then replicated for each supplier. In addition new features were added to consolidate the inventory and calculate shipping requirements. The old models were then discarded. This
Plan model to be automated, as the destination of the data was now identical, regardless of the Supplier Build Plan model. The models each would contain a section for every product sent to that particular supplier. Figure 20 shows an excerpt from one of the Supplier Build Plan models. The model shows the 'demand'", the 'Supply', what the supplier was committing to and the delta. The model also provides the current inventory position, and based on forecasted demand over the next eight weeks, how many wafers to send to support the build.
Giga Materials Planning
Supply X Supply & Demand Forecast
Build Plan Cycle: Octol1
Product XYZ IlIl Penang Demand I I
Suppiy 957 1ooq I I
Delta 957 0 0
5 4OWN ? Cum Delta 957 957 957
Product XXY IVI Penang Demand 0 01 0
Supply 347 01 0 0
Delta 347 347 0 0
mawimp 4 Cum Delta 347 347 347
Figure 20: Requirements Calculation from the Supplier Build Plan
A major addition to the Supplier Build Plan models was inventory sheets. Rather than
have inventory added as a single data point for every product, a consolidated sheet was created. The idea was to simplify the data entry process and provide an easy to see data sheet. It also provided information on where the material was in the supply chain. Instead of having a single inventory total on the product sheet the model now had the inventory broken up by site before being totaled.
"1 'Demand' was extracted from the Divisional Build Plan model and had already been adjusted for finished goods inventory
B0H Water Inventory Waler
Wafer K) DPW ADI Sorted Supplier X Die Banl Supplier Y Die Bank Total
Wafer Type 1 800
14
4 1C 18Wafer Type 2 900 5 5 1 20
Wafer Type 3 .1,000 1 1 1 12
Wafer Type 4 9,000 2ti 14
afer Type 5 1,000 6 6 1
BUH Die Inventory Assembly I
Product Wafer ID WP SFGI at Test Total
Component XYZ afer Type 1 957 957
Component IVI afer Type 2 347 347
Component SDY Par Type 3 _T 478 4781
Component SDF afer Type 1 960 960
Figure 21: The Supplier Build Plan Inventory Sheet
Finally a standardized build request sheet was created. The build request sheet, used to summarize orders, is sent to each supplier. This sheet, like all sheets in the model, was identical regardless of the supplier. All parties involved agreed upon the format It was in fact considered an improvement by many suppliers as they wanted to see the longer term forecast and have access to inventory earlier to help optimize their build schedules. An example of this sheet is shown in Figure 22.
Giga Materials Planning Supplier X Demand Forecast
Date: July 30, 2001
By Week Forecast:
ComponentXYI Waer TypeI - - - -I- - -
-Component SFD Wafer Type I - -
-Component YT Wafer Typel - -
-[Component ETK S1862A1 - -_- _-
-_-_-By Month Forecast:
Component XYl Water Type I - - -
-Component SFD Water Type - - -
-Component YTI Water TypeI - - -
-Component ETK S1862A1 - - - -1
2.3.4 Walk the Flow
The end of Phase I was marked by a "walk-the-flow" exercise. This exercise involved stepping through each task that was required to meet each business process. In addition the calculations in the Division Build Plan model were reviewed, as was the proposed Phase I Gantt chart. Following ratification of the process Phase I was put into practice. 2.4 Phase !
2.4.1 Phase I Process Improvement
The objective of Phase II was to build on the repeatable system implemented in Phase I, making it more reliable. Using business flow mapping and the foundation provided by Phase I, the team was now in a position to create a more robust and responsive system. Cycle time goals were set to drive these changes.
METRIC DESCRIPTION GOAL STRETCH GOAL
Business Process The time it takes to convert a 3 working Zero (build to
Cycle Time request to a commit. days order)
Assembly/Test The time it take to deliver units Two One week
Cycle Time from the die bank to warehouse weeks
LIPAS Line Item Performance to 100% 100%
Schedule. Orders fulfilled on time divided by orders requested
VOLPAS Volume performance to schedule. 100% 100%
Volume produced divide by
volume required
To meet these targets and make the system more robust, the following changes were made:
" The PCS System was put off line
" Inventory targets and locations were chosen " A push-pull12 system was implemented
" Unsorted wafers were sorted and moved to die inventory " The Supplier Build Plan models were consolidated
2 Push/pull refers to the combination of a build to orders system for the front-end process and a build to