Analysis of Damage Mechanisms in Boronized
TZM Tiles from Alcator C-Mod Fusion Reactor
Operations
by
Joseph Michael Hubley
Submitted to the Department of Nuclear Science and Engineering
in partial fulfillment of the requirements for the degree of
Master of Science in Nuclear Science and Engineering
at the
MASSACHUSETTS INSTITUTE OF TECHNOLOGY
June 2010
MASSA TECS OLNSTITUTE
OF TECHPJOLOGY
DEC 0 9 2010
LIBRARIES
@
Massachusetts Institute of Technology 2010. All rights reserved.
ARCHIVES
Author ...
Departmet
c.i.e.c.
.. ... ..
.a.d.
.E.g..
Department of Nuclear
Science
and Engineering
/1
~May 14, 2010
Certified by ...
Ronald G. Ballinger
Professor of Nuclear cience and Engineering
I
aThesis
Supervisor
Certified by
Associate Professo of)
-,J
Dennis G. Whyte
Nuclear Science and Engineering
(
Thesis Supervisor
Certified by
n A4
Bruce Lipschultz
Senior Research Scientist
Thesis Supervisor
'1
1
A ccepted by ...
..
.
...
Professor Jacqueline C. Yanch
Analysis of Damage Mechanisms in Boronized TZM Tiles
from Alcator C-Mod Fusion Reactor Operations
by
Joseph Michael Hubley
Submitted to the Department of Nuclear Science and Engineering on May 14, 2010, in partial fulfillment of the
requirements for the degree of
Master of Science in Nuclear Science and Engineering
Abstract
Alcator C-Mod is a deuterium tokamak reactor experiment operated by the MIT Plasma Science and Fusion Center. Following the 2008 Alcator C-Mod campaign, the reactor was shut down and opened for maintenance and upgrades. During this time, it was discovered that the boronized TZM tiles, with boron films applied in situ, lining the inner surfaces of the reactor had experienced non-uniform damage as a result of plasma interactions. This damage was most pronounced in the tiles from the limiter and divertor, but also appeared in regions of the reactor that were not traditionally believed to experience high heat or particle fluxes. The objective of this
thesis is to perform a thorough microstructural analysis of these tiles, particularly the boron-TZM interface, in order to explore the damage mechanisms present. In turn, the details of the damage mechanisms will illuminate the plasma parameters, such as temperature and particle flux, that caused the damage. This analysis will also allow for a prediction of the behavior of other tile and coating materials under consideration for use in fusion devices.
During this investigation, a number of tiles with varying degrees of apparent damage were removed from the limiter and divertor and photographed for macroscopic characterization. Modeling was also performed using the expected heat and particle fluxes at the tile surface, along with the thermal transient history of the tiles, to estimate the depth of damage from each of these sources. These results were compared to data gathered during analysis of the tiles through several techniques, including ion beam analysis, scanning electron and optical microscopy, energy dispersive X-ray spectroscopy, and X-ray diffraction spectroscopy.
Ultimately, the diverse sets of data gathered through these techniques provided for a fairly cohesive rationalization of the damage mechanisms present. In the case of the divertor tiles, no thermal damage was observed, but the boron film was eroded through sputtering as a result of the large fluxes of high energy particles encountered in that region of the reactor. Tiles in the limiter, however, experienced a more severe amount of damage caused primarily by thermal effects. The surface temperatures at these tiles were in the range 2140-2600 degrees Celsius, surpassing the melting point
of boron and approaching that of the underlying TZM. Recrystallization of the TZM substrate was observed to an average depth of -20m, with an overall observed heat penetration depth of -100m. These temperatures indicate a local heat flux of ~108
-109W/m 2 when applied to the heat diffusion model used earlier in this investigation.
Such a large heat flux indicates a transient event responsible for the observed damage, occurring on a timescale of milliseconds rather than the one second duration of a pulse at peak power. This transient would be characterized by an increase by an order of magnitude of the product of the plasma density and sheath temperature. Another possibility is that the beads which formed on the melted surface extended beyond the plasma Debye length and intersected the magnetic field lines, resulting in
an increase in the heat fluxy by an order of magnitude at those locations. It is difficult to separate the contributions of these damage mechanisms from data obtained after a full Alcator campaign, and further investigation is warranted to better understand each of these processes.
Thesis Supervisor: Ronald G. Ballinger
Title: Professor of Nuclear Science and Engineering Thesis Supervisor: Dennis G. Whyte
Title: Associate Professor of Nuclear Science and Engineering Thesis Supervisor: Bruce Lipschultz
Acknowledgments
I would like to thank the many people who supported my work on this thesis for their
contributions.
Ron Ballinger, Dennis Whyte, and Bruce Lipschultz, for their direction and guid-ance throughout this investigation.
Harold Barnard, for all of his contributions at the accelerator lab.
Julian Benz, Mike Short, Jon Gibbs, and Tim Lucas, for their advice on sample preparation and microstructural analysis.
Bob Mumgaard, Dan Brunner, Geoff Olynyk, Mike Garrett, and Zach Hartwig, for their detailed knowledge of Alcator C-Mod.
Contents
1 Introduction 17
1.1 Overview of Fusion Energy . . . . 18
1.2 Tokamak Reactors . . . . 20
1.3 Alcator C-M od . . . . 21
1.4 Motivation for Thesis . . . . 24
2 Theoretical Background 25 2.1 Recrystallization . . . . 25
2.2 Intermetallic Phase Precipitation . . . . 29
2.3 Estimated Transient Temperature . . . . 30
2.4 Ion Beam Analysis (IBA) . . . . 30
2.4.1 Particle Induced Gamma Emission (PIGE) . . . . 31
2.4.2 Rutherford Back Scattering (RBS) . . . . 32
2.5 Scanning Electron Microscopy (SEM) . . . . 34
2.6 Energy Dispersive X-Ray Spectroscopy (EDX) . . . . 35
2.7 X-Ray Diffraction (XRD).... . . . . . . ... 35
2.8 Determination of Plasma Properties . . . . 37
3 Materials and Methods 41 3.1 Tile Selection and Macroscopic Characterization . . . . 41
3.2 M odeling . . . . 42
3.2.1 Thermal Damage . . . . 47
3.2.2 Radiation Damage . . . . 48
3.3 Ion Beam Analysis . . . . 3.3.1 Particle Induced Gamma Emission
3.3.2 Rutherford Back Scattering . . . . . 3.4 Microstructural Characterization . . . . 3.5 X-Ray Diffraction . . . . 4 Results
4.1 Ion Beam Analysis . . . . 4.1.1 PIGE Results . . . .
4.1.2 RBS Spectra . . . . 4.1.3 Integration of IBA Results . . . . 4.2 Microstructural Analysis . . . . 4.2.1 Optical Micrographs . . . . 4.2.2 SEM Micrographs . . . .
4.3 XRD Spectra . . . . 4.4 Summary of Tile Data . . . .
5 Discussion 6 Conclusions 57 57 57 57 60 61 61 64 65 69
List of Figures
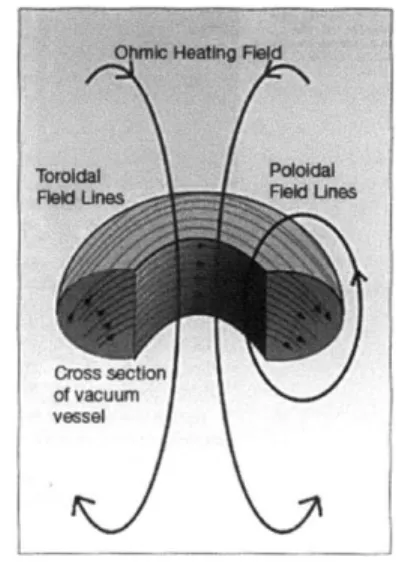
1-1 The toroidal and poloidal fields produced by a tokamak reactor for
plasm a confinement. . . . . 20 1-2 Schematic of Alcator's bare vacuum vessel. . . . . 22
1-3 Schematic of the poloidal cross-section of Alcator C-Mod, with the
limiter and divertor indicated. The red line separates open and closed m agnetic field lines. . . . . 23
2-1 Recrystallization temperature as a function of cold work, represented
by percent reduction in bar thickness during rolling, for several
molyb-denum alloys. These data represent the onset of recrystallization, fol-lowing nucleation, for a one hour isothermal anneal. The behavior of TZM is given by the uppermost curve. . . . . 26
2-2 The degree of recrystallization versus temperature for a one hour du-ration of heating for molybdenum (blue), TZM (red), and tungsten (green). Note that the degree of recrystallization for all three alloys increases dramatically over a relatively small range of temperatures. . 27 2-3 Recrystallization temperature of TZM as a function of the duration
of isothermal heating, with the temperature representing the onset of recrystallization, following nucleation. The red curve is the upper temperature bound and the blue curve is the lower temperature bound for the range of recrystallization temperatures. . . . . 28
2-4 Boron-molybdenum phase diagram, indicating the compositions and temperatures at which several common intermediate B-Mo phases are stable. Such phases may be formed as precipitates by boron diffusion
into the underlying molybdenum of the tiles at high temperature. . . 29
2-5 Cross section for proton-induced emission of the 432keV gamma ray
by 10B. Note the sharply peaked resonance that occurs at 1.5MeV. . . 32
3-1 The poloidal locations of the damaged Alcator tiles (1) A411711 and A412581, (2) G20, (3) G15S, (4) G13S, and (5) G7. . . . . 43
3-2 The poloidal location of the undamaged tile 070B40809R, indicated in
the top right corner of the schematic. . . . . 43
3-3 A map of the GH limiter, showing the locations of tiles G7, G13S,
G 15S, and G 20. . . . . 44 3-4 A photo of the GH limiter, showing the tiles along the left and right
edges recessed in major radius. . . . . 45
3-5 A radial view of G15S, a tile from the left edge of the GH limiter
module. The magnetic field lines are parallel to the flat plasma facing surface on the side of the tile nearer the center of the limiter, with the rounded side nearer the edge of the limiter receding away from the plasm a. . . . . 45
3-6 Macrophotographs of the damaged surfaces of tiles used in this
inves-tigation . . . . 46
3-7 Thermal conductivity of TZM versus temperature . . . . 47
3-8 The 1.7MV Tandetron accelerator at the CLASS facility. . . . . 49
3-9 Schematic of the Tandetron accelerator, indicating the locations of the (1) ion source, (2) low energy steering magnet for ion selection, (3)
path of negative ion acceleration, (4) high voltage terminal with elec-tron stripping occurring in nitrogen gas, (5) path of positive ion accel-eration, (6) quadrupole focusing magnet, and (7) high energy steering m agnet. . . . . 50
3-10 Photographs of the entire tile surface for tiles used in IBA. All tile
surface locations are referenced to these photographs. For the limiter tiles G7, G13S, and G15S, the right hand side in these photographs is the rounded edge of the tile which would be at the edge of the GH limiter, as shown in the radial view of G15S provided in Figure
3-11. Note that the limiter tiles in these photographs are in opposite
orientation to their installed location, as shown in Figure 3-11. . . . . 51 3-11 A radial view of G15S, a tile from the left edge of the GH limiter
module. The magnetic field lines are parallel to the flat plasma facing surface on side of the tile nearer to the center of the limiter, with the rounded side at the edge of the limiter receding away from the plasma. Note that the orientation of the tile in this view is equivalent to that when installed in the limiter module, but opposite the orientation of the limiter tile photographs shown in Figure 3-10. . . . . 52 3-12 Schematic of the cutting surfaces for different tile geometries. For the
microstructural analysis, sections 2 and 3 are viewed along cutting surface 1, and sections 1 and 4 are viewed along cutting surface 2. The section numbers above also correspond to the damaged tile surfaces shown in Figure 3-10, with section 1 from the top left quadrant, 2 from the top right, 3 from the bottom left, and 4 from the bottom right. 53
4-1 RBS spectra obtained with five of the damaged tiles, each shown against the spectrum obtained with a bare Mo tile. . . . . 59
4-2 The microstructure of the undamaged TZM substrate, as viewed in a plane parallel to a side of the tile -1mm below the boronized surface. This microstructure is dominated by elongated grains, -20pm in width and oriented along the direction of rolling during fabrication. . . . . . 61
4-3 A recrystallized grain, ~10 m wide, found at the boron-TZM interface in section 3 of tile G 13S. . . . . 62
4-4 A large recrystallized grain found in section 4 of tile G13S. Note that the grain diverges from the orientation of grains in the substrate, in-stead wrapping around the surface defect. The width of this grain varies from -10m on one side of the defect to ~30m on the opposite sid e . . . . 6 3
4-5 An optical micrograph of section 4 of tile A41258I, showing the rela-tively intact boron film . . . . . 64 4-6 SEM micrograph of the undamaged TZM substrate along a grain
bound-ary, showing a plane parallel to a side of the tile and approximately 100m below the film. Note the dark pits along this boundary, which were most likely the location of Ti or Zr precipitates. . . . . 65
4-7 SEM micrograph of the boron-TZM interface from section 2 of tile
G13S, approximately 100m below the film. Note the light spots which
indicate precipitates along the grain boundaries, possibly in the form of B-M o phases. . . . . 66
4-8 Comprehensive XRD spectra for G7 and G15S obtained with the Pana-lytical X-ray diffractometer, with G7 shown in green and G15S in black. The numbered lines indicate the relative intensities and 20 values of commonly observed XRD peaks for Mo, B, and several intermediate phases. . . . . 67
4-9 High resolution XRD spectra for G7 and G15S obtained with the Bruker D8 two-dimensional X-ray diffractometer, with G7 shown in green and G15S in black. The numbered lines indicate the relative intensities and 20 values of commonly observed XRD peaks for Mo, B, and several intermediate phases. . . . . 68
4-10 Panalytical XRD spectra for a section of undamaged tile, G7, and
G15S, shown in black, blue, and red, respectively. The common XRD
peaks for B, Mo, and intermediate phases are given at the bottom, and the Mo K-p peaks are indicated in the spectra. . . . . 70
5-1 The temperature profiles throughout the limiter tiles anticipated by Equation 2.11 for a heat flux of ~10 9W/m 2 and transient timescales
of 1ms (blue), 0.9ms (red), and 0.8ms (green). . . . . 75 5-2 The beryllium-tungsten phase diagram. . . . . 77
List of Tables
3.1 List of tiles removed from Alcator C-Mod for analysis, along with their locations within the reactor during the 2008 campaign. . . . . 42
3.2 Estimated depths of thermal damage for both full pulse and transient
timescales in tiles with given near surface concentrations of boron. . . 48
3.3 Four step polishing procedure for tile sections using Buehler products. 54 4.1 PIGE data collected at various locations on the damaged tiles. The
locations given are referenced to the damaged surfaces of the tiles, as viewed with the tile orientation shown in Figure 3-10. The 432keV counts in each area were normalized by both incident protons and counts obtained from BN, then used with the simulation described earlier to determine the near surface (<30 m below the film) concen-trations of boron. . . . . 58
4.2 The energy differences at the RBS edge between pure Mo and the damaged tiles, as well as the thickness of the B layer corresponding to such a difference, assuming a pure B film above the TZM substrate. 58
4.3 Comparison of near surface B concentrations as determined through both PIGE and RBS. . . . . 60
4.4 Summary of the tile data gathered through IBA, microscopy, and XRD techniques . . . . 71
Chapter 1
Introduction
The use of nuclear fusion as a source of energy has been under investigation for decades. At the Massachusetts Institute of Technology (MIT), the Alcator C-Mod tokamak reactor is at the heart of research being conducted by the Plasma Science and Fusion Center (PSFC). Since 1992, this reactor has been in operation through a series of approximately yearlong campaigns. During such a campaign, plasmas containing the hydrogen isotope deuterium (D) are heated in ~2.Os pulses to temperatures of ~105K, at which D-D fusion occurs. Although these plasma pulses are magnetically confined, interactions between the plasma and inner surface of the reactor do occur. To protect the reactor walls from damage during such interactions, the inner surface of Alcator is lined with a closely packed grid of boronized TZM tiles. Following the
2008 campaign, Alcator underwent scheduled maintenance that revealed
unantici-pated degradation of numerous tiles in the limiter and divertor regions of the reactor. The objective of this thesis is to characterize the damage mechanisms present in these tiles using a host of materials science techniques, then use this analysis to character-ize the behavior of other tile and film materials, as well as to better understand the properties of the plasma itself.
1.1
Overview of Fusion Energy
As a field of research, nuclear fusion has been the subject of much excitement and controversy, not only today but throughout its brief half a century of existence. It originated somewhat ominously in a time of conflict, resulting in the development of the most destructive weapons known to mankind. Despite this bellicose incep-tion, the fusion research being undertaken at present seeks a solution to one of the greatest global challenges of this century. As climate change and responsible energy management take increasing priority, nuclear fusion offers tremendous promise as a source of ecologically benign, abundant energy. The creation of a reactor capable of reliably and continuously providing such energy has been the focus of fusion research for several decades; however, numerous engineering challenges remain to be solved before such a reactor may become operational.
The attraction of nuclear fusion as a source of clean energy derives largely from the enormous energy density of the fuel. For instance, several MeV of useful energy may be obtained from the fusion of two deuterium atoms due to either the reaction
D+D -* 3 He + n + 3.27MeV,
(1.1)
or
D + D - T + p + 4.03MeV, (1.2)
where n is a free neutron, T is the hydrogen isotope tritium, and p is a free proton. An even more impressive 17.6 MeV per reaction may be obtained through the fusion of deuterium and tritium according to
D + T -+ a + n + 17.6MeV, (1.3)
where ct represents an alpha particle, or 4He nucleus. These energy yields dwarf the ~10eV of energy typically produced by a chemical reaction. Also, while fission reactions typically yield -20OMeV, the masses of the isotopes involved are two orders
of magnitude greater than those fueling the fusion reactions above, and so fusion generally produces more energy per unit mass of fuel than fission [1].
In addition to its energy density, the fuel for fusion reactions is also naturally abundant and simple to procure. Although deuterium is far less common than single proton hydrogen, with one D atom for every 6700 atoms of 1H, there is nonetheless enough deuterium in ocean water to satisfy the current global energy demand for two billion years. The tritium required for the reaction in Equation 1.3 is too short-lived to be found naturally on Earth; however, it may be bred by bombarding the common element lithium with neutrons, another product of fusion. It is also important to note that the products of fusion are either recyclable in the above reactions, or inert as is the case for helium. Secondary radioactivity may be produced from neutron activation of structural materials in the reactor, but the majority of these isotopes are short-lived and do not require storage on geological timescales, as does nuclear waste generated by fission reactors [1].
Unfortunately, the benefits of fusion energy are accompanied by several challenges. In order to initiate the reactions in Equations 2.7-1.3, the fuel must be brought to extreme temperatures, on the order of 108K. At such temperatures, the tendency of the fuel, now in a plasma state, is to expand due to kinetic pressure. This renders the fusion reactions unsustainable without some form of confinement. Also, in spite of the various confinement techniques used by present fusion reactors, particles do manage to escape from the confined plasma and interact with the inner surfaces of the reactor. These interactions rapidly cool the plasma and bring fusion to a halt, while also causing substantial degradation of the reactor's plasma facing components (PFCs). These and other issues must be overcome before fusion reactors can achieve steady state operation and become a reliable source of environmentally sound energy
Cross section \I
of vacuum vessel
Figure 1-1: The toroidal and poloidal fields produced by a tokamak reactor for plasma confinement.
[2]
1.2
Tokamak Reactors
An important development in the quest to overcome the previously stated challenges of fusion energy is the invention of the tokamak reactor. Tokamak reactors are fusion devices that rely on powerful magnetic fields to confine the high temperature plasma described above. Tokamaks are toroidal in geometry, and they generate a magnetic field that is on the order of several Tesla for plasma confinement. To produce such a strong field, tokamaks rely on both external coils and a current driven directly through the plasma, producing a toroidal and poloidal magnetic field, respectively. The combination of both toroidal and poloidal fields is necessary to achieve stable confinement of the plasma. These fields are illustrated in Figure 1-1 [2]. Along with magnetic field generation, the plasma current contributes to the high temperatures necessary for fusion through ohmic heating of the plasma. This resistive heating alone is not enough to achieve the temperatures necessary for fusion, and so resonant radio frequency (RF) waves and high energy beams of neutral particles are used to further heat the plasma and induce fusion [3].
Thus far, tokamaks have been quite successful in fusion research relative to other reactors, particularly in regard to high temperature generation and plasma
confine-ment. Nonetheless, tokamaks are inherently pulsed devices, due to the finite flux sweep available for magnetic field production. Once the flux sweep is complete, the plasma current decays in short order due to resistive losses. At present, the duration of these plasma pulses is on the order of seconds. It is hoped that future tokamaks will be capable of pulses on the timescale of hours, with little time between pulses, so that near continuous operation may be achieved. Although current tokamaks will never produce commercially available energy, they serve a valuable function as research instruments for the development of fusion power [4].
1.3
Alcator C-Mod
Alcator C-Mod is a tokamak reactor, the third in a series of similar devices, currently being used for fusion research by the MIT PSFC. It has been in operation since
1992 through a series of approximately yearlong campaigns, each of which has been
followed by a period of maintenance and upgrades. With a major radius of 0.67m and capable of generating a magnetic field up to 8T in strength, Alcator is a compact, high field tokamak. Deuterium plasmas are formed in Alcator in pulses of ~2.0s, with typical densities of <102 0particles/m 3. Using RF heating, these plasmas can be heated to ~108K, a sufficient temperature for D-D fusion to occur. Figure 1-2 shows a schematic of Alcator's bare vacuum vessel.
Despite the strong magnetic fields used to contain the plasma, particles inevitably manage to escape and interact with the structure of the vacuum vessel. To mitigate the effects of these interactions, specific structures, namely the limiter and the di-vertor, have been incorporated into the design of Alcator. The limiter is a curved surface at the major radius of the vacuum vessel which directly intercepts the edge of the plasma. As ions at the edge of the plasma interact with the limiter, they transfer much of their energy and are neutralized. In this way, the limiter removes particles from the plasma edge and defines the shape of the plasma [6]. The limiter region is indicated in the schematic of the poloidal cross-section of Alcator C-Mod, shown in Figure 1-3 [7].
Figure 1-2: Schematic of Alcator's bare vacuum vessel.
[5]
The divertor in Alcator C-Mod is also shown in Figure 1-3 [7]. The primary purpose of the divertor is to remove particles from the edge of the plasma, neutralizing them as they collide at the divertor strike point and then allowing for the unconfined neutral particles to be pumped from the system. The divertor also allows tokamaks to benefit from an enhanced confinement regime, known as H-mode, which creates a steep pressure gradient at the plasma edge that almost doubles the energy confinement of the plasma. In terms of PFCs, the divertor aids in reducing thermal damage by increasing the wetted surface area of the plasma by using grazing incidence angles (~1-2Q) of magnetic fields to material surfaces. This produces a more evenly distributed heat flux, so that the temperature at the divertor surface is greatly reduced from that at the plasma edge [6].
As may be seen in Figures 1-2 and 1-3, the inner surface of the vacuum vessel is protected from the plasma by a closely packed grid of tiles. The majority of these tiles are composed of the molybdenum alloy TZM, although some tungsten tiles were also used in the 2008 campaign. TZM consists of a molybdenum matrix containing 0.4-0.55wt% titanium, 0.06-0.12wt% zirconium, and 0.01-0.03wt% carbon [8]. This alloy is commonly encountered in high temperature applications due to its high melting point of 26200C [9]. In general, molybdenum alloys maintain high strength and stability at higher temperatures, with performance rivaled only by tungsten alloys.
Figure 1-3: Schematic of the poloidal cross-section of Alcator C-Mod, with the limiter and divertor indicated. The red line separates open and closed magnetic field lines.
[7]
Also, the high ductility and toughness of molybdenum alloys allow a greater tolerance for imperfections and reduced risk of brittle fracture over tungsten alloys and ceramics
[10]. TZM is additionally favored in Alcator because it is less expensive and easier to
machine than tungsten [11].
Although TZM is well suited to fusion applications because of its thermal prop-erties, the Mo comprising the bulk of the alloy is high in atomic number (Z), as are the Ti and Zr. High Z elements must be prevented from entering the plasma, as their presence will cause rapid cooling through line radiation. To combat this high
Z contamination, the tiles are all coated with a thin layer of boron using an in-situ low temperature plasma deposition. This is done with a helium diborane (He+D 2B6) plasma that is RF heated at the electron cyclotron resonance frequency. This creates a resonance region, where boron is deposited, that may be swept across the inner surface of the reactor by varying the toroidal magnetic field. A typical campaign can distribute boron films -1-5pm thick on TZM surfaces [12].
1.4
Motivation for Thesis
Following the 2008 Alcator C-Mod campaign, the reactor was shut down and opened for maintenance and upgrades. During this time, it was discovered that the boronized TZM tiles had experienced non-uniform damage as a result of plasma interactions. This damage was most pronounced in the tiles from the limiter and divertor, but also appeared in regions of the reactor that were not traditionally believed to experience high heat or particle fluxes. The objective of this thesis is to perform a thorough microstructural analysis of these tiles, particularly the boron-TZM interface, in or-der to explore the damage mechanisms present. In turn, the details of the damage mechanisms will illuminate the plasma parameters, such as temperature and particle
flux, that caused the damage. These damage mechanisms may also be extrapolated
to predict the behavior of other tile and film materials under consideration for use in fusion devices. The results of this analysis will be useful not only for future selec-tion of PFC materials, but also for improving the current understanding of plasma behavior inside Alcator and other tokamak reactors.
Chapter 2
Theoretical Background
Evidence of interactions between the plasma and PFCs, particularly the boronized TZM tiles in Alcator C-Mod, can manifest itself in a variety of forms. In the case of the boron film, contact with the plasma most often leads to erosion of the film through sputtering. Some of this sputtered boron may be redeposited on other tiles, so that boron will migrate throughout the reactor. Also, if the temperature at the tile surface exceeds 20750C, the boron will melt and redistribute itself along the tile
surface [13]. The more likely scenario would be the deposition of sufficient energy to induce recrystallization and/or diffusion of boron from the surface into the TZM substrate where, depending on the phase diagram for the boron-molybdenum system, precipitation of B-Mo intermetallic phases may occur.
2.1
Recrystallization
For the underlying TZM, melting is unlikely given the 26200C required for this to
occur; however, recrystallization may occur at a far lower temperature [9]. For a de-formed (cold worked) metal, such as TZM after being thermomechanically processed and/or machined, the energy of the cold work is stored in residual stresses and the dislocation structure induced by the cold work. When heated, the TZM will release some of this stored energy through recrystallization. This process begins with the nu-cleation of new grains at areas of high local stresses near the grain boundaries. The
majority of the time required for recrystallization is spent in the nucleation phase. Following nucleation, the newly formed recrystallized grains will grow, reducing the stresses at their boundaries and releasing further stored energy[21].
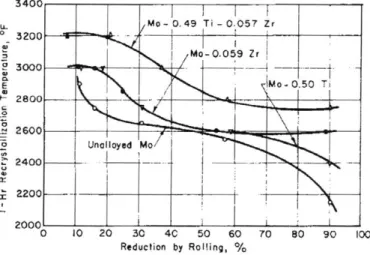
The amount of excess energy available will depend on the amount of cold work in the material. The higher the amount of cold work, the lower the temperature at which recrystallization will occur, to a point. Beyond approximately 70% cold work, the recrystallization temperature ceases to drop, resulting in a minimum recrystallization temperature. For this reason, there will be a range of recrystallization temperatures that is dependent upon cold work. The upper temperature is limited by an insufficient amount of cold work energy available to surmount the activation energy barrier for nucleation of new grains. Figure 2-1 shows the recrystallization temperature of TZM (Mo-0.49Ti-0.057Zr) as the uppermost curve . Figure 2-1 also illustrates another
key factor in the overall recrystallization behavior of a material. Since the process consists of nucleation and growth, an activation energy will be required. As a result, there will be a time at temperature dependence of the process. The recrystallization temperature data shown in Figure 2-1 is thus reported for a one hour isothermal anneal and represents the onset of recrystallization [14].
3400 -Mo- 0.49 Ti - 0.057 Zr * 3200 CIF Mo-0.059 Zr 0 --E Mo-0.50 Ti 2800- -2600 Unalloyed Mo I 2400 -- -2200 20 2000 0 10 20 30 40 50 60 70 80 90 100 Reduction by Rolling, /o
Figure 2-1: Recrystallization temperature as a function of cold work, represented
by percent reduction in bar thickness during rolling, for several molybdenum alloys.
These data represent the onset of recrystallization, following nucleation, for a one hour isothermal anneal. The behavior of TZM is given by the uppermost curve.
The time dependence of the recrystallization process is further illustrated in Fig-ure 2-2, which shows the degree (%) of recrystallization as a function of temperature for a fixed time at that temperature [15]. Once nucleation has occurred, the recrystal-lized grains will grow and consume the original material, with 100% recrystallization achieved when all of the original material is consumed. At this point, if there is suf-ficient energy available (supplied by the temperature), the new grains will grow by consuming each other until an equilibrium final grain size is achieved [21].
100 90 so 70 = 60 50 40 a 30 20 A 10 0 0 500 1000 1500 2000 Temperature ('C)
Figure 2-2: The degree of recrystallization versus temperature for a one hour duration of heating for molybdenum (blue), TZM (red), and tungsten (green). Note that the degree of recrystallization for all three alloys increases dramatically over a relatively small range of temperatures.
[15]
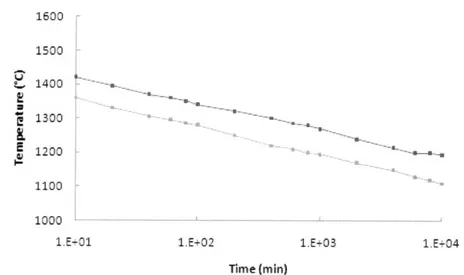
A further illustration of the time dependence of the process is illustrated in Figure 2-3, which shows the effect of time at temperature on the onset of recrystallization
(the end of the nucleation process) in TZM [15]. Figures 2-1 and 2-2 are for isothermal annealing times of one hour; however, the temperature quoted represents the mean of a Boltzmann energy distribution where the energy at the tail of the distribution is considerably higher. This, when combined with the statistical nature of the distribu-tion, results in a time at temperature dependence of the recrystallization temperature [21].
As shown in Figure 2-3, the recrystallization temperature increases as the duration of heating decreases. The range of recrystallization temperatures also decreases with decreasing time of heating. This is important to note, as the degree of recrystallization increases dramatically over a relatively narrow range of temperatures, as shown in
1600 1500 1400 1300 E 1200 1100
1000-1E-01 1.E+02 1.E-03 1.E+04
Time (min)
Figure 2-3: Recrystallization temperature of TZM as a function of the duration of isothermal heating, with the temperature representing the onset of recrystallization, following nucleation. The red curve is the upper temperature bound and the blue curve is the lower temperature bound for the range of recrystallization temperatures.
[15]
Figure 2-2 [15]. Given the lack of such data for the timescales of interest in this study (~1ms), the data in Figure 2-3 have been extrapolated back to these timescales by plotting the upper and lower bounds of the recrystallization temperature range against the logarithm, in base 10, of the time at temperature. The equations fitted to the upper and lower bounds of the recrystallization temperature range for TZM are
Tupper = -75.39 * log(t) + 1593.23 (2.1)
and
Tower = -78.31 * log(t) + 1571.48, (2.2)
where Tupper is the upper temperature bound and Tiower is the lower temperature bound, in OC, for a given time t, in seconds. Applying Equations 2.2 and 2.1, the range of recrystallization temperature for an isothermal heating event of 1ms is
1806-18190C. This temperature range should be compared with the recrystallization
Weight Percent Boron
5 10 20
30 40 50 60 70 80
Atomic Percent Boron
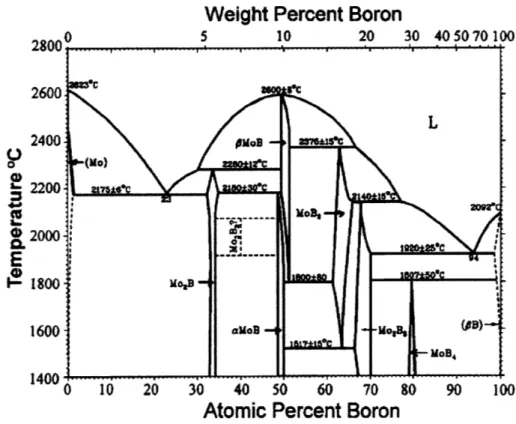
Figure 2-4: Boron-molybdenum phase diagram, indicating the compositions and tem-peratures at which several common intermediate B-Mo phases are stable. Such phases may be formed as precipitates by boron diffusion into the underlying molybdenum of the tiles at high temperature.
[16]
hour anneal, the extrapolated temperature is at least approximately comparable.
2.2
Intermetallic Phase Precipitation
Higher temperatures at the tile surface may also cause the boron to diffuse into the TZM substrate, where it can combine with the molybdenum matrix to form various B-Mo phases. The B-Mo phase diagram shown in Figure 2-4 shows several of these intermediate B-Mo phases, as well as the compositions and temperatures at which they are stable [16].
In order to discover evidence of these processes, a number of analytical materi-als science techniques must be employed. Measurement of the boron distribution at the tile surface is best done using ion beam analysis (IBA) techniques, such as
par-ticle induced gamma emission (PIGE) and Rutherford back scattering (RBS). The microstructure of the TZM substrate, on the other hand, is best studied through optical and scanning electron microscopy (SEM), along with energy dispersive X-ray spectroscopy (EDX). Additionally, X-ray diffraction (XRD) is necessary to detect the presence of the B-Mo phases shown in Figure 2-4. These techniques are explained in detail in following sections.
2.3
Estimated Transient Temperature
The data gathered from the above analysis and measurements may be used to esti-mate the nature of the plasma-tile interaction, as well as to predict the behavior of other tile-film systems in a similar environment. For example, if recrystallization is observed on the exposed tile surface, then the range of exposure temperatures can at least be bracketed, keeping in mind the uncertainties associated with the data available and the short exposure time for the actual case relative to the available data. If intermetallic phases are detected that were not present in the unexposed condition then, given the specific characteristics of these phases, especially tempera-ture and composition ranges of stability, the exposure temperatempera-ture during the plasma transients can be further bracketed.
2.4
Ion Beam Analysis (IBA)
Ion beam analysis is a relatively broad field of materials research which encompasses a number of analytical techniques. As the name implies, the unifying element in these techniques is the use of a beam of ions, typically accelerated to energies on the order of MeV, to irradiate a specimen. The interactions between these ions and the atoms composing the specimen produce a variety of forms of secondary radiation, which may be measured spectroscopically and used to deduce the properties of the specimen. While there are many IBA methods, the two of interest in this thesis are particle induced gamma emission and Rutherford back scattering.
2.4.1
Particle Induced Gamma Emission (PIGE)
Particle induced gamma emission makes use of the nuclear reactions that occur when charged particles, such as protons, interact with nuclei within a sample, resulting in the emission of gamma radiation. The spectrum developed by detection of these gamma rays provides much insight into the composition of the sample. The energies of the emitted gamma rays are dependent upon the elements present, and the relative intensities of these different gamma rays provide information on the elemental percent composition. The depth of analysis available with PIGE is somewhat limited, as a beam of light ions, such as protons, with energy on the order of a few MeV will typically not be able to penetrate greater than 50 tm below the surface of a specimen.
PIGE is also best used for samples primarily composed of lower Z elements since the
Coulomb barrier between the beam particles and sample nuclei increases with Z [17]. Therefore, PIGE is best suited for analysis of thin films composed of low Z materials, as is the case with the boron film on the Alcator tiles.
In addition to bulk composition, PIGE may be used to perform depth profiling for certain elements, particularly those lower in Z, up to the limit of the beam's penetra-tion depth. This is possible because most of the lighter nuclei, or those with Z<30, have sharp, pronounced resonances for gamma emitting nuclear reactions induced by light ions with energies less than ~3MeV [17]. For 10B, the boron isotope responsible for the 432keV gamma ray used to measure boron concentration, such a sharp reso-nance occurs at a proton beam energy of approximately 1.5MeV, as shown in Figure
2-5 [18]. If the energy of the proton beam at the surface of a specimen containing
boron is varied, it will cause the 1.5MeV resonance energy to be reached at different depths within the tile. The intensity of the 432keV gamma emission may then be plotted versus the depth at which the protons reach the resonant energy, creating a curve which is directly proportional to the areal density of boron nuclei at the various depths.
0.18 0.16 __ 0.14 (p,ay) Be CD 0.11 0.10 L 0.08 ) 0.06 - _ _ 0 U 0.04- __ - - - - _ _ -0.02 L_ ___ 01 0.6 0.8 1.0 1.2 1.4 1.6 1.8 2.0 2.2 2.4 2.6 2.8
PROTON ENERGY (MEV)
Figure 2-5: Cross section for proton-induced emission of the 432keV gamma ray by '0B. Note the sharply peaked resonance that occurs at 1.5MeV.
[18]
2.4.2
Rutherford Back Scattering (RBS)
Rutherford back scattering is another IBA technique that may be used to explore the composition and depth profile of a specimen. RBS occurs when an energetic particle from the ion beam elastically collides with a nucleus within the target, scattering back from the target and transferring a portion of its energy to this nucleus. According to classical conservation laws, the fraction of the initial energy lost by the incident ion during RBS is given by
k
m cos() + /M 2 - M2(sin(6))2k m)(2.3)
where k is the fraction of the incident particle's initial energy that is transferred, m is the mass of the incident particle, M is the mass of the target nucleus receiving energy from the incident particle, and 6 is the scattering angle in the laboratory frame of reference. It must be noted that Equation 2.3 only applies for an incident particle that is less massive than the target atom, or m<M; otherwise, backscattering will not occur. By using an ion beam with particles of known mass and energy, then detecting
the backscattered particles and measuring their energy, Equation 2.3 can be used to determine the mass of the scattering atom [19].
RBS may also be used to create a compositional depth profile for a sample. As described above, a backscattered particle should have a specific energy determined
by the target atom's mass and the scattering angle. In reality, the incident particles
interact continuously with the electrons throughout the sample, losing energy to these electrons both before and after the backscattering collision [19]. This continuous energy loss over distance as a particle travels through a medium is referred to as the stopping power of the medium. This stopping power may be calculated as
d E 4re 4z 2 2mov 2 V2)
_V2-=NZ In -In 1 - 2 2(2.4)
dx mov2 I c c
where -dE/dx is the stopping power, e is the fundamental electron charge, z is the atomic number of the incident particle, mo is the rest mass of an electron, v is the velocity of the incident particle, N is the number density of atoms in the target, Z is the atomic number of the atoms in the target, I is the average excitation and ionization potential of atoms in the target, and c is the speed of light [20]. Using this relation, the additional energy loss beyond that of the backscattering collision may
be used to divide the sample into layers of various composition.
Despite the capabilities of RBS, there are limitations to the measurements that may be attempted. Differentiating Equation 2.3 with respect to M results in
)/2 dk 2M (m cos(9) + VM2 - m2(sin(0))2)
dM (m + M)4 VM 2 - m2(sin(O))2 '
where dk/dM is the rate of change in energy transferred by the incident particle with respect to the target atom's mass. According to Equation 2.5, the differences in the energy of particles backscattered by different atoms become less pronounced as the target atoms become heavier. Once these differences become less than the resolution of the detectors used for measuring backscattered particle energy, it is impossible to discern between heavier elements. Unfortunately, this resolution issue at higher atomic masses, which generally accompany higher Z, is juxtaposed with a
low probability of RBS occurring for lower Z targets. This is due to the behavior of the RBS cross-section,
zZe2 42 4
[1
- ((m/M) sin(6))2 + cos(O)] 2 (2.6)4E (sin(O))4 1 - ((m/M) sin(6))2
where a is the cross-section for RBS, E is the initial energy of the incident particle, and all other symbols are the same as for Equation 2.4. As shown in Equation 2.6, the probability of RBS increases as the square of Z for the target atom, and so it is difficult to obtain appreciable detection rates for backscattered particles that interact with low Z elements. Thus, RBS is optimal for materials with Z in the range of 10 to 18; however, if only one high Z element is present, it will be readily detected and sufficiently distinct from any low Z constituents [19].
2.5
Scanning Electron Microscopy (SEM)
SEM greatly extends the magnification and depth of field available for microstructural
analysis beyond that of an optical microscope. While optical microscopes are limited to approximately 1500X magnification, the typical SEM can achieve magnification in excess of 50,OOOX. Also, the depth of field of an SEM may be as great as 300 times that of an optical microscope, allowing for better viewing of particularly deep features, as encountered in heavily etched specimens and fracture surfaces. Although optical microscopes offer superior resolution at magnifications below 300-400X for specimens that are relatively flat, the SEM is preferred at higher magnifications and for specimens with greater surface relief [21].
SEM micrographs are formed by scanning an area of the specimen, known as the
raster, with a pointed beam of electrons in a series of line scans. The electrons in this beam interact with the raster to produce a number of emissions, such as backscattered beam electrons, secondary electrons from the specimen, and X-rays. Almost any of these emissions may be used to infer the texture of the raster; however, the secondary electrons are typically used because they generally originate at the narrow point of the beam, and so they offer the highest resolution. To generate an image of
the specimen, a detector is used to measure the intensity of secondary electrons produced at each location in the scan. This intensity determines the brightness of the corresponding location on the cathode ray tube. Since attenuation of secondary electrons is a function of distance, the contrasting levels of brightness can provide an indication of specimen topography. Unfortunately, contrast also occurs for different materials adjacent to one another, and so discriminating between geometrical and compositional features can be difficult [21].
2.6
Energy Dispersive X-Ray Spectroscopy (EDX)
Like PIGE and RBS, EDX is a common method for evaluating the elemental com-position of a specimen. In EDX, a beam of high energy charged particles or X-rays is focused into the specimen. In many cases, EDX instruments are coupled with an
SEM, and so the two devices share the same electron beam. As the beam impinges
upon the specimen, it will eject electrons from the inner shells of atoms in the spec-imen, creating a vacancy which will be filled by an outer orbital electron. When this electron transitions to an inner orbital, it will emit a characteristic X-ray that is equal in energy to the difference between the inner and outer shells. The energy of a characteristic X-ray is particular to a specific shell transition in an atom of a given element. Thus, by using an X-ray detector to collect an energy spectrum, the elemental composition of a specimen may be determined through the energies of the characteristic X-rays observed. Unfortunately, the characteristic X-rays emitted by lower Z elements are so low in energy as to be absorbed by the detector window, and so elements lower in Z than carbon cannot typically be detected with EDX [21].
2.7
X-Ray Diffraction (XRD)
X-ray diffraction is yet another technique available for compositional analysis; how-ever, it goes beyond the elemental analysis of the previously described techniques by allowing for identification of the crystalline structures present in the specimen. This
allows for the detection of particular compounds and phases that are present in the sample. XRD is best understood by considering the wavelike behavior of X-rays and other electromagnetic radiation. According to classical physics, any wave encoun-tering an array of regularly spaced scatterers will undergo Bragg diffraction. This occurs because the interaction between the wave and each scatterer creates isotropic secondary waves, originating at the scatterers. For the most part, these waves are out of phase and undergo destructive interference; however, some waves will be in phase in a few directions and interfere constructively. This results in an increase in wave amplitude in these directions, with destructive interference correspondingly reducing the amplitude in all others. The directions of constructive interference are a function of the wavelength and the interval between scatterers.
In the case of X-ray diffraction, the scatterers are the'electrons surrounding the constituent atoms in the sample. For any crystalline solid, these atoms are found at particular locations in the lattice, forming a series of scattering planes with a constant distance of separation. Thus, a beam of X-rays will diffract in such a sample, producing a reflected wave of maximum intensity when the beam is incident upon the sample at particular angles. The angles necessary to produce this maximum reflected wave are given by Bragg's law,
nA = 2d sin 6, (2.7)
where n is any whole number, X is the wavelength of the incident X-rays, d is the spacing between scattering planes, and 0 is the angle of incidence necessary to maxi-mize the intensity of the reflected wave, also known as the Bragg angle. It should be noted that appreciable diffraction is only observed when X and d from Equation 2.7 are similar. Due to this constraint, X-rays (X=0.1-100A) are the only form of electro-magnetic radiation suitable for diffraction crystallography, but electron and neutron diffraction are also sometimes used [22].
In practice, XRD is performed with the X-ray beam in a fixed position. The specimen is then rotated through a range of angles relative to the incident beam, and
the intensity of the reflected wave is measured at each angle. This reflected wave is often measured as twice the incidence angle, or 20, relative to the X-ray beam. This produces a spectrum of reflected wave intensity versus twice the Bragg angle, with the locations of local maxima being used in Equation 2.7 to determine spacings between planes in the lattice. Such spectra have already been recorded and catalogued for myriad compounds and isomers, and so phase identification is largely a matter of fitting the measured spectrum from a particular sample with those in the XRD databases; however, the prodigious amount of differing compounds and phases with relatively few allowable crystal structures requires some discrimination based upon the results of the elemental composition methods described above [22].
2.8
Determination of Plasma Properties
The data gathered from the previously described techniques may be used to determine the properties of the plasma itself. Specifically, they allow an approximation of the temperature gradient at the tile surface to be made. This temperature gradient may be used to determine the local heat flux through the heat diffusion equation,
dT
pcd dt = V - (kVT), (2.8)
where p is the material density, c, is the specific heat capacity of the material, dT/dt is the time derivative of the temperature, k is the coefficient of thermal conductivity for the material, and VT is the temperature gradient in the medium [23]. Assuming a semi-infinite solid with a constant heat flux, this equation may be solved in one dimension to obtain
T(x, t)
=2q
kt
exp/4kt-
erfcz pc" ,
(2.9)
k 7r pc, 2 2 k
where q is the local heat flux, x is the depth below the heated surface, and erfc is the complementary error function [24]. Equation 2.9 may be simplified by defining a new variable
U = (2.10)
such that the heat diffusion solution may be written as
t
2(T(x, t) = 2q e- - 2u e d0 , (2.11)
7rpcpk
where ( is a placeholder variable in the integral term which represents the complemen-tary error function [25]. The form of this equation is a rapidly decaying exponential in which the majority of the thermal loading occurs within a relatively thin layer below the surface. The thickness of this layer, known as the skin depth, may be approximated by
= kt (2.12)
Pp
Once the heat flux is known, it may be used to calculate the product of the temperature and particle flux of the plasma according to the equation
qparauei = yJkBTe, (2.13)
where qparanel is the heat flux parallel to the magnetic field lines, y is the total sheath heat transmission coefficient, F is the particle flux, kBis the Boltzmann constant, and TeiS the temperature of the plasma sheath. This parallel heat flux may then be converted to the local heat flux incident on the tiles by the relationship
q = qparauei sin(O), (2.14)
where 0 is the angle of incidence between the tile surface and the magnetic field lines. The value of the total sheath heat transmission coefficient is approximately 7, kBiS equal to 8.617x10⁻⁵eV/K, Teis typically within the range 1-3x10⁵K, and 0 is between
10 and 101 for undistorted tiles. F depends upon the temperature and number density
S= nekT (2.15) v i
where neis the plasma number density, typically <1020particles/m 3, and mi is the mass of the deuterons, 1875.6MeV/c 2 [6]. Once the local heat flux has been determined
from the data and Equation 2.11, the relationship between temperature and number density of the plasma may be approximated using Equations 2.13, 2.15, and 2.14.
Chapter 3
Materials and Methods
A fairly diverse set of data is necessary to fully determine the nature of the damage
present in the boronized TZM tiles from Alcator C-Mod. A number of tiles with varying degrees of apparent damage were removed from the limiter and divertor and photographed for macroscopic characterization. Modeling was also performed using the expected heat and particle fluxes at the tile surface, along with the thermal transient history of the tiles, to estimate the depth of damage from each of these sources. These results were compared to data gathered during analysis of the tiles through several techniques, including PIGE, RBS, optical microscopy, SEM, EDX, and XRD. A detailed description of the modeling and analysis of these tiles may be found in the following sections.
3.1
Tile Selection and Macroscopic
Characteriza-tion
A number of tiles with different macroscopic manifestations of damage were selected
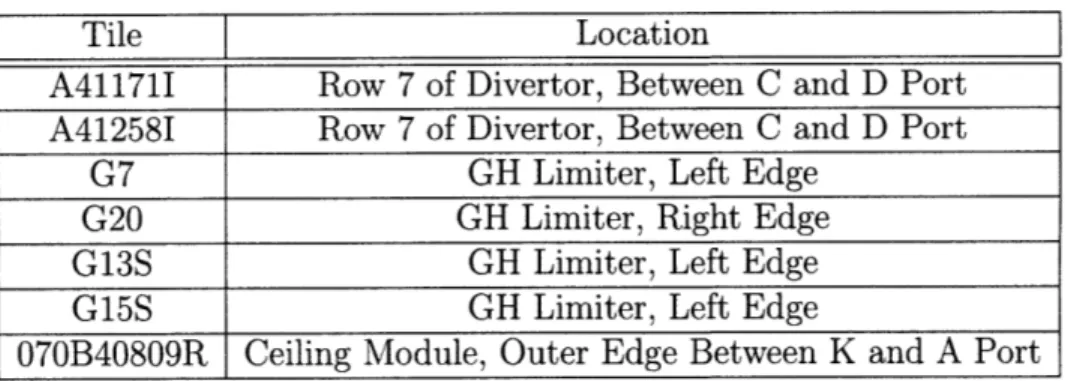
for analysis, as well as one tile, 070B40809R, with no apparent damage. These tiles, and their locations in Alcator C-Mod, are provided in Table 3.1. The poloidal loca-tions of the damaged tiles are also indicated in Figure 3-1. 070B40809R, however, was installed in an earlier configuration of Alcator and removed in June 2004, so its
Tile Location
A41171I Row 7 of Divertor, Between C and D Port
A412581 Row 7 of Divertor, Between C and D Port
G7 GH Limiter, Left Edge
G20 GH Limiter, Right Edge
G13S GH Limiter, Left Edge
G15S GH Limiter, Left Edge
070B40809R Ceiling Module, Outer Edge Between K and A Port
Table 3.1: List of tiles removed from Alcator C-Mod for analysis, along with their locations within the reactor during the 2008 campaign.
location is shown in Figure 3-2. The four tiles from the GH limiter are all recessed in major radius due to their locations at the limiter edges. These locations are shown on the GH limiter map in Figure 3-3, and the recessed edges may be seen in the photograph of the GH limiter, provided in Figure 3-4.
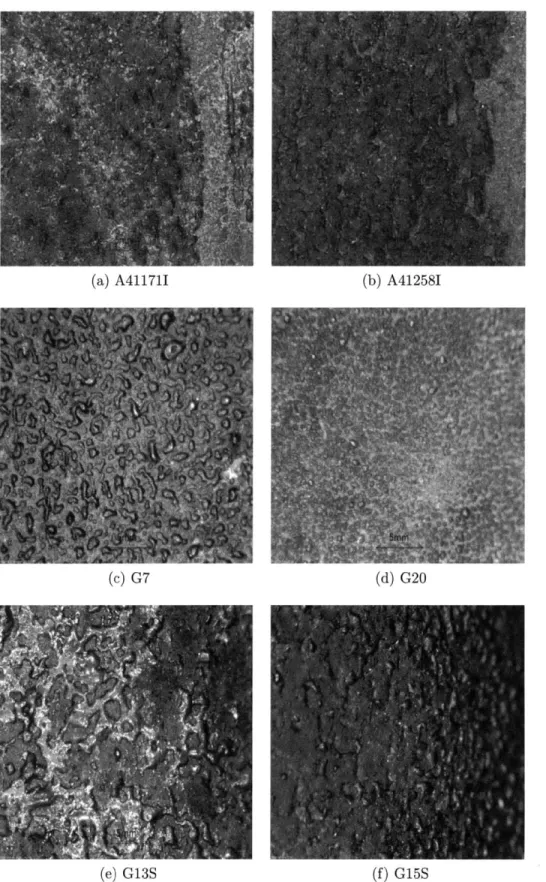
The recessed edges of of the GH limiter are also illustrated by the radial profile of the edge tiles, such as G15S, shown in Figure 3-5. As shown in this view, the bottom of the tile is mounted to the limiter module with the opposite side facing the plasma. The rounded side of this plasma facing surface is located at the edge of the limiter module, with the flat side nearer to the center of the module. This flat side is parallel to the magnetic field lines, and so the tile surface is recessed away from the plasma at the rounded portion that is at the edge of the module. Photographs of the damaged surfaces are shown in Figure 3-6. It is interesting to note that the melting which appears to have occurred at the surfaces of several tiles produced a rough texture, rather than a smooth melt layer. This is believed to be a result of the surface tension of melted boron and molybdenum.
3.2
Modeling
Thermal and radiation modeling was done to determine the depth of interaction in the tiles for each form of damage. The depth of thermal damage was estimated from the skin depth calculated with Equation 2.12. Radiation damage was approximated using the Stopping of Radiation in Matter (SRIM) software. For both forms of damage,
Alcator C-Mod
0.6
0.4
.4 06 08 1.0 R (in)
Figure 3-1: The poloidal locations of the damaged Alcator tiles (1) A41171I and A41258I, (2) G20, (3) G15S, (4) G13S, and (5) G7.
Module 19R K02 Modulel19- K02 Modulel19 -K02
Psi 4Potio14 Po s 2
# 2830297 Module 19 - K02 # 66B 12 # 70B40809
M -KM 10Module 19 - K0
CO P dlosito oo Goito 1-H Poito 20 -)0 A -OT6227Mdl C 1R K02 H -H 72#0 40809 049 Position 5 # 58B14 Module 19 - K0 Position 1---# 089203 Module 19-K0 Position 61--# 00C9D04 Module 39 Position 6 -# 007C015004 Module 59 Position 6 -# 007C01473 Module 79 Position 76 --# 006C10193 Module 9X Position 10---# 006C10065 Module 120 Position 10 -# 006C1 0240 B C -D - E
-Case A K-PORT Module position se ofal the #a g schemati62 CLRAc2Br62 o the til 07i
B K-PORT 20 CL1RA18009 IJ1 5 7A=
C K-PORT 36 CL1AD1B474 I JH 7 f443 D K-PORT 52 CL1AD10490 3/3 oue3/j K JH 7 7512 E K-PORT 68 CL1AD18498
Figure~~~~~~~~~~~ C-:Tepli oaino h na ae d pstinlena #7B00R idctdi
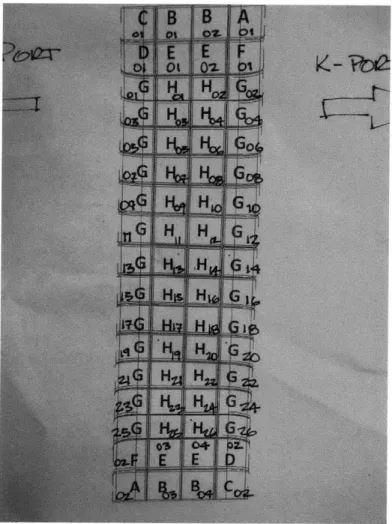
Figure 3-3: A map of the GH limiter, showing the locations of tiles G7, G13S, G15S, and G20.
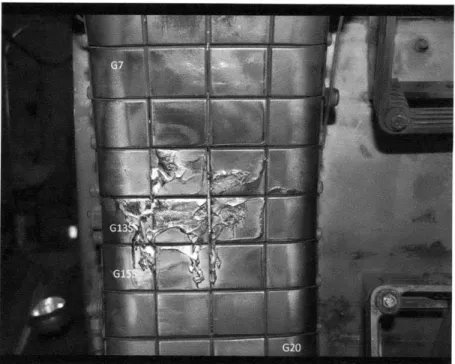
Figure 3-4: A photo of the GH limiter, showing the tiles along the left and right edges recessed in major radius.
Figure 3-5: A radial view of G15S, a tile from the left edge of the GH limiter module. The magnetic field lines are parallel to the flat plasma facing surface on the side of the tile nearer the center of the limiter, with the rounded side nearer the edge of the limiter receding away from the plasma.
(a) A41171I (b) A41258I
(c) G7 (d) G20
(e) G13S (f) G15S
Figure 3-6: Macrophotographs of the damaged surfaces of tiles used in this investi-gation.