1
Short-term relationships between emergency hospital admissions for respiratory and cardiovascular diseases and fine particulate air pollution in Beirut, Lebanon
Myriam Mrad Nakhlé
1,5,6,7*, Wehbeh Farah
2, Nelly Ziade
3, Maher Abboud
4, Dominique
Salameh
4,5, Isabella Annesi-Maesano
6,71 Biology Department, Saint Joseph University of Beirut, Beirut, Lebanon 2 Physics Department, Saint Joseph University of Beirut, Beirut, Lebanon
3 Rheumatology Department, Hôtel Dieu de France Hospital, Saint Joseph University of Beirut, Beirut, Lebanon
4 Chemistry Department, Saint Joseph University of Beirut, Beirut, LebanonUniversity of Saint Joseph,
5
Arcenciel, Environment Program, B.P. 165216 Beirut, Lebanon 6
INSERM, UMR_S 1136, Institut Pierre Louis d’Epidémiologie et de Santé Publique, Equipe EPAR, F-75013, Paris, France
7
Sorbonne Universités, UPMC Univ Paris 06, UMR_S 1136, Institut Pierre Louis d’Epidémiologie et de Santé Publique, Equipe EPAR, F-75013, Paris, France
*Corresponding author: Myriam Mrad Nakhlé
2 Abstract
High levels of major outdoor air pollutants have been documented in Lebanon, but their health effects remain unknown. The Beirut Air Pollution and Health Effects study aimed to determine the relationship between short-term variations in ambient concentrations of particulate matter (PM10 and PM2.5) and emergency hospital admissions in the city of Beirut, and whether susceptible groups are more greatly affected. An autoregressive Poisson model was used to evaluate the association between daily concentrations of particulate matter and respiratory and cardiovascular emergency hospital admissions after controlling for confounders. All variables were measured during 1 year from January 2012 to December 2012. Relative risks of admissions for respiratory and cardiovascular diseases were calculated for an increase in 10 µg.m−3 of pollutant concentrations. Total respiratory admissions were significantly associated with the levels of PM10 (1.012 [95% CI: 1.004–1.02] per 10 μg.m−3 rise in daily mean pollutant concentration for PM10 and 1.016 [95% CI: 1.000–1.032] for PM2.5 on the same day. With regard to susceptible groups, total respiratory admissions were associated with PM2.5 and PM10 within the same day in children (RR, 1.013 and 1.014; 95% confidence interval, 0.985–1.042 and 1.000–1.029 for PM2.5 and PM10, respectively). Moreover, a nearly significant association was found between particles and total circulatory admissions for adults and elderly groups in the same day. These results are similar to other international studies. Therefore, air pollution control is expected to reduce the number of admissions of these diseases in Lebanon.
3 Introduction
Air pollution episodes have raised public health concerns since the beginning of the previous century. Air pollution disasters in the Meuse valley in 1930, in Donora, Pennsylvania, in 1948, and in London in 1952, have shown that extremely high levels of particulate-based smog can produce a large increase in the daily mortality rate.
Since the London pollution episodes, air pollution has been associated with an increase in mortality and hospital admissions for diseases of the respiratory system (Bell and Davis, 2001; Bell et al. 2004). During the past decades, many studies have shown that high concentrations of air pollutants, specifically particulate matter (PM), lead to an increase in hospital admissions for diseases of the respiratory and cardiovascular systems (Wilson et al. 1997; Fusco et al. 2001; Le Tertre et al. 2002; Hosseinpoora et al. 2005; Kassomenos et al. 2008). Even low levels of air pollution are associated with negative health effects (Touloumi et al. 1996; Schwartz et al. 1996; Brunekreef and Holgate 2002).
Although Lebanon is a highly polluted country (Farah et al. 2014), only the last decade has experienced an increase in environmental investigations on air quality. These studies have covered a variety of issues related directly or indirectly to air pollution, such as the contribution of the transportation sector in greenhouse gas emissions Fadel and Bou-Zeid 1999), and vehicle and emissions sources in Beirut (El-Fadel and Hashisho 2000; Saliba et al., 2006). Previous studies have even attempted to quantify the health effects of air pollution (Salameh et al. 2006), but limitations have been present.
We conducted the Beirut Air Pollution and Health Effects (BAPHE) study based on the findings of international and local studies, and a validated methodology (Mrad Nakhlé et al. 2013). This study aimed to investigate the relationship between PM concentrations in the city of Beirut and daily emergency hospital admissions for diseases of the respiratory and cardiovascular systems. This study also aimed to determine how this relationship varied in susceptible groups.
4 Materials and methods
The data reported here are part of the BAPHE study, an eco-epidemiological time-series project aiming to quantify the short-term health effects of air pollution in Beirut (Mrad Nakhlé et al. 2013). The relationship between daily levels of particulate matter PM10 and PM2.5 and emergency hospital admissions for respiratory and cardiovascular conditions was evaluated from January 2012 to December 2012. Potential confounders were taken into consideration. Because the data that were collected and analyzed for this study do not involve personal data, consent was not specifically obtained. Therefore, this project was reviewed and exempted by the ethics review board of each participating hospital.
Data
a) Study area
Beirut is located on the eastern coast of the Mediterranean Sea, covering an area of 20.8 km2, where 378,485 individuals live (MOPH 2010). Beirut is characterized by two hills, separated by a thalweg. Each hill is approximately 100 meters above sea level. Both hills overlook the Mediterranean Sea from the north and west sides of the city. This complex and unusual topography with street canyons plays an important role in climate parameters, such as diversion of air masses and sunshine (Chelala 2008). Therefore, the sea allows dissipation of pollutants by winds along the coast, but the land-facing sides of the hills are sheltered from the dominant wind. Beirut exhibits variations in temperature between the center and the suburbs, which implies a change in pollution levels. Therefore, if conditions are adequate, inversion occurs, and pollutants are trapped. Finally, the main sources of pollution in Beirut are vehicle traffic, and industrial activity is not well developed in the surrounding city (Massoud et al. 2011).
b) Air pollution and weather data
Evaluation of air pollution data was conducted in two stages to determine if an epidemiological study would be informative. The first study covered the data collected between 2004 and 2005. The second
5
study evaluated the quality of data extracted for the year 2012 and the possibility of using it in the BAPHE study.
In Beirut, air pollutant data are collected by the Air Quality Research Unit (AQRU) network. This network has stations in the city of Beirut, and has been operating since 2004. The main pollutants that are measured are NO2, PM10, PM2.5, and O3. Details for monitoring methods were developed in a previous study. The first phase of BAPHE analysis was for a period of 12 months and considered PM10 and PM2.5as pollution indicators because NO2 data were only available for 6 months, which is too short for time series analysis. PM10 and PM2.5 were collected hourly and we calculated daily averages from the closest monitoring site to the hospitals. In case of failure to collect data,the rule of 75% was applied to calculate daily values, otherwise values were missing. Missing values were replaced by the monthly average ofthe period. Quality assurance procedures and instructions were implemented in each step of the measurement’s process.
Several studies in the last decades have taken into account the effect of changes in the weather when modeling emergency hospital visits or hospital admissions (Wilson et al. 1997; Kassomenos et al. 2008; Zhang et al. 2011). Therefore, we collected mean daily relative humidity, temperature, wind direction, and speed data from the AQRU surveillance station. Seasonality was also controlled in the time series model.
c) Hospital admissions data
Because the health system is not computerized in Lebanon and to better estimate the health effects of PM2.5 and PM10 on health, we previously studied the quality of health data collected from Lebanese hospitals (Mrad Nakhlé et al. 2013).
Health data were extracted from emergency hospital admission registers of seven hospitals in Beirut by trained individuals. Seven of the nine eligible hospitals in Beirut were included. The selection of hospitals
6
followed a procedure described in a previous study (Mrad Nakhlé et al. 2013). Data on age, sex, date of admission, first diagnosis, final discharge diagnosis, treatment in the emergency room (ER), and whether patients had been admitted or transferred to other hospitals were obtained on a daily basis for selected symptoms. Several causes of emergency admissions are considered in the BAPHE study. In this study, we considered information on emergency hospital admissions for diseases of the respiratory (J00–J99) and cardiovascular (I00–I99) systems as per the Tenth Revision of the International Classification of Diseases from only six hospitals. Data from participating hospitals were reorganized to produce total daily hospital admissions in the diagnostic categories mentioned above.
d) Data on potential confounders
In some previous studies, data on influenza epidemics or the daily number of hospital admissions for influenza were collected or considered (Katsouyani et al. 1995; Wilson et al. 1997; Fusco et al. 2001). We collected data on potential confounders, such as flu episodes, but we could not use them as a control because the diagnostic process in Lebanese hospitals does not allow for avoiding misclassification in the case of influenza. Therefore, we controlled for the flu season (December to January), but not for the number of flu/influenza admissions, while estimating the relative risk in our model. Daily pollen count was not collected because of the nonavailability of data.
e) Data analysis
Descriptive analysis was performed to present the quantitative variables (hospital admissions, level of pollutants, and environmental factors) as mean and standard deviation according to quarters, flu season, and day of the week. Additionally, Spearman’s coefficient was calculated for the environmental variables to ensure that there was no correlation between them. Time series plots were created to identify possible trends and medium-term variation throughout the year.
7
Distributed-lag model analysis was performed to study the association between hospital admissions for selected conditions (diseases of the respiratory and cardiovascular systems) and the level of pollutants at different lags, controlling for possible confounding factors, such as mean daily temperature, relative humidity, day of the week, and flu period. The generalized additive model was used under the distributed-lag model framework, where the dependent variable (Gasparini and Armstrong 2013), hospital admissions, was a count variable following a Poisson distribution. For the independent variables, a natural cubic spline with five degrees of freedom was used to account for seasonal variability. With regard to the air pollutant variables (PM2.5 and PM10), a basis function was used for the lagged variable, using a polynomial of the fourth degree (df=5), assuming that the relationship between the dependent variable and the predictor was linear.
No transformations were performed for the other covariates. Temperature and relative humidity were introduced in the model as continuous, whereas the variable of the day of the week was transformed into a binary variable, with two modalities being either weekday or weekend. Finally, the flu period was also a binary variable, where the period was defined between 1 December and 31 January inclusive.
The reference value for PM2.5 concentrations was set at 25 µg/m 3
and that of PM10 was 50 µg/m 3
. Relative risks (RRs) are shown as a 10-unit increase in PM from the reference. Analyses were performed using the R package, with the libraries MGCV, DLNM, and Splines.
Results
Characteristics of admissions
This first stage of the BAPHE study was conducted for 12 months (January 2012–December 2012). Approximately 80,000 patients visiteed the emergency department of six hospitals in Beirut during this study period. Among these, 11,534 were diagnosed with respiratory, circulatory, cerebrovascular, and allergic skin diseases. A total of 4,016 patients were diagnosed with circulatory diseases and 6,790 with
8
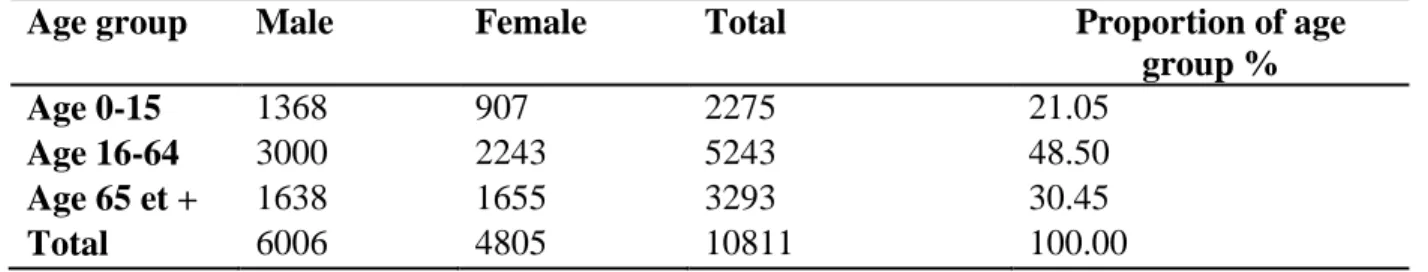
respiratory symptoms. Table 1 shows the main characteristics of the patients considered in the BAPHE study. Approximately 70% of patients whose data were collected belonged to the age group younger than 65 years.
The daily number of emergency hospital admissions ranged from 3 to 46 admissions, and from 2 to 24 admissions for respiratory and circulatory diseases, respectively (Table 2). The daily mean number of emergency hospital admissions (± standard deviation) was 19±7 for respiratory admissions and 11±4 for circulatory admissions. From December to January and May to July, the daily number of admissions for respiratory disease was higher compared with that for the rest of the year (Figure 1). The high level of respiratory admissions in the first period can be explained by the flu season, but the second increase can be attributed to air pollution and particles because there is no flu or epidemic season at this time of the year. Besides, the results of Farah and co-authors in 2014 (Farah et al., 2014) conform that PM2,5 and PM10 concentrations were higher in June and July 2012 compared with other periods of the year.
Characteristics of PM10 and PM2.5 and meteorological factors
Table 2 shows the descriptive statistics of PM10 and PM2.5, and meteorological factors. PM10 and PM2.5 concentrations were measured on 366 days, from January to December 2012. The daily average concentrations of PM10 and PM2.5 were 50.5±32.12 µg.m−3 and 30.16±19.17 µg.m−3, respectively. During the study period, the mean daily temperature was 19.69 °C and humidity was 52.05%, reflecting the typical Mediterranean climate.
Table 3 shows the Spearman correlation coefficients between air pollutants and meteorological variables. The correlation coefficient between PM10 and PM2.5 was high, suggesting that a large fraction of PM10 contains fine particles, thus having a large impact on health. Daily temperature and humidity were not significantly correlated with PM10 and PM2.5.
9 Exposure-response relationships
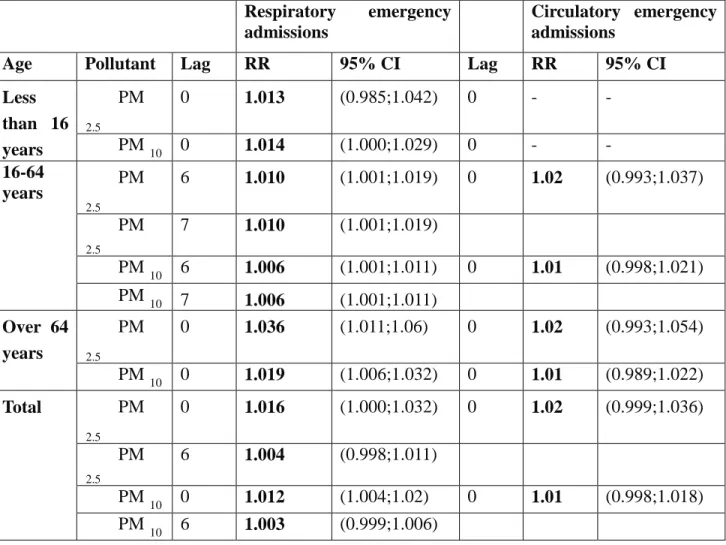
Table 4 shows the association between PM10, PM2.5 and the number of emergency admissions due to diseases of the respiratory and cardiovascular systems in a one pollutant model. After controlling for long-term trends, the “day of the week” effect, and confounding meteorological factors, we used the generalized additive model to estimate the exposure-response relationship. The response function was expressed in a RR scale with the corresponding 95% confidence interval (95% CI) for every 10-unit rise from reference in PM10 and PM2.5 (Gasparini and Armstrong, 2013) related to a change in the number of emergency hospital admissions. The results were classified by age to control for potential confounding and for different lags. Total respiratory admissions were significantly associated with the levels of PM10. RR were 1.012 [95% CI: 1.004–1.02] per 10 μg.m−3 rise in daily mean pollutant concentration for PM10 and 1.016 [95% CI: 1.000–1.032] for PM2.5 on the same day. A nearly significant association was also observed after 6 days (at lag 6).
Significant associations at lags 6 and 7 were also found between PM10 and PM2.5 and respiratory admissions in the adults group. The delayed lag effect obtained for this category could be because Lebanese patients might take a longer time before being hospitalized because of cultural factors and physicians’ visits in private clinics. Cumulative exposure was addressed during data analysis and no significant association was found before lag 6 and 7. RRs were 0.997 [95% CI: 0.986–1.008] and 1.008 [95% CI: 1.000–1.016] at lags 2 and 5 respectively.
In children, total respiratory admissions were associated with PM2.5 and PM10 concentrations. The RRs (95% CIs) were 1.013 (0.985–1.042) and 1.014 (1.000–1.029) for PM2.5 and PM10 within the same day, respectively. This relation was almost significant for PM2.5.
RRs (95% CIs) for diseases of the respiratory system in the elderly group were 1.036 (1.011–1.06) for PM2.5 and 1.019 (1.006–1.032) for PM10. This result is consistent with international studies (Shwartz
10
1995; Martins 2002; Chen 2004), which showed that elderly people (aged >65 years) are more sensitive to pollutants than young people.
Moreover, a nearly significant association was found between PM10 and PM2.5 and total circulatory admissions for the adults and elderly groups in the same day. For every increase in 10 μg.m−3 in daily mean levels of PM2.5 and PM10, the RRs and 95% CIs were 1.02 (0.993–1.037) and 1.0 (0.998–1.021) in the adults group and 1.02 (0.993–1.054) and 1.01 (0.989–1.022) in the elderly group.
Discussion
The BAPHE study has shown, for the first time in Lebanon, the short-term relationship between air pollution and emergency hospital admissions for respiratory and cardiovascular diseases. Previously, only a pilot case-control study was conducted in two tertiary care hospitals. Additionally, cases exclusively consisted of patients diagnosed with chronic bronchitis by a pulmonologist and controls included individuals free of any respiratory signs or symptoms. Chronic bronchitis was significantly related to living close to a busy road (adjusted odds ratio: 1.95, 95% CI: 1.31–2.89) and to a local power plant (adjusted odds ratio: 1.62, 95% CI: 1.07–2.45). We took into account various factors when planning our study. First, potential participating hospitals were considered based on a selection criterion and on their ability to provide data. Our data collection and analysis methodology were centralized in one location and verified by three people, thus providing homogeneity. Health and environmental data and information on confounders were collected following specification and predefined forms to ensure consistency.
Second, our model considered the main confounders that could affect the study. Meteorological factors and periodic fluctuations in hospital admissions, such as flu season, were controlled. However, data were not available for pollen count, as reported in several international studies (Wordley et al. 1997; Wong et al. 1999; Hosseinpoora et al. 2005), and this could represent a residual source of confounding due to
11
asthma. The first phase of the study was short compared with other multicenter studies, but the mean daily admissions for respiratory and cardiovascular illnesses were relatively large for the study area.
Our findings are similar to those of in European countries and US cities (Le Tertre et al. 2002; Bell al. 2004; Hosseinpoora et al. 2005; Kassomenos et al. 2008). Our estimated short-term size effect of PM10 for an increase of 10 µg.m−3 was 1.2% in respiratory admissions, which falls within the range (0.8–3.4%) reported by Dockery et al. (1993). Our results are consistent with findings reported by Wong et al. in 1999 and Joel Schwartz in 1995 on the association between air pollution and hospital admissions for respiratory diseases, especially for the elderly group.
Anderson et al. (1995) showed a non-significant increase in respiratory diseases for all age groups. However, their analysis of the 65+ age group showed an important relative risk (RR = 1.19) for respiratory diseases, which agrees with our results. Comparison with research conducted in 1999 in Birmingham (Wordley et al) confirmed our results on the significant association between PM10 and respiratory admissions. Moreover, Schwartz and Morris (1955) described a significant association between PM10 and hospital admissions for cardiovascular diseases. Our study showed a relation between cardiovascular diseases and an increase in PM10 concentrations, but this was not conclusive because it was barely significant, which is consistent with the results of a study conducted in Brisbane, Australia (Petroeschevsky et al. 2001).
The significant short-term relationship found in children is consistent with the long-term results of a Dutch cohort study (Brauer et al. 2002), an Austrian study on the effect of PM10 and other pollutants on respiratory function in children (Horak et al. 2002), the Swiss Study on Childhood Allergy and Respiratory Symptoms with Respect to Air Pollution, Climate and Pollen (Braun-Fahrlander et al. 1997), and the International Study of Asthma and Allergies in Childhood in France (Penard-Morand et al. 2005).
12
The risk estimation attributed to PM10 and PM2.5 during the study period can be considered as an effect of particulate alone or combined effects of several pollutants. In the urban are of Beirut, only NO2 and particulate matter exceed the standards recommended by the WHO. Therefore, we studied the effect of NO2 in our model to confirm its role. We recalculated the RR by controlling for NO2 levels over 6 months. The RR for emergency hospital admission did not change. However the IC was slightly modified because of the power of the sample after integrating NO2 in the model (Table 5).
A significant delay (6 to 7 days) was observed between the increase in air pollution level and emergency hospital admission in the adults group, which is consistent with several international studies (Martins et al. 2002). Moreover, we attempted to understand this delay, and found that socioeconomic and cultural factors affect the time between the first symptoms of disease and seeking medical care in the ER. Lebanese people have relatively easy access to physicians in private clinics in the acute setting, and can therefore be overlooked when analyzing only ER data. When their symptoms are severe, they are referred to hospitals for admission. Therefore, the entire process of hospital admissions is delayed, and the proportion of people arriving to the ER could represent severe cases. Additionally, economic situations can force patients to postpone medical care.
The prospective data compilation in the BAPHE study should be considered an advantage of the study. Data were extracted especially for the project and not for other reasons. In some cases, there was a lack of criteria that did not directly affect the study and could be controlled by the quality assurance procedure. The registration system in the ER varies among participating hospitals. Therefore, misclassification can occur, but it would not affect the association between pollutants and the daily number of admissions.
Of the three AQRU surveillance stations in Beirut, pollution data for measuring air quality were collected from only one. However, the station we consistently used during the study period was the most adequate source. Wordley and co-authors (1997) showed a significant variation in pollutant levels between
13
different stations, but data can be obtained from one station as a proxy for the air pollution levels required for time series studies.
Finally, similar to all eco-epidemiological studies, the BAPHE has an important limitation, which is the inability to estimate exposure precisely. Therefore, cause-effect relations were unable to be addressed.
Conclusion
Worldwide, many studies have shown adverse effects of air pollution on health. The BAPHE study is the first to attempt to study this relation in Lebanon. The main reason for conducting such studies is to redesign public health policies and reevaluate air quality standards. We provided new evidence on adverse health effects of particles in Beirut. We observed a significant effect of PM on emergency hospital admissions for diseases of the respiratory and cardiovascular systems. Our results have a similar range to those already published worldwide, suggesting that serious interventions are required to redefine Lebanese public health objectives, air quality standards and their enforcement.
Compliance with Ethical Standards
The authors declare that they have no competing interests. The research does not involve human participants or animals. Authors only worked on anonymous data; therefore they didn’t get any informed consent from patients. The authors ensure that the research totally comply with ethical standards.
Acknowledgments
The authors wish to thank the University of Saint Joseph, the Lebanese nongovernmental arcenciel organization, and the French-Lebanese CEDRE program (a joint initiative of the Ministry of Foreign Affairs in France and the Ministry of Higher Education and Research in France and Lebanon) for financial support of this research. We thank Hotel Dieu de France Hospital HDF, University Medical Center Rizk Hospital, Trad Hospital, Rosaire Hospital, Libanais Hospital (Geitawi), Makassed Hospital,
14
and St Georges University Medical Center, for providing health data. We thank the Lebanese AQRU for providing air pollution data.
References
1- Bell, ML., Davis, DL., Fletcher, T (2004). A Retrospective Assessment of Mortality from the London Smog Episode of 1952: The Role of Influenza and Pollution. Environmental Health Perspectives, 112, 6-8.
2- Bell, ML., and Davis, DL. (2001). Reassessment of the Lethal London Fog of 1952: Novel Indicators of Acute and Chronic Consequences of Acute Exposure to Air Pollution. Environmental Health Perspectives, 109 (suppl 3), 389–394.
3- Wislon, AM.et al. (2005). Air pollution, weather, and respiratory emergency room visits in two northern New England cities: an ecological time series study. Environmental Health, 97, 312-321.
4- Fusco, D. Et al.(2001). Air pollution and hospital admissions for respiratory conditions in Rome, Italy. European Respiratory Journal, 17, 1143-1150.
5- Hosseinpoora, AR. Et al. (2005). Air pollution and hospitalization due to angina pectoris in Tehran, Iran: A time-series study. Environmental Research, 99, 126–131.
6- Le Tertre, A. et al. (2002). Short-term effects of particulate air pollution on cardiovascular diseases in eight European cities. Journal of Epidemiology and Community Health , 56, 773-779.
7- Kassomenos, P. et al. (2008). Assessment and prediction of short term hospital admissions: the case of Athens, Greece. Atmospheric Environment, 42, 7078-7086.
8- Brunekreef, B. and Holgate, ST. (2002). Air pollution and health. Lancet, 60, 1233-1242.
9- Touloumi, G. et al. (1996). Daily mortality and winter type air pollution in Athens, Greece-a time series analysis within the APHEA project. Journal of Epidemiology and Community Health, 50(supl.1), S47-S51.
10- Schwartz, J.et al. (1996). Methodological issuess in studies of air pollution and daily counts of deaths or hospital admissions. Journal of Epidemiology and Community Health, 50(supl.1), S3-11.
15
11- Farah, W. et al. (2014). Time series analysis of daily air pollution in Eastern Mediterranean city Beirut, Lebanon. Environmental Monitoring and Assessment EMAS, 186, 12:8203-8213. DOI: 10.1007/s10661-014-3998-9
12- El-Fadel, M. and Bou-Zeid, E. (1999). Transportation GHG emissions in developing countries. The case of Lebanon. Transportation Research Part D, 4, 251-264.
13- El-Fadel, M. and Hashisho, Z. (2000). Emissions and air quality assessment in roadway tunnels: the Salim Slam tunnel. Transportation Research Part D, 5, 355±372.
14- Saliba, N A. et al. (2006). Variation of selected air quality indicators over the city of Beirut, Lebanon: Assessment of emission sources. Atmospheric Environment, 40, 3263-3268.
15- Salameh, P. et al. (2012). Exposure to outdoor air pollution and chronic bronchitis in adults: a case-control study. International Journal of Occupational and Environmental Medicine, 3(4), 165-77.
16- Mrad Nakhlé, M. et al. (2013). Analyse de la qualité des données issues des hôpitaux de Beyrouth Municipe pour mesurer les effets à court terme de la pollution atmosphérique. Revue d’Epidémiologie et de Santé Publique, 61, 551-558.
17- Ministry of Public Health publications, MOPH, 2010.
18- Chelala, C. Transports routiers et pollution de l’air en NO2 dans Beyrouth (Liban) application du modèle street. PhD thesis 2008. Université Saint Joseph, Geography Department.
19- Massoud, R. et al. (2011). Intraurban variability of PM10 and PM2.5 in an Eastern Mediterranean city. Atmospheric Environment, 101, 893-901.
20- Zhang, F. et al. (2011). Time series studies on air pollution and daily outpatient visits for allergic rhinitis in Beijing, China. Science of the Total Environment, 409, 2486-2492.
21- Katsouyanni, K. et al. (1995). Short-term effects of air pollution on health: a European approach using epidemiological time-series data. The APHEA project: background, objectives, design. European Respiratory Journal, 8, 1030–1038.
16
22- Gasparrini, A. and Armstrong, B. (2013). Distributed lag non-linear models in R: the package dlnm. London School of Hygiene and Tropical Medicine, UK. dlnm version 1.6.7, 05-16.
23- Farah, W. et al. (2014). Analysis of the continuous measurements of PM10 and PM2.5 concentrations in Beirut, Lebanon, registered within the Editorial Office of Environmental Engineering and Management Journal as manuscript 871_Farah_13 and accepted for publication.
24- Schwartz, J. (1995). Short term fluctuations in air pollution and hospital admissions of the elderly for respiratory disease. Thorax, 50,531-538.
25- Chen Y et al. (2004). Influence d'un bas niveau de pollution particulaire de l'air sur les hospitalisations pour broncho-pneumopathie chronique chez les personnes âgées. Inhalation Toxicology, 16, 21-5.
26- Martins, L. et al.(2002). Air pollution and emergency room visits due to chronic lower respiratory diseases in the elderly: an ecological time-series study in São Paulo, Brazil. Journal of Occupational and Environmental Medicine, 44(7), 622-627.
27- Wordley, J. et al. (1997). Short term variations in hospital admissions and mortality and particulate air pollution. Occupational and Environmental Medicine, 54, 108-116.
28- Wong, TW. et al. (1999). Air pollution and hospital admissions for respiratory and cardiovascular diseases in Hong Kong. Occupational and Environmental Medicine, 56, 679-683.
29- Dockery, DW. et al. (1993). An association between air pollution and mortality in six US cities. The New England Journal of Medicine, 329, 1753-9.
30- Schwartz, J. (1995). Short term fluctuations in air pollution and hospital admissions of the elderly for respiratory disease. Thorax, 50(5), 531–538.
31- Ross Anderson, H.et al. (1995). Health effects of an air pollution episode in London. Thorax, 5O, 1188-1193.
32- Schwartz, J. and Morris, R. (1955). Air pollution and hospital admissions for cardiovascular disease in Detroit, Michigan. American Journal of Epidemiology, 142, 23-35.
17
33- Petroeschevsky, A. et al. (2001). Associations between outdoor air pollution and hospital admissions in Brisbane, Australia. Archive of Environmental Health, 56(1), 37-52.
34- Brauer, M. et al. (2002). Air pollution from traffic and the development of respiratory infections and asthmatic and allergic symptoms in children. American Journal of Respiratory and Critical Care Medicine, 166, 1092-8.
35- Horak F et al. (2002). Particulate matter and lung function growth in children: a 3-yr follow-up study in Austrian schoolchildren. European Respiratory Journal, 19, 838-45.
36- Braun-Fahrlander, C. et al. (1997). Respiratory health and long-term exposure to air pollutants in Swiss schoolchildren. SCARPOL Team. Swiss Study on Childhood Allergy and Respiratory Symptoms with Respect to Air Pollution, Climate and Pollen. American Journal of Respiratory and Critical Care Medicine, 155, 1042-9.
37- Penard-Morand, C. et al. (2005). Long-term exposure to background air pollution related to respiratory and allergic health in schoolchildren ISAAC . Clinical and Experimental Allergy, 35, 1279-87.
38- Martins LC, et al. (2002). Air pollution and emergency room visits due to chronic lower respiratory diseases in the elderly: an ecological time-series study in São Paulo, Brazil. Journal of Occupational and Environmental Medicine, 44(7), 622-627.
1/ 1/ 2012 2/ 1/ 2012 3/ 1/ 2012 4/ 1/ 2012 5/ 1/ 2012 6/ 1/ 2012 7/ 1/ 2012 8/ 1/ 2012 9/ 1/ 2012 10/ 1/ 2012 11/ 1/ 2012 12/ 1/ 2012 0 100 200 300 0 100 200 0 10 20 30 0 40 80 0 10 20 0 20 40 1/ 1/ 2012 2/ 1/ 2012 3/ 1/ 2012 4/ 1/ 2012 5/ 1/ 2012 6/ 1/ 2012 7/ 1/ 2012 8/ 1/ 2012 9/ 1/ 2012 10/ 1/ 2012 11/ 1/ 2012 12/ 1/ 2012 P M 1 0 ( µg/ m 3 ) P M 2 .5 ( µg/ m 3 ) T ( o C) H R (%) I00 I 9 9 J 00 J 9 9 Figure 1 Time series plots of selected air pollutants, meteorological data and hospital admissions for respiratory diseases (J00-J99) and
Tables
Table 1: Characteristics of emergency hospital admissions patients for diseases of respiratory and circulatory systems.
Age group
Male
Female
Total
Proportion of age
group %
Age 0-15
1368
907
2275
21.05
Age 16-64
3000
2243
5243
48.50
Age 65 et +
1638
1655
3293
30.45
Total
6006
4805
10811
100.00
Table 2: Descriptive statistics of daily pollutants concentrations (µg.m-3), meteorological variables and hospital admissions (diseases of the respiratory system (J00-J99) and system (I00-I99), 2012.
Statistic
PM10
(µg.m
-3)
PM2.5
(µg.m
-3)
T(
˚C) R
H(%)
Number of
admissions
I00 to I99
Number of
admissions
J00 to J99
No. of observations
366.00
366.00
366.00 366.00
366.00
366.00
Minimum
15.96
4.24
7.21
33.50
2.00
3.00
Maximum
359.67
208.61
28.50
75.04
24.00
46.00
1st Quartile
32.78
18.61
15.17
45.72
8.00
14.00
Median
43.92
26.63
19.69
50.02
10.00
18.00
3rd Quartile
58.40
35.92
25.16
57.75
13.00
23.00
Mean
50.54
30.16
19.69
52.05
11.00
19.00
Standard deviation
32.12
19.17
5.62
8.53
4.00
7.00
Table 3 Correlation coefficients between air pollutants and meteorological variables
Correlation matrix (Spearman):
Variables
PM10
PM2.5
T
HR
PM10
1
0.855
0.326
0.158
PM2.5
0.855
1
0.368
0.196
T
0.326
0.368
1
0.314
HR
0.158
0.196
0.314
1
Table 4: Relative Risks (95% CIs)/10µg.m-3 increase in air pollutant for respiratory (J00-J99) and cardiovascular (I00-I99) admissions by age group (single pollutant model).
CI: confidence interval
Respiratory
emergency
admissions
Circulatory emergency
admissions
Age
Pollutant
Lag
RR
95% CI
Lag
RR
95% CI
Less
than 16
years
PM
2.50
1.013
(0.985;1.042)
0
-
-
PM
100
1.014
(1.000;1.029)
0
-
-
16-64
years
PM
2.56
1.010
(1.001;1.019)
0
1.02
(0.993;1.037)
PM
2.57
1.010
(1.001;1.019)
PM
106
1.006
(1.001;1.011)
0
1.01
(0.998;1.021)
PM
107
1.006
(1.001;1.011)
Over 64
years
PM
2.50
1.036
(1.011;1.06)
0
1.02
(0.993;1.054)
PM
100
1.019
(1.006;1.032)
0
1.01
(0.989;1.022)
Total
PM
2.50
1.016
(1.000;1.032)
0
1.02
(0.999;1.036)
PM
2.56
1.004
(0.998;1.011)
PM
100
1.012
(1.004;1.02)
0
1.01
(0.998;1.018)
PM
106
1.003
(0.999;1.006)
Table 5: Relative Risks (95% CIs)/10µg.m-3 increase in air pollutant for respiratory (J00-J99) and cardiovascular (I00-I99) admissions by age group after controlling for NO2