HAL Id: hal-03024508
https://hal.archives-ouvertes.fr/hal-03024508
Submitted on 8 Jan 2021HAL is a multi-disciplinary open access archive for the deposit and dissemination of sci-entific research documents, whether they are pub-lished or not. The documents may come from teaching and research institutions in France or abroad, or from public or private research centers.
L’archive ouverte pluridisciplinaire HAL, est destinée au dépôt et à la diffusion de documents scientifiques de niveau recherche, publiés ou non, émanant des établissements d’enseignement et de recherche français ou étrangers, des laboratoires publics ou privés.
AZTEK: Adaptive zero TE k-space trajectories.
Tanguy Boucneau, Brice Fernandez, Florent Besson, Anne Menini, Florian
Wiesinger, Emmanuel Durand, Caroline Caramella, Luc Darrasse, Xavier
Maître
To cite this version:
Tanguy Boucneau, Brice Fernandez, Florent Besson, Anne Menini, Florian Wiesinger, et al.. AZTEK: Adaptive zero TE k-space trajectories.. Magnetic Resonance in Medicine, Wiley, 2020, �10.1002/mrm.28483�. �hal-03024508�
AZTEK: Adaptive Zero TE K‐space trajectories
Tanguy Boucneau1, Brice Fernandez2 , Florent Besson1,5, Anne Menini3, Florian Wiesinger4,
Emmanuel Durand1,5, Caroline Caramella1, Luc Darrasse1 , and Xavier Maître1
1 Université Paris‐Saclay, CEA, CNRS, Inserm, BioMaps, Orsay, France 2 Applications & Workflow, GE Healthcare, Orsay, France 3 Applications & Workflow, GE Healthcare, Menlo Park, USA 4 Applications & Workflow, GE Healthcare, Munich, Germany 5Department of Biophysics and Nuclear Medicine, Hopitaux Universitaires Paris‐Saclay, Université Paris‐Saclay, Le Kremlin Bicêtre, France Corresponding author: Xavier Maître BioMaps CEA/DRF/Joliot/SHFJ 4, place du Général Leclerc 91401 Orsay Cedex, France E‐mail address: xavier.maitre@universite‐paris‐saclay.fr
Abstract
Purpose: Because of short signal lifetimes and respiratory motion, 3D MR lung imaging is still challenging today. Zero Echo‐Time (ZTE) pulse sequences offer promising solutions as they overcome the issue of short 𝑇 ∗. Nevertheless, as they rely on continuous readout gradients, the trajectories they follow in k‐space are not adapted to retrospective gating and inferred motion correction.Theory and methods: We propose AZTEK, a set of 3D radial trajectories featuring three tuning parameters to adapt the acquisition to any moving organ while keeping seamless transitions between consecutive spokes. Standard ZTE and AZTEK trajectories were compared for static and moving phantom acquisitions as well as for human thoracic imaging performed on three volunteers (one healthy and two patients with lung cancer). Results: For the static phantom, we observe comparable image qualities with standard and AZTEK trajectories. For the moving phantom, spatially‐coherent under‐sampling artifacts observed on gated images with the standard trajectory are alleviated with AZTEK. The same improvement in image quality is obtained in human so details are more delineated in the lung with the use of the adaptive trajectory. Conclusion: AZTEK opens the possibility for 3D dynamic ZTE lung imaging with retrospective gating. It enables to uniformly sample the k‐space for any arbitrary respiratory motion gate, while preserving static image quality, improving dynamic image quality and guarantying continuous readout gradient transitions between spokes, which makes it appropriate to ZTE.
INTRODUCTION
Lung is a challenging organ for proton MRI because of the short 𝑇 ∗ values of its parenchyma and because of respiratory motion (1). Thanks to the very short 𝑇𝐸 values they feature, 3D radial Ultrashort Echo‐ Time (UTE) (2) and Zero Echo‐Time (ZTE) (3‐7) pulse sequences were shown to be particularly adapted to short signal lifetime tissues and good candidates to probe the lung. Nevertheless, whereas the readout gradient is ramped up and down at each repetition in ultrashort TE, which allows periodic sampling of the k‐space center and arbitrary order of spokes in the k‐space trajectory, this gradient must inherently remain temporally‐continuous in ZTE, which allows only small angular increments between repetitions (8). One method of achieving ZTE imaging on clinical hardware is to use a pulse sequence consisting of two main parts: the WASPI sequence, which acquires the central region of the k‐space, and the rotating ultrafast sequence (RUFIS), which acquires the peripheral region of the k‐space. The k‐space trajectory for both the WASPI and RUFIS acquisitions is a 3D radial ‘kooshball’ where the different spokes are acquired along directions continuously varying along time (Figure 1, left). This trajectory, referred to as ‘standard’ in the following, is favored for several reasons: The radial nature of the trajectory was chosen because it allows us to encode signal and produce contrast in the image from short 𝑇 ∗ tissues in the most central parts of k‐space. This continuous succession of spokes gives the possibility to acquire several spokes during one segment, which is a group of spokes during which the readout gradient continuously evolves. This feature is important to theoretically achieve 𝑇𝐸 0. As successive spokes are applied with very close directions in k‐space, the actual readout gradient applied during the acquisition of one spoke acts as a spoiling gradient for the transverse magnetization produced during the acquisition of the previous spokes. Unfortunately, this strategy imposes trajectories which usually yield a non‐uniform coverage of the k‐ space after retrospective gating (Figure 1, right). Indeed, despite the overall uniform sampling at the acquisition, strongly undersampled regions show up in k‐space once retrospective gating is performed. In those k‐space regions, data information is critically missing to fully reconstruct the image. Those signal voids lead to strong spatially coherent artifacts in the final image, which can be confused with actual anatomical structures or lesions. Those artifacts would be smeared into a background noise if the spokes were more uniformly covering the k‐space. Several sampling strategies were investigated to optimize k‐space coverage for dynamic MRI, either by varying the spatial or temporal sampling density in radial or spiral acquisitions (2,3), by additionally permuting segments (4), or by evenly spacing radial readouts for view sharing with the Golden angle (5)along both polar and azimuthal directions in 3D radial MRI (8). Retrospectively gated k‐space sampling was optimized for even uniformity by motion model‐based segmentation of spiral trajectories (9). Three‐ dimensional radial spiral phyllotaxis trajectories were implemented to generate naturally optimized interleaving properties (10), and single echo with systematic initial superior‐inferior readout or double‐ echo UTE was used for retrospectively self‐gated lung MRI (11,12). Here, we propose AZTEK, an adaptive trajectory suited to ZTE requirements and respiratory‐gated lung imaging. As we will see, the radial nature of the trajectory remains unchanged while the subsequent spoke orientations are designed to comply with retrospective gating, without any compromise for ZTE imaging, especially without degradation of the spoiling properties of the readout gradients.
Figure 1 Left: Schematic representation of the standard zero‐TE (ZTE) trajectories followed during the rotating ultrafast sequence (RUFIS) and the water‐ and fat‐suppressed proton projection MRI sequence (WASPI) parts of the image acquisition process. Right: Representation of a sagittal slice of a thoracic ZTE image acquired on a healthy human volunteer freely breathing, and reconstructed from the full dataset with no respiratory motion correction (top), from 30 % of the dataset chosen uniformly in the k‐space (middle) and from 30 % of the dataset corresponding to the deflated lung state at each motion period (retrospective gating, bottom). On the right of each lung image, the spokes chosen for image reconstruction are represented as dots on a unit sphere, each dot representing the orientation of one spoke in the 3D k‐space. Green arrows represent locations in the image where motion correction is clearly visible (higher image sharpness, details made visible) and red arrows represent location where spatially coherent undersampling artifacts are visible.
THEORY
Every spoke of a 3D ‘kooshball’ k‐space coverage is characterized by two angles in spherical coordinates: a polar angle, 𝜃, and an azimuthal angle, 𝜑.
In the standard ZTE trajectory, k‐space is more frequently sampled along 𝜑 than along 𝜃 (Figure 2a). The first spoke is acquired along the positive direction 𝑧, where 𝜃 0 rad, and the last spoke is acquired along the negative direction – 𝑧, where 𝜃 𝜋 rad. All the other spokes are acquired with an angular coordinate 𝜃 continuously and monotonically varying between 0 rad and 𝜋 rad along the image‐ acquisition process, and with an angular coordinate 𝜑 continuously increasing with a 2𝜋 periodicity, to uniformly cover the 3D k‐space with the overall set of spokes orientations. Figure 2 Schematic representation of the possibilities offered by adaptative ZTE k‐space (AZTEK) trajectories (b‐f) in comparison with standard trajectories (a), and introduction of the three tuning parameters AZTEK‐Twist (c), AZTEK‐
Shuffle (d) and AZTEK‐Speed (e).
In the AZTEK trajectory, we switch the angle orders such that k‐space sampling is performed more frequently along 𝜃 than along 𝜑 (Figure 2b). In this case, constant‐𝜑 half‐circle arcs join at the two poles with 𝜃 ranging from 0 rad to 𝜋 rad. To avoid temporal oversampling around the poles, 𝜃 steps are modulated accordingly from one spoke to another, and 𝜃 values on two spatially adjacent arcs are shifted on a golden ratio basis to ensure sampling uniformity. In the following, the implementation of those two key features is fully detailed.
The distribution of spokes in AZTEK
Let 𝑁 and 𝑁 be the number of spokes on each arc and the total number of arcs in the trajectory, respectively. If 𝑁 is the total number of spokes for the acquisition trajectory, the two previous numbers verify the relationship:
The uniformity of the k‐space coverage by a set of spokes can be evaluated by the dispersion of Voronoi cell areas for every spoke on a unit sphere in the 3D k‐space. A Voronoi cell for a given spoke can be defined as the continuous set of points that are closer, according to the Euclidian metric, to the end tip of this spoke on a unit sphere with respect to any other spoke. Using the expression of an infinitesimal surface in spherical coordinates, which holds for dense sampling, the surface of the Voronoi cell for one given spoke can be well approximated by 𝑆 sin 𝜃 ∆𝜃 𝜃, 𝜑 ∆𝜑 𝜃, 𝜑 , [2]
where ∆𝜃 𝜃, 𝜑 and ∆𝜑 𝜃, 𝜑 represent the angular steps in terms of polar and azimuthal angular coordinates between a spoke located at angular coordinates 𝜃, 𝜑 and any direct neighbor spoke located on the same arc for ∆𝜃 𝜃, 𝜑 and on an adjacent arc for ∆𝜑 𝜃, 𝜑 . According to the uniformity requirements in AZTEK trajectories, ∆𝜑 𝜃, 𝜑 depends neither on 𝜃 nor on 𝜑. It is constant over the k‐ space and it is given by ∀𝜃 ∈ 0, 𝜋 , ∀𝜑 ∈ 0,2𝜋 , ∆𝜑 𝜃, 𝜑 ∆𝜑 with ∆𝜑 . [3] Similarly, ∆𝜃 does not depend on the arc itself and the associated azimuthal angle 𝜑, but on 𝜃 only: ∆𝜃 𝜃, 𝜑 ∆𝜃 𝜃 . Thereafter, the term sin 𝜃 ∆𝜃 𝜃 in Equation 2 is the same for every spoke of the trajectory and the associated probability density function, 𝑓 𝜃 , which governs the distribution of the spokes along the arc, is given by 𝑓 𝜃 𝜋sin 𝜃′ 𝑑𝜃′sin 𝜃 0 𝑓 𝜃 sin 𝜃2 . [4]
Hence, to achieve uniform sampling along any arc, the spokes need to be more densely distributed around the equator, defined by 𝜃 𝜋 2⁄ rad (where probability densities are maximal) than close to the poles, defined by 𝜃 0 rad and 𝜃 𝜋 rad (where probability densities are minimal).
In the following, the 𝑁 spokes must be distributed along each arc with 𝑁 values of 𝜃, spanned between 0 rad and 𝜋 rad. These 𝑁 values are ruled by the probability density function 𝑓 𝜃 defined in Equation 4. These values can be computed by inverse transform sampling upon the cumulative distribution function F corresponding to 𝑓:
F 𝜃 𝑓 𝜃′ 𝑑𝜃′
F 𝜃 .1 cos 𝜃2 . [5]
The inverse function of F, written F , is then
F 𝜉 arccos 1 2𝜉 , [6]
such that, according to the inverse transform sampling technique, 𝑁 values 𝜉 , with 𝑗 varying from 0 to 𝑁 1, must be chosen comprised between 0 and 1 along a uniform density distribution to eventually compute 𝜃 F 𝜉 , with 𝑗 ∈ ⟦0, 𝑁 1⟧. In this case, 𝜃 ∈ 0, 𝜋 and admits the expected probability density function 𝑓. The simplest choice is to pick up 𝑁 uniformly‐spaced values, with spacing ∆𝜉 1 𝑁⁄ , which leads to 𝜉 𝑗∆𝜉. By doing so, we ensure to uniformly cover the k‐space with the 𝑁 spokes. Figure 3 Representation of the spokes orientations on the unit sphere in k‐space without (left) and with (right) the golden ratio correction of 𝜃 coordinates between spatially adjacent arcs. The circular shapes (left) disappear after reordering based on the golden ratio for a far more uniform k‐space coverage (right).
However, if the exact same suite 𝜉 were used for every arc of the trajectory, circular shapes of constant 𝜃 values would cover the unit sphere introduced above (Figure 3, left). This would become an issue in the neighborhood of the poles, where the distance between spokes is large along the angular coordinate 𝜃 (∆𝜃 𝜃 ∝ 1 sin 𝜃⁄ increases when 𝜃 → 0 or 𝜋 rad) but short along the angular coordinate 𝜑 (sin 𝜃 ∆𝜑 decreases when 𝜃 → 0 or 𝜋 rad). It would lead to an over‐density of spokes along those circles and voids in between. To address this issue, we relied on an alternative strategy based on the golden ratio 𝜙 1 √5 /2. For each arc 𝑘, 𝑘 ∈ 0, 𝑁 1 , we redefine the previous suite of 𝜉 , 𝑗 ∈ ⟦0, 𝑁 1⟧, by
𝜉 𝑗∆𝜉 %1, [7]
where % is the modulo operator for the ratio between 𝑘 and 𝜙. Explained differently, we extract the decimal part of 𝑘 𝜙⁄ , which is thus comprised between 0 and 1. The use of the golden ratio in the definition of 𝜉 makes the spokes from spatially‐adjacent arcs well distributed: the final distribution of spokes in the 3D k‐space is now uniform (Figure 3, right).
The three tuning parameters of AZTEK
Thanks to this new way to define a 3D radial k‐space trajectory, AZTEK offers three degrees of freedom to control the spoke sequence and explore the k‐space: Each arc can be twisted by modulating 𝜑 as a function of 𝜃. The possibility to “twist” each arc joining the two poles allows sampling many directions in the 3D k‐space. However more spokes are then required on each arc to keep low‐amplitude gradient transitions between spokes. To perform this twisting, we implemented the parameter AZTEK‐Twist, which represents the rate of 𝜑 shifting as a function of 𝜃. Quantitatively speaking, if AZTEK‐Twist is set equal to 0, the angular coordinate 𝜑 remains constant on each arc as the angular coordinate 𝜃 evolves from 0 to 𝜋 rad (Figure 2b). If now AZTEK‐Twist is set equal to 1, the angular coordinate 𝜑 continuously and monotonically increases by up to 𝜋 rad on each arc as the angular coordinate 𝜃 evolves from 0 rad to 𝜋 rad (Figure 2c). Any increment can be applied to 𝜑 when a pole is reached while preserving the continuity of the readout gradients. This option provides the possibility to sample many directions in the 3D k‐ space with a small number of arcs. To tune the arc orientation change, we implemented the parameter AZTEK‐Shuffle, which is the fraction of the golden angle applied as 𝜑 shifts. Quantitatively speaking, if AZTEK‐Shuffle is set to 0, the arcs are successively applied with a minimal change in trajectory direction (and thus a change in the angular coordinate 𝜑 very close to 𝜋 rad) every time a pole is reached (Figure 2b). If now AZTEK‐Shuffle is set to 1, the arcs are successively applied with an increment of angular coordinate 𝜑 equal to the golden angle (𝜋 𝜙⁄ ≃ 1.942 rad) between the end of one arc and the beginning of the next one (Figure 2d). Interleaved 𝜃 reading can be performed to even more rapidly cover a great number of directions in k‐space. It is done by acquiring only a small number of equally spaced spokes on each arc for the entire trajectory and by recovering the missing spokes during successive repetitions of the trajectory. To control this option, we implemented the parameter AZTEK‐Speed, which indicates the number of spokes that are skipped between two successive readouts. Quantitatively speaking, if AZTEK‐Speed is set to 0, no spoke is skipped and the ordered list of readout gradients is continuously read from the beginning to the end (Figure 2b). If now AZTEK‐Speed is set to 1, one spoke is skipped after each readout and the ordered list of readout gradients is scanned twice along the same arc: a first time to read the spokes of odd indices and a second time to read those of even indices (Figure 2e). AZTEK‐Speed can be interpreted and used as an acceleration factor, which could be tuned such that a full, although undersampled, coverage of the k‐space can be performed along the motion dynamics.
The parameters AZTEK‐Twist, AZTEK‐Shuffle and AZTEK‐Speed modify, in three different ways, the trajectory implemented in the 3D k‐space. They represent independent degrees of freedom of the
effective final k‐space trajectory. Therefore, they can be jointly tuned to obtain a final trajectory that is adapted to the motion dynamics of the targeted organ and that uniformly covers the k‐space along any retrospective motion gate (Figure 2f). Thus, the trajectories are positively adaptive in AZTEK.
METHODS
ZTE acquisitions with standard and AZTEK trajectories were performed on the same 3T PET‐MRI scanner (Signa PET/MR, GE Healthcare, Waukesha, WI, USA). In the different experiments, motions were monitored with an abd4minal pneumatic belt. For every pulse sequence, the TR was equal to 1.97 ms and the readout bandwidth was ± 31.2 kHz. The WASPI acquisition comprised 1,024 spokes while the RUFIS acquisition comprised 40,000 spokes with 𝑁 200 and 𝑁 200. The total scan duration was 1 min 25 s. For both phantom and clinical studies, the AZTEK parameters were AZTEK-Twist 1, AZTEK-Shuffle 1, and AZTEK-Speed 4. The choice of this set of parameters was empirically made by testing different combinations of parameters through a grid-search (AZTEK-Twist 0, 1, 2, …; AZTEK-Shuffle 0, 1, 2, …; and AZTEK-Speed 0, 1, 2, …). For each combination, the AZTEK trajectory was computed before calculating the corresponding retrospectively-gated trajectory obtained with a formerly-recorded physiological respiratory signal. The set of optimal parameters was then selected according to the related metric value 𝒰.
Phantom study
Images of a GE structured water phantom were acquired both in static and dynamic modes. The choice of trajectory (standard or AZTEK) was the same for both RUFIS and WASPI acquisitions. Concerning the dynamic mode, the phantom was put into motion by periodically translating the patient bed during the acquisition with an amplitude of 30 mm and a time period of 5 s. The ZTE acquisitions were performed with a cubic FOV of 28 cm, an isotropic voxel size of 1.4 mm and a flip angle of 4°.Clinical studies
Three volunteers (1 healthy and 2 patients with lung cancer in freely‐breathing position) were recruited. One patient had two acquisitions in a 2.5‐month delay time (baseline and mid treatment scan). The clinical studies complied with the Declaration of Helsinki principles and were approved by a national institutional review board. Written informed consent was obtained from the three volunteers. The ZTE acquisitions were performed with a cubic FOV of 32 cm, an isotropic voxel size of 1.6 mm and a flip angle of 3°.Motion correction, image reconstruction and analysis methods
All the images were reconstructed with the Berkeley Advanced Reconstruction Toolbox (13). For the phantom dataset acquired with only one reception channel (body coil), a non‐uniform fast Fourier
transform algorithm was used for reconstruction without any regularization. For human datasets acquired with the 30‐channel thoracic phased array GE GEM coil, a parallel imaging and l1‐wavelet compressed sensing algorithm was used in combination with an ESPIRiT autocalibration step (14), which estimates the coil sensitivity profiles directly from the MR data. Two iterations and a regularization parameter equal to 0.005 for the l1‐wavelet term were prescribed for the image reconstruction in human. With such a small number of iterations, the data processing was similar to wavelet denoising. Motion correction was performed by selecting a given percentage of the data in the RUFIS acquisition, which corresponded to one given extremal motion state: one of the two extremal positions for the phantom studies and the lung functional residual capacity (FRC at the end of expiration) for the human studies. However, the whole dataset that was acquired during the WASPI acquisition was considered for the reconstruction. For all the reconstructions, only radial density compensation was considered to correct for the non‐uniform k‐space sampling.
To verify the angular uniformity of k‐space coverage after retrospective gating, each spoke of the trajectory was represented by its end tip as the point on a unit sphere sharing the same 𝜃, 𝜑 coordinates. Quantitatively, the sphere‐restricted Voronoi diagram of this set of points could be computed and its characteristics studied (15). However, simple metrics based on Voronoi diagrams on a sphere, like the surface of the Voronoi cells, may fail to properly estimate the coverage uniformity. For example, if all the spokes were characterized by 𝜃 𝜋 2⁄ and 𝜑 values uniformly chosen in 0,2𝜋 , Voronoi cell surfaces would be similar despite the weak k‐space coverage uniformity.
Instead, for each gate dataset, we chose 𝑁 random points on the sphere, computed the distance between each of these points and its nearest spoke neighbor, written as 𝐷 , and compared the overall average distance, 𝐷 , with the same average distance computed for random coverage of the retrospective gate k-space, 𝐷 . To normalize the comparison, a coverage uniformity metric, written as 𝒰, was defined as
𝒰 1 tanh 𝐷𝐺𝑎𝑡𝑒 𝑁𝑇𝑒𝑠𝑡 𝐷𝑅𝑎𝑛𝑑 𝑁𝑇𝑒𝑠𝑡 1 , [8] such that 𝒰 → 0 when 𝐷 ≫ 𝐷 𝒰 1 when 𝐷 𝐷 𝒰 → 2 when 𝐷 ≪ 𝐷
Hence, the metric 𝒰 is expected to vary with the obtained uniformity from 0 when the k-space coverage is not uniform, to 1 when it is as uniform as random coverage, and above 1 when the coverage uniformity is better than for random coverage.
The value of 𝒰 was calculated for both standard and AZTEK trajectories, and the corresponding metrics were respectively written 𝒰 and 𝒰 . As these computed values depend on the set of
randomly chosen spokes, we performed five estimations of each metric from five different random spoke sets, and expressed each quantity as its mean ± SD over the five estimations. For each estimation, 𝑁 was set as 10 times the number of spokes in the experimental or random gate under consideration.
RESULTS
Figures 4 and 5, respectively, show the static phantom images and the dynamic phantom images retrospectively gated obtained with the standard and AZTEK trajectories. For each situation, three orthogonal views centered on the phantom are represented. In Figure 4, the amplified absolute difference of the two rows above is represented for image quality comparison. These images were reconstructed from the full dataset (the 40,000 spokes of the RUFIS acquisition) and with neither motion correction (the phantom was static) nor data decimation. In Figure 5, the retrospective gate corresponds to 15 % of the data acquired at one extremal position of the phantom, and both the non‐motion‐ corrected image and the corresponding static image are represented for final image quality comparison. For this dynamic phantom experiment, we obtain 𝒰 = (0.26 ± 0.005) and 𝒰 = (1.01 ± 0.005).
Figures 6 and 7 show the gated images obtained from the three volunteers with the standard and AZTEK trajectories, respectively. In Figure 6, these images are shown through a maximum intensity projection over a few slices, whereas single slices are shown in Figure 7. The gates were chosen to keep 50 % of data corresponding to the lung FRC state. For the healthy volunteer experiment, we obtain
Figure 4 Representation of three orthogonal slices of a static water phantom image acquired with the standard trajectory (top), the AZTEK trajectory (middle) and their difference in absolute value (bottom). The orientations of the slices (axial, sagittal and coronal) are given as if a patient was lying supine and head first on the MRI bed. The AZTEK parameters values were AZTEK‐ Twist = 1, AZTEK‐Shuffle = 1 and AZTEK‐Speed = 4.
𝒰 = (0.42 ± 0.002) and 𝒰 = (1.00 ± 0.002). For the two patients experiments, we obtain 𝒰 values of (0.46 ± 0.002) and (0.47 ± 0.002) for the first patient and (0.30 ± 0.001) for the second one, and 𝒰 values of (1.00 ± 0.001) and (0.99 ± 0.002) for the first patient and (1.00 ± 0.001) for the second one. Figure 5 Representation of three orthogonal slices of a moving water phantom image acquired with the standard trajectory without (top) and with (top‐middle) motion correction (retrospective gating with 15 % of the dataset), with the AZTEK trajectory and the same motion correction procedure (middle‐ bottom) and the corresponding fully sampled image of the static phantom for comparison (bottom). The orientation of motion is given by the red arrows. The orientations of the slices (axial, zagittal and coronal) are given as if a patient was lying supine and head first on the MRI bed. The AZTEK parameters values were AZTEK‐Twist = 1, AZTEK‐Shuffle = 1 and AZTEK‐Speed = 4.
DISCUSSION AND CONCLUSIONS
In static phantom experiments, we observed a comparable image quality with the two trajectories and along any spatial orientation. These results confirm that both standard and AZTEK trajectories lead to similar fair outcomes in the static case. No artifacts appeared in the images and no degradation in SNR was observed. In dynamic phantom experiments, severe motion artifacts were observed when motion correction was not performed. After retrospective gating, the motion was efficiently addressed and, at the expense of reduced datasets for each gated image, motion‐related artifacts were removed for both trajectories. However, coherent under‐sampling artifacts still deteriorated the retrospectively gated images inferred from the dataset acquired with the standard trajectory, whereas they were not observed anymore withthe AZTEK trajectory. With the use of AZTEK, under‐sampling artifacts appear as a high spatial frequency non‐coherent background noise instead. This noise is not as troublesome as the coherent artifacts for the quality of the final image as, first, it does not produce any supplementary structures and, second, it does not hinder the spatial resolution of the final images. We observed a clear improvement in retrospectively‐gated image quality with AZTEK with respect to the standard trajectory. Finally, the comparison between 𝒰 and 𝒰 values objectively support these findings as it confirms the expected higher uniformity of the k‐space coverage with AZTEK. Figure 6 Representation of three orthogonal slices of a retrospectively gated image obtained on a healthy human volunteer and acquired with the standard trajectory (top) and the AZTEK trajectory (bottom). The 50 % of data corresponding to the end of expiration were taken for image reconstruction. Details that are more easily visible in the lung with AZTEK are pointed by the green arrows. On the right are represented the positions of the spokes on a unit sphere after the application of the retrospective gate for each trajectory. The AZTEK parameters were AZTEK‐Twist = 1, AZTEK‐Shuffle = 1 and AZTEK‐Speed = 4. In in vivo studies, we observed the advantage of having a uniformly covered k‐space as provided by the implementation of AZTEK after retrospective gating in terms of final image quality and diagnostic value. In particular, in patients, we observed a better tumors delineation and a more uniform signal inside the lesions with AZTEK. Tumors and their surrounding vessels can be more easily differentiated and the size and extent of the tumor can be more accurately evaluated. The clinical value of retrospectively gated ZTE imaging of the lung may therefore be improved with AZTEK. As in the previously described dynamic phantom experiment, the comparison between 𝒰 and 𝒰 values quantitatively corroborates the origin of the improvement upon a far more uniform k‐space coverage with AZTEK. Additionally, with respect to the standard trajectory, AZTEK trajectories ensure consistently uniform, hence repeatable and reproducible, k‐space coverage, which largely improves the consistency between gated images extracted
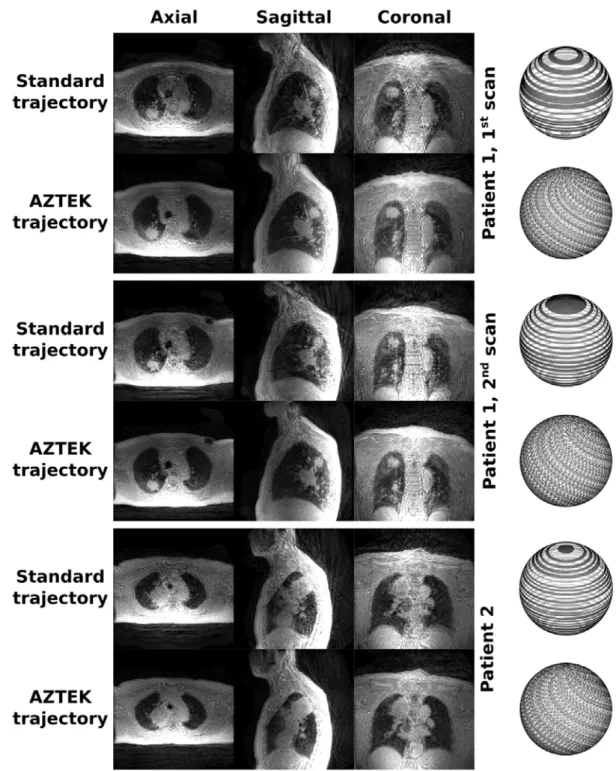
from different acquisitions and enables longitudinal and comparative quantitative studies. It can be appreciated by comparing the two scans for patient 1 in Figure 7.
Figure 7: Representation of ZTE images obtained for two patients with lung cancer, the first one being scanned twice, through three orthogonal slices centered on the lung tumor. For each patient, the images acquired with the standard and the AZTEK trajectories are represented. On the right side, the positions of the spokes are represented on a unit sphere after the application of the retrospective gate for each trajectory. The AZTEK parameters were AZTEK‐Twist = 1, AZTEK‐Shuffle = 1 and
AZTEK‐Speed = 4. Motion correction and image reconstruction were performed with the same method as for the healthy
human volunteer.
The AZTEK technique shows similarities with phyllotaxis trajectories, which can be tuned to naturally optimize the overall uniformity of k‐space coverage while reducing associated eddy currents (10). However, AZTEK offers more flexibility and adaptability on the spoke sequence, while ensuring readout gradient continuity along time and overall uniform angular density in k‐space. Moreover, AZTEK may not remain specific to ZTE, and its advantages could be investigated for other 3D radial pulse sequences, like ultrashort TE, for example. Furthermore, AZTEK might be optimally adapted to any moving organ: an optimal set of AZTEK-Twist, AZTEK-Shuffle and AZTEK-Speed parameters could be found according to the specific motion to ensure a uniform angular coverage of k‐space along any motion gate and for every specific patient. This optimization step could be automated and performed during a short calibration scan before the actual ZTE acquisition with the personalized updated AZTEK trajectory.
ACKNOWLEDGEMENTS
The author sincerely acknowledge Dr. Timo Schirmer from GE Healthcare for promoting the collaboration.
The PET/MR platform involved in this work is affiliated to the national France Life Imaging network (grant ANR‐11‐INBS‐0006).
DATA AVAILABILITY STATEMENT
The code and data that support the findings of this study are openly available at https://github.com/BioMaps-MRI/AZTEK.
ORCID
Brice Fernandez https://orcid.org/0000‐0002‐8693‐2313 Luc Darrasse https://orcid.org/0000‐0002‐9280‐1854 Xavier Maître https://orcid.org/0000‐0003‐2796‐4208REFERENCES
1. Kauczor H‐U, Wielpütz M, eds. MRI of the Lung. 2nd ed. Springer International Publishing, Med Radiol Diagn Imaging. 2017. doi: 10.1007/174_2017_98.
2. Rasche V, Boer RWD, Holz D, Proksa R. Continuous radial data acquisition for dynamic MRI.
Magn Reson Med. 1995;34:754‐761.
3. Spielman DM, Pauly JM, Meyer CH. Magnetic resonance fluoros‐ copy using spirals with variable sampling densities. Magn Reson Med. 1995;34:388‐394.
4. Tsao J, Boesiger P, Pruessmann KP. Lattice permutation for reduc‐ ing motion artifacts in radial and spiral dynamic imaging. Magn Reson Med. 2006;55:116‐125. 5. Winkelmann S, Schaeffter T, Koehler T, Eggers H, Doessel O. An optimal radial profile order based on the golden ratio for time‐ resolved MRI. IEEE Trans Med Imaging. 2007;26:68‐76. 6. Gibiino F, Sacolick L, Menini A, Landini L, Wiesinger F. Free‐ breathing, zero‐TE MR lung imaging. Magn Reson Mater Phy. 2015;28:207‐215. 7. Wiesinger F, Sacolick LI, Menini A, et al. Zero TEMR bone imag‐ ing in the head. Magn Reson Med. 2016;75:107‐114. 8. Chan RW, Ramsay EA, Cunningham CH, Plewes DB. Temporal stability of adaptive 3D radial MRI using multidimensional golden means. Magn Reson Med. 2009;61:354‐363. 9. Park J, Shin T, Yoon SH, Goo JM, Park J‐Y. A radial sampling strategy for uniform k‐space coverage with retrospective respira‐ tory gating in 3D ultrashort‐echo‐time lung imaging. NMR Biomed. 2016;29:576‐ 587. 10. Piccini D, Littmann A, Nielles‐Vallespin S, Zenge MO. Spiral phyllotaxis: The natural way to construct a 3D radial trajectory in MRI. Magn Reson Med. 2011;66:1049‐1056. 11. Delacoste J, Chaptinel J, Beigelman‐Aubry C, Piccini D, Sauty A, Stuber M. A double echo ultra short echo time (UTE) acquisition for respiratory motion‐suppressed high resolution imaging of the lung. Magn Reson Med. 2018;79:2297‐2305. 12. Feng L, Delacoste J, Smith D, et al. Simultaneous evaluation of lung anatomy and ventilation using 4D respiratory‐motion‐resolved ultra‐ short echo time sparse MRI. J Magn Reson Imaging. 2019;49:411‐ 422.
13. Uecker M. mrirecon, bart. version 0.4.03. Göttingen, Germany: Zenodo and the city; 2018. doi:10.5281/zenodo.1215477.
14. Uecker M, Lai P, Murphy MJ, et al. ESPIRiT—An eigenvalue approach to autocalibrating parallel MRI: Where SENSE meets GRAPPA. Magn Reson Med. 2014;71:990‐1001.
15. Luong B. Voronoi Sphere. MATLAB Central File Exchange. 2020.
https://www.mathworks.com/matlabcentral/fileexchange/40989‐voronoi‐sphere. Accessed July 24, 2019.