HAL Id: halshs-00587856
https://halshs.archives-ouvertes.fr/halshs-00587856
Preprint submitted on 21 Apr 2011HAL is a multi-disciplinary open access
archive for the deposit and dissemination of sci-entific research documents, whether they are pub-lished or not. The documents may come from teaching and research institutions in France or abroad, or from public or private research centers.
L’archive ouverte pluridisciplinaire HAL, est destinée au dépôt et à la diffusion de documents scientifiques de niveau recherche, publiés ou non, émanant des établissements d’enseignement et de recherche français ou étrangers, des laboratoires publics ou privés.
Large shareholders and firm value: Are high-tech firms
different?
Irena Grosfeld
To cite this version:
Irena Grosfeld. Large shareholders and firm value: Are high-tech firms different?. 2009. �halshs-00587856�
WORKING PAPER N° 2007 - 26
Large shareholders and firm value:
Are high-tech firms different?
Irena Grosfeld
JEL Codes: D21, G32, O16, P2, P34
Keywords: Ownership structure, corporate governance,
knowledge economy, transition economics
P
ARIS-
JOURDANS
CIENCESE
CONOMIQUESL
ABORATOIRE D’E
CONOMIEA
PPLIQUÉE-
INRA48,BD JOURDAN –E.N.S.–75014PARIS TÉL. :33(0)143136300 – FAX :33(0)143136310
Large shareholders and firm value:
Are high-tech firms different?
1Irena Grosfeld
Paris School of Economics, 48 boulevard Jourdan, 75014 Paris, France Tel: +33143136328; Fax: +33143136310. e-mail: [email protected]
First version: September 2007
This version: January 2009
JEL Codes : D21, G32, O16, P2, P34
Keywords: Ownership structure, corporate governance, knowledge economy, transition economics
1
I am grateful to Malgorzata Kalbarczyk for excellent research assistance and to Thierry Tressel, Philippe Aghion, Georges de Menil, Laszlo Halpern and Jean-François Nivet for comments on earlier versions. This paper has benefited from the comments of two anonymous referees.
Abstract
This paper explores the relationship between ownership structure and firm value in firms listed on the Warsaw Stock Exchange. The results of the estimations, taking into account simultaneity and reverse causality, show that the relationship between ownership concentration and firm value differs across firms belonging to the sector of innovative technologies and more ‘mature’ firms. The results give support to the hypothesis that ‘mature’ firms with higher ownership concentration are likely to perform better than firms with more dispersed ownership. On the other hand, in high-tech companies, with large share of knowledge related activities, higher ownership concentration is associated with lower firm value. This effect is robust to various alternative specifications.
1. Introduction.
Why do certain firms have large block holders and others do not? Does it matter for corporate performance? Since Berle and Means (1932) these questions have been largely explored in corporate finance literature. We understand better now the intricacies of the relationship between ownership structure and firm performance. However, empirical evidence on the impact of shareholders with significant equity holdings on corporate performance remains ambiguous.
The first wave of empirical papers assumed that ownership is exogenous and explored its impact on firm performance (Morck et al., 1988; McConnell and Servaes, 1990; Hermalin and Weisbach, 1991; Holderness et al., 1999). On the other hand, since the initial argument about the endogeneity of ownership structure was formulated by Demsetz (1983), an important strand of the literature focused on the endogeneity of ownership structure in its relationship with firm performance. Demsetz argued that the trading of shares may reflect the desire of existing or potential owners to change their stakes and ownership structure is an outcome of shareholders’ decisions. Whether they are willing to hold large or small portions of firm equity may depend on specific firm’s characteristics. If firms adapt indeed their ownership structure to their environments and specific needs, in equilibrium we should not expect finding any significant relationship between ownership and performance. Following this important contribution, several papers explored empirically the impact of ownership structure on firm performance taking into account endogeneity of ownership. Demsetz and Lehn (1985), Hermalin and Weisbach (1991), Loderer and Martin (1997), Cho (1998), Demsetz and Villalonga (2001) and Cowles et al. (2007) use a system of simultaneous equations. Another empirical strategy was used by Himmelberg et al. (1999): they argue that endogeneity of ownership may be due to individual firm heterogeneity and in order to control for it they use firm fixed effects. They find no significant relationship between ownership and performance and conclude that shareholders choose ownership structure optimally. Thomsen et al. (2006) use Granger test and find that in Continental Europe blockholders’ impact on firm value is negative. Some contrasting evidence on the impact of large equity holders on firm performance was found by Lehmann and Weigand (2000) and Gugler and Weigand (2003). In the first paper, focusing on German corporations, ownership concentration negatively affects firm performance. In the second paper, looking at US and Germany, the presence of a large shareholder remains positive and significant for firm performance even after controlling for simultaneity.
The paper makes two contributions to the literature. First, it looks at ownership concentration and firm performance in a transition economy. Exploring this issue, which has been largely studied in developed market economies, may be interesting in such an economy because of specific environment in which firms operate: in economies, which have recently implemented large scale privatization programs, the relative weakness of external mechanisms of control, such as takeovers, labor market, and the legal system, the importance of internal mechanisms, and notably ownership concentration, is likely to be stronger (La Porta et al., 1999; Johnson et al., 2000; Faccio and Lang, 2002; Denis and McConnell, 2003). The question whether concentrated ownership patterns should be imposed in the aftermath of large scale privatization programs was often discussed during the working out of privatization strategies in Central and Eastern Europe in the 90s. In Poland, which is the focus of this paper, privatization strategy implemented by successive governments since 1989 was, implicitly, referring to the agency-cost theory: ownership concentration seemed necessary as a monitoring device ensuring the owner full control of managers. In more explicit terms, the main concern in choosing specific privatization methods was to create ‘appropriate’ ownership structure in privatized firms, i.e. to make sure that there are ‘real owners’ holding large equity stakes. In the aftermath of privatization, firms could change their ownership structure and the existing evidence confirms that the initial, post-privatisation ownership structure was transitory and rapidly gave way to new configurations (Grosfeld and Hashi, 2007; Stulz, 2006). Such rapid changes in ownership structure, rather unusual for a stable market economy, offer a particularly suitable framework for exploring the determinants of ownership concentration and its impact on firm performance. This study considers publicly traded firms because of the high quality of available information: reporting and transparency requirement on the Warsaw Stock Exchange (WSE) are quite strict and comparable to those of Western European stock exchanges. 2 Once firms went public it became possible to track these changes and, using the information provided by the continuous bidding for firm shares, assess how ownership affects firm value.
The second contribution of this study consists in relating the recent perspective on the theory of the firm (Holmström and Roberts, 1998; Rajan and Zingales, 2000; Zingales, 2002) to the debate about ownership concentration and corporate value. Previously, tangible assets were considered as critical resources of the firm and legal claims over assets were the most important source of power. Given that in the sector of ‘new economy’, the role of human capital relative to tangible assets has significantly increased, Rajan and Zingales (2000) argue that corporate governance should study mechanisms providing incentives to human capital. More specifically, Audretsch and Lehmann (2002) consider that analyzing the relationship
2
The WSE was set up in 1991 with the help of French experts. For the high quality of stock exchange regulations in Poland see Glaeser, et al. (2001). In La Porta, et al. (1998), the ranking given to Poland for the protection of investors equals the average for 49 countries in the sample.
between managers and shareholders requires different perspectives in firms belonging to the sector of “new economy” and in firms belonging to more traditional industries. For Carlin and Mayer (2003) different ownership structures may be appropriate for different types of activities. They suggest that firms in high technology industries may require more dispersed ownership structure while concentrated ownership ensuring commitment and long-term investment may be suited to more ‘mature’ industries.
The common idea behind these arguments is that in traditional industries, it is clear what the managers need to do and it is therefore important to make sure that they efficiently implement the objectives agreed on. In such conditions, the value of monitoring is likely to be high. On the other hand, in firms with strong human capital component it is less clear what is the right strategy or the right project. In such highly uncertain environment the value of monitoring may be lower: the crucial issue is less to make sure that the agent-manager realizes a given objective with a maximum effort than to incite the manager to search for the best project. 3 In Aghion and Tirole (1997) concentrated ownership provides incentives to monitor, but it also reduces the manager’s initiative or incentive to acquire information. Recognizing the importance of managerial initiative is at the heart of the theory of Burkart et al. (1997). They argue that increased monitoring by shareholders may be costly if it depresses initiative displayed by managers: managers are less likely to be active if they know that shareholders will interfere. So, too much monitoring may hinder managerial initiative and profitable investment opportunities would be lost. Burkart et al. (1997) view firm ownership structure as an instrument to solve the trade-off between control and initiative. Through more dispersed ownership structure shareholders commit themselves to weaker intervention which makes managers confident enough that they will not be dispossessed of the benefits of their initiative.
The trade off between initiative and control is likely to be particularly strong in firms belonging to highly technological sectors. There are two possible empirical implications of this analysis, depending on whether ownership concentration is chosen optimally. 4 If we consider that ownership patterns are responsive to the value of monitoring (Holmström and Roberts, 1998; Bolton and von Tadden, 1998) and have adjusted to firm specific requirements, ownership concentration should be lower in high-tech firms than in more traditional industries and ownership concentration should not be related in a significant way to the value of the firm. However, if ownership structure is not in equilibrium and shareholders have not
3
The disincentive effect of monitoring was considered by Demsetz (1983). In Prendergast (2002) monitoring activities are more effective in an environment with low risk. He argues that contrary to the standard prediction of agency theory, firms delegate decision-making power more in uncertain environments. It happens because a principal may have little idea what the right kinds of effort in such cases are and the marginal returns to delegation are likely to be higher in more uncertain environments.
4
Cf. Hermalin and Weisbach (2003) for the distinction between equilibrium and out-of-equilibrium analysis of the relationship between ownership and performance.
optimized their ownership structure, the second implication of this theory would be differential impact of concentrated ownership on firm value in the two types of firms. We can expect indeed that increasing their equity holdings in ‘old’ industries shareholders contribute to increasing firm value while in high-tech firms higher ownership concentration may not improve firm performance.
In order to investigate these issues I use a sample of all non-financial firms listed on the Warsaw Stock Exchange (WSE) since its creation in 1991 up to 2003. ‘New’ and ‘old’ industries are defined relying on the Warsaw Stock Exchange classification of listed equities, which explicitly separates the segment of innovative technologies. In the context of a transition economy, undergoing profound ownership, institutional and legal transformations, out-of-equilibrium approach appears to be the relevant one.
The results of the estimations of simultaneous equations system show that the ownership – performance relation is different in high-tech and ‘mature’ firms. Ownership concentration is positively correlated with performance in firms belonging to traditional industries. In high-tech firms the presence of large blockholders hurts firm value. Concerning the reverse causality, i.e. the impact of firm value on ownership concentration, the results show that in “traditional” industries, shareholders increase their holdings in firms with higher Tobin’s Q whereas in high-tech firms this relationship is insignificant. Various robustness tests confirm the validity of these findings.
The rest of the paper is organized as follows: The data are presented in section 2. Section 3 discusses the empirical strategy used in this paper in order to identify the impact of ownership concentration on firm performance. Results are presented in section 4. Section 5 concludes.
2. Data
The sample includes all non-financial companies traded on the Warsaw Stock Exchange (WSE) between 1991 and 2003. Banks and other financial companies are not included because they have specific problems of valuation and regulation, which would make the comparison difficult. The data was compiled from information provided by Notoria, the Polish Security and Exchange Commission and the Business Register. The WSE was established in 1991 and for the last fifteen years has been developing rapidly. There were 8 listed firms in 1991 and 214 in 2003. Market capitalisation of the WSE grew steadily through the period reaching 21 percent of GDP in 2003. The initial data base was created relying on published, audited accounts of balance sheets and income statements. It has been extended manually by
including detailed information on ownership structure, firms’ origin, firms’ age, and privatization methods.
Two dimensions of ownership structure are taken into account: ownership concentration and type of the largest shareholder. The information on ownership structure includes the percentage of cash flow rights and voting rights of all shareholders holding more than the mandatory disclosure threshold of 5 percent of the shares. This ownership information was collected for all years between 1991 and 2003, with the exception of 13 firms which were introduced to the WSE in 1991 and 1992: for these firms the Security and Exchange Commission (Komisja Papierow Wartosciowych) did not collect the ownership data in 1992 and 1993. In some cases smaller shareholdings were also available. Owners are classified by four types: family, industrial company, financial institution, and the state. A firm is classified as being controlled by a family when there is an individual or a group of individuals (identified by family surname) belonging to the same family who control the largest voting block of shares.
The number of firms entering the stock exchange reflected the privatization process and the development of the WSE. This sample of listed firms includes firms that were previously state-owned and firms, which can be considered as ‘newly created’ in the sense that they never belonged to the state. In 2003 there were 90 newly created firms and 124 privatized firms. Different privatization methods were used in the case of previously state-owned enterprises: 30 firms were privatized through initial public offerings (IPO), 55 through direct sale, 13 through leveraged employee and managerial buyout, and finally 26 listed companies were privatized in the framework of the National Investment Funds programme (a version of mass privatization scheme).5
Table 1 presents summary statistics for all firms presented in the sample in 2003 and separately for high-tech firms, i.e. those belonging to the sector of innovative high-technologies (according to the classification used by the WSE) and other firms denoted as ‘mature’. Clearly, the number of high-tech firms is much lower than the number of ‘mature’ firms and this limitation should not be forgotten in interpreting the results of this paper. Average Tobin’s Q is calculated as the ratio of market value of equity plus book value of total debt to book value of total assets. Ownership concentration is measured here (as is common in the literature) as the fraction of voting rights of the largest shareholder. Initial profitability is calculated as net profit on assets during three years preceding the publication of the prospectus; firms’ size is
5
measured as the natural logarithm of the firm’s sales 6; the number of years of listing represents the time since the introduction to the stock exchange; intangibles, including R&D expenditures, patents, brands, goodwill and any other nonmonetary assets without physical substance, are defined as the share of intangible assets in fixed assets; profitability is defined as the ratio of net profit to sales; firm idiosyncratic risk (or firm volatility) is the standard error of the residual of CAPM equation7; and finally, vote/share is a proxy for the separation of ownership and control and is defined as the ratio of voting rights to cash flow rights of the largest shareholder.
Overall, Table 1 shows that on average high-tech firms are smaller, have larger share of intangible assets in fixed assets and have been listed for fewer years than other firms. Table 1 also reveals that firms in the sample do not systematically differ in terms of initial or current profitability. The difference in Tobin’s Q is significant at five-percent level (it is 1.72 for high-tech firms and 1.24 for ‘mature’ firms). The single largest owner controls on average 43 percent of voting shares (median 40 percent). 8 84 percent of the companies quoted in 2003 have a single owner holding at least 20 percent of voting shares. 9 Ownership concentration is slightly lower in high-tech firms but the difference is insignificant in 2003.
However, considering a specific year, we do not take into account the possibility that firms need time to adjust their ownership structure. Table 2 describes how the ownership concentration changes after six years of listing. Comparing columns 1 and 2 we see that the fraction of voting rights of the largest shareholder in high-tech firms rapidly decreases and reaches 28 percent; in the firms from ‘mature’ industries, it remains at 40 percent level. In columns 3 to 6 changes in two other measures of ownership concentration are considered: Shapley value of the largest shareholder and Herfindahl index of the voting rights. Shapley value is the probability that the largest shareholder is pivotal in forming a majority coalition (>50%).10 Herfindahl index is calculated under the assumption that unknown shareholders hold each 4 percent of voting rights: this may underestimate the actual power of the main shareholder. Both
6
As size will be included in the regression for Tobin’s Q, following Loderer and Martin (1997), I use sales rather than assets to avoid a spurious correlation with the denominator of Tobin’s Q.
7
Firm idiosyncratic risk was calculated using data on individual firm daily stock prices. The information was collected from the data base provided by the Warsaw Stock Exchange. For each firm and for each year, I ran a regression of firm’s daily return on the market return and used the residual standard deviation (and variance) in the firm’s return after the effect of its co variation with the market was taken out. Alternatively, the firm’s risk will be measured by standard deviation (variance) of returns.
8
Let us note that median size of largest voting blocks in listed firms in Austria, Belgium, Germany, Italy and Netherlands is about 43 %. See Becht and Röell (1999). For the discussion of ownership structure in the transition economies see Berglöf and Pajuste (2003), Klapper et al. (2005), Stulz (2006), Igor Filatotchev et al. (2007) and Hanousek et al. (2007).
9
See, among others, for the use of this threshold La Porta et al. (1999), Claessens et al. (2002), and Faccio et al. (2002).
10
confirms significant decrease of ownership concentration in high-tech firms and almost stable level of ownership measure in ‘mature’ firms.
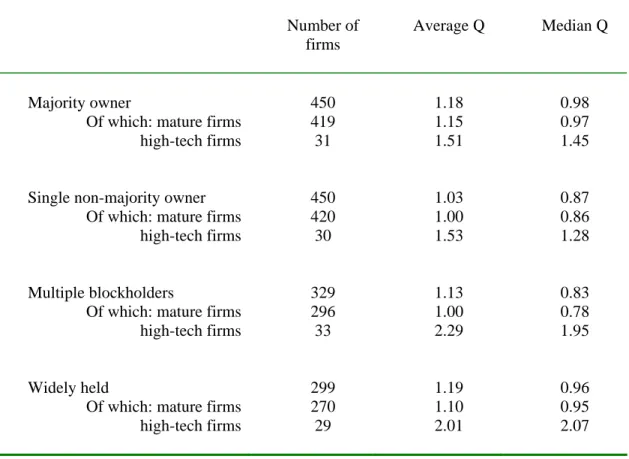
More detailed ownership structure, taking into account the existence of multiple large owners, is presented in Table 3. We distinguish four ownership categories (see, for instance, Laeven and Levine, 2007): firms with majority ownership if the largest owner holds at least 50 percent of voting rights; firms with single non-majority blockholder if the largest shareholder holds between 20 percent and 50 percent of voting rights and no other owner controls more than 20 percent of voting rights; firms with multiple blockholders if there is at least a second shareholder with at least 20 percent of voting rights; finally, firms are considered as widely held if no shareholder owns more than 20 percent of voting rights. The table shows that high-tech firms with multiple blockholders or widely-held have higher value of Tobin’s Q than when they are controlled by a majority owner or a single non-majority owner. In the case of mature firms, the highest valuation is obtained for majority controlled firms. The results are similar when medians are considered instead of averages.
Detailed information on the evolution of ownership concentration by the type of largest owner during the first six years of listing is presented in Table 4. We can see that the most important changes took place in firms in which the state was the largest shareholder: state’s voting rights declined on average from 84% to 34% (the decrease of median values is even stronger). In firms in which the largest shareholders were families, firms or institutional investors changes in ownership concentration were less spectacular. 11
3. Empirical strategy
Exploring the links between ownership structure and firm performance, two issues should be taken into account: the question of endogeneity of ownership and the question of reverse causality. The problem of endogeneity emerges because ownership concentration as an explanatory variable in the equation for firm performance is likely to be correlated with the disturbances. Reverse causality means that not only the ownership concentration may affect firm performance but also that ownership structure may depend on the value of the firm. 12 The impact of performance on owners’ decision to concentrate their holdings is a priori ambiguous. If shareholders believe they are able to create value and obtain benefits of control
11
The information provided in table 4 should be taken with caution as the sample changes across years. We do not know to what extent changes in ownership concentration are driven by changes in the sample or by changes within firms.
12
sufficiently large to override the cost of the effort and to compensate for the loss of benefits of diversification, they may be willing to increase their holdings in firms which have not yet capitalized their growth opportunities in the stock price. Such negative relationship was predicted by Kahn and Winton (2002). However, especially in the context of an emerging market and weak regulatory environment, investors may be reluctant to engage in intensive monitoring and rather reduce their stakes in poorly performing companies. In the latter case, we will observe a positive relationship between ownership and performance. 13
In order to address both problems of endogeneity and reverse causality, I use a simultaneous equations framework. In the first equation, the dependent variable is ownership concentration measured as the share of the voting rights of the largest shareholder (I also use below another measure of ownership concentration, which is defined as the Shapley value of the largest owner); in the second equation the dependent variable is firm performance proxied by Tobin’s Q. The obvious difficulty in estimating such system of equations is finding appropriate ”order conditions” for identification: each equation must exclude at least one exogenous variable which provides a source of variation in the other endogenous variable but does not shift the value of the given endogenous variable. It is notoriously difficult to find valid instruments for ownership concentration as most of available variables are likely to affect Tobin’s Q. The advantage of the present sample is that the firms in the sample have been introduced to the stock exchange relatively recently and we can observe that their ownership concentration is strongly negatively influenced by the time that has elapsed since the first quotation. This variable is reasonably exogenous: it is unlikely that years of listing affect firm value otherwise than through ownership concentration, especially if in the equation for Tobin’s Q I control for the age of the firm.14 Therefore, I use the number of years a firm has been listed on the stock exchange as the first instrument for ownership concentration. Following Hermalin and Weisbach (1991), Loderer and Martin (1997), and Brick et al. (2006) who instrument ownership concentration by its lagged value, I also use as an additional instrument for ownership concentration the share of the voting rights of the largest equity holder before the introduction of the firm to the stock exchange.
In order to identify the second equation, for corporate value, I use initial profitability calculated as a ratio of net profit to total assets averaged over the three years preceding the publication of the prospectus as
13
Demsetz and Villalonga (2001) find that performance has a significant and negative effect on ownership concentration while Jones, et al. (2003) show that lagged profitability does not affect ownership structure in a significant way. For some evidence on the relation between ownership concentration and firm performance in Polish and Czech mass privatized firms see Grosfeld and Hashi (2007).
14
instrument for Tobin’s Q. Such proxy for performance in the years preceding the listing on the stock exchange is likely to be correlated with firm value; however, there is little chance that it affects ownership concentration once the firm has been listed on the stock exchange.
So, the identification strategy used in this paper relies upon the hypotheses that Tobin’s Q is not directly affected by the number of years of listing (controlling for firms’ age) or by the firm ownership structure before its introduction to the stock exchange; and that current ownership concentration is not directly affected by firm profitability before the first quotation.
Although the data used in this study has time dimension, I do not use a model with firm level fixed effects. Zhou (2001) argued that including fixed effects to investigate the relationship between ownership and performance may be misleading because it may fail detecting the effect of ownership on performance even if it existed. Using fixed effects, the focus is indeed on within rather than cross-firms variations, which appear crucial in investigating whether in some firms higher ownership concentration is more beneficial than in others.
The specificity of the sample considered in this study provides an additional argument against using fixed effects. In a transition economy like the Polish one in the period under examination, firms are exposed to profound industrial, managerial and financial restructurings. This makes questionable the assumption that firm specific characteristics do not change over time. In such environment, endogeneity is likely to be strongly associated with time-varying characteristics and relying on firm fixed effects, we may fail to address this problem effectively. Taking these arguments into account 15 I focus on the endogeneity due to the correlation between ownership and idiosyncratic errors in firm value equation. Consequently, the following simultaneous equations system is estimated:
(1)
Ownership concentration = f (corporate value (t-1), control variables, year fixed effects, Zownconc, e1)
(2) Corporate value = g (ownership concentration, control variables, year fixed effects, Zcorpvalue, e2)
15
An additional argument comes from Pindado and de la Torre (2004) who tried to identify the main source of endogeneity of ownership and found that that, in their sample of Spanish firms, it is rather due to the simultaneity between ownership and firm value than to unobservable heterogeneity.
Ownership concentration is first measured as the logistic transformation of the percentage voting rights held by the largest shareholder. Such logistic measure is currently used in the literature (see for instance Demsetz and Lehn, 1985, and Himmelberg et al., 1999) in order to make the simple percentage measure fit a normal distribution. If the voting rights of the largest shareholder are denoted vote1, logistic measure of voting rights is: ln [vote1/(100-vote1)]. Corporate value is defined as the ratio of market value of equity plus book value of total debt to book value of total assets (a proxy for Tobin’s Q). As corporate value is calculated at the end of the year and ownership data is usually given for the middle of the year, I use lagged corporate value in the equation for ownership concentration. The instrument for ownership concentration (Zownconc) is 1/ the number of years during which a firm has been listed on the stock exchange and 2/ the share of the voting rights of the largest equity holder before the introduction of the firm to the stock exchange. Zcorpvalue, the instrument for corporate value, is the initial profitability which is calculated as the ratio of net profit to total assets averaged over the three years preceding the publication of the prospectus. Year dummies are included to control for common macroeconomic and institutional shocks. e1 and e2 are white noise errors.
Control variables in both equations include: size, profitability, three dummy variables equal to one if, respectively, the largest share of voting rights is held by a member of a family, an institutional investor or the state (industrial company is the reference category); foreign20 is dummy variable equal to one if a foreigner holds at least 20 percent of firm voting rights, and zero otherwise16. In the equation for corporate value control variables also include the age of the firm.
Intangibles also appear as a control variable in both equations. It is defined as the share of intangible assets in fixed assets. Intangible assets are often included in the equation for Tobin’s Q on the ground that firms with more intangible assets are supposed to have higher corporate value. From the viewpoint of this paper, it is important to consider intangibles as explanatory variable also in the ownership concentration equation. Following Zeckhauser and Pound (1990), we expect that the higher the firm R&D expenditures, which are important component of intangibles, the more diffuse is the informational structure and the more difficult outside monitoring. Large shareholders are supposed to recognize the problem and, therefore ownership concentration is likely to be negatively related to soft capital intensity. 17
16
It is often argued that foreign investors with their competence and the knowledge of market economy may have, in the case of transition economies, positive effect on firm performance.
17
In this respect this paper departs from Himmelberg et al. (1999) and Helwege et al. (2007). The authors of these papers consider that high R&D expenditures create more managerial discretion and information asymmetries and, consequently, will be associated with higher ownership concentration.
The wedge between the voting rights and the cash flow rights of the largest shareholder (vote/share) is another explanatory variable used in both equations. Firms with such explicit separation of ownership and control may have important agency problems and may be less valuable than firms in which voting rights equal cash flow rights (Shleifer and Vishny, 1997). Claessens et al. (2002) found in their study of Asian firms that although cash flow rights held by the largest shareholder are positively related to firm value, the latter decreases when control rights of the largest shareholder exceed its cash flow rights. Lins (2002) found that this effect is significant in countries with low shareholder protection.
The last important control variable included in both equations is firm specific risk (or firm’s volatility), as defined in section 2. Demsetz and Lehn (1985), Himmelberg et al. (1999) and Demsetz and Villalonga (2001) motivate including risk as a determinant of ownership concentration by the principal agent theory (Jensen and Meckling, 1976): when the environment is more volatile, it is more difficult for shareholders to monitor managers but there are also more potential benefits from such monitoring. When firm environment is relatively stable, the argument goes, shareholders have less difficulty monitoring managers. Consequently, it is expected that highly risky firms will have higher ownership concentration. To take into account the possibility that the relation between risk and ownership concentration could be concave (Demsetz and Lehn, 1985; Aggarwal and Samwick, 2003), we also include a quadratic term (variance) of risk. Both proxies for risk are also included in the equation for corporate value. Stock price volatility can be viewed indeed as a measure of uncertainty about future growth prospect of the firm and as such it may affect Tobin’s Q.
Before estimating the system of simultaneous equations, I first check the endogeneity of ownership concentration and the significance and the validity of instruments for ownership concentration. Then, the model of simultaneous equations is estimated using two-stage least squares method (2SLS). I also use three-stage least squares methods (3SLS) which might give different results if error terms of individual equations in the systems were contemporaneously correlated. But the results turn out to be qualitatively similar, which suggests that disturbances are uncorrelated. Consequently, only results from 2SLS model are reported. Finally, I also run a series of robustness checks in order to exclude alternative explanations of the difference in the relationship between ownership concentration and firm value in high-tech and more mature firms.
4. Results
The test of endogeneity of ownership concentration does not allow accepting the null hypothesis of no correlation between ownership concentration and the error term. Table 5, presents the results of the second stage regression of corporate value using ordinary least squares with instrumented ownership
concentration. In columns 1 and 2 ownership concentration is instrumented by the number of years a firm has been listed on the stock exchange. In columns 3 and 4 I use as an additional instrument the
predetermined ownership structure which is the share of the voting rights of the largest shareholder before the introduction of the firm to the stock exchange. In the bottom of Table 5 the results of several tests are presented: Durbin-Wu-Hausman test for the endogeneity of ownership concentration, F-test of the joint significance of the instruments (F-stat) and Hansen-Sargan test of the validity of the instruments.
The results of Durbin-Wu-Hausman test suggest that ownership structure is endogenous in the sample of Polish listed firms and that using simple OLS will produce biased results. F-test for the joint significance of the instruments (Stock and Yogo, 2005) does not allow rejecting the hypothesis that the instruments are relevant and significant. Finally, when there are more instruments that required for exact identification, the over-identifying exclusion restrictions are tested using Hansen-Sargan test (columns 3 and 4 of Table 5. The test does not reject the null hypothesis that the instruments are valid (and uncorrelated with the regression error term), which gives confidence in the validity of the instruments.
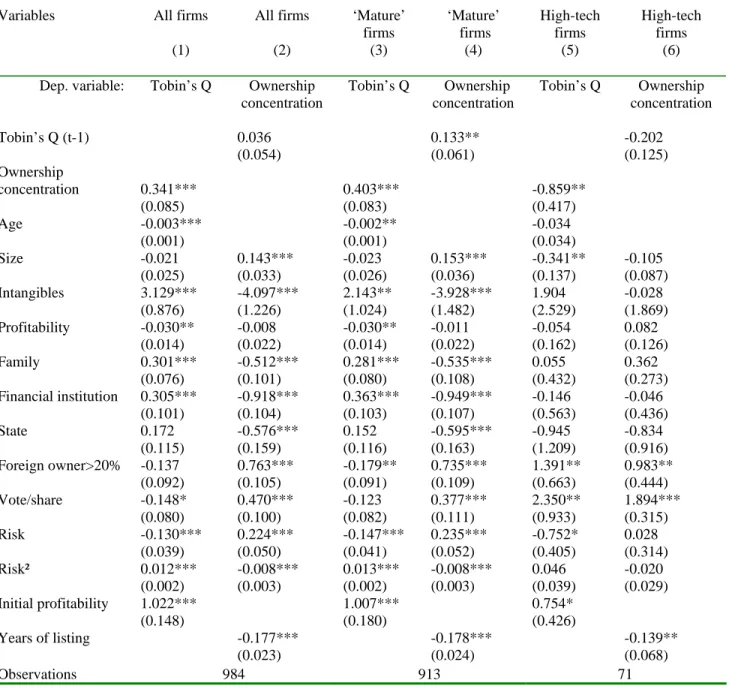
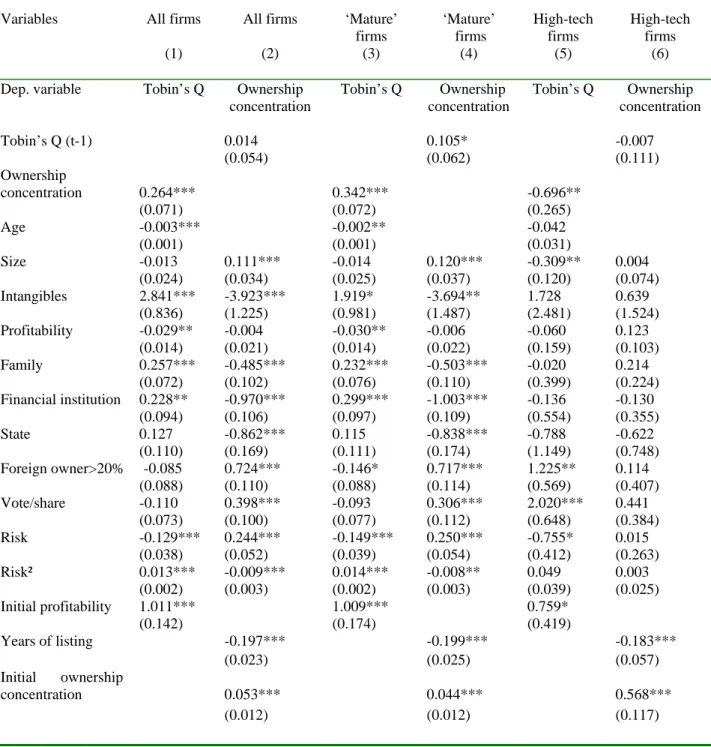
Consequently, the system of simultaneous equations (1) and (2) is estimated using two instruments for ownership concentration. Table 6 presents the results of regressions with ownership concentration instrumented by the number of years of listing. In Table 7 two instruments are used: the number of years of listing and the initial ownership concentration (before listing). Both Tables present results for all firms in the sample and separately for high-tech firms and firms belonging to more ‘mature’ sectors.
The results show that firm value is positively related to ownership concentration. However, this effect is driven by the sub-sample of ‘mature’ firms. In the sub-sample of high-tech firms the coefficient of ownership concentration is negative. Table 6 also reveals that if all firms are included in the regression, past firm value does not affect ownership concentration. However, if high-tech firms and ‘mature’ firms are considered separately, the coefficients of lagged Tobin’s Q take opposite signs. In ‘mature’ firms, the coefficient is positive and significant which suggests that shareholders increase their equity stakes in highly valued firms. On the other hand, in firms belonging to the sector of innovative technologies we
observe negative, albeit statistically insignificant correlation between ownership concentration and firm value, predicted by Kahn and Winton (2002).
In both specifications, presented in Tables 6 and 7, the instruments for ownership concentration are highly significant: the longer a firm is listed on the stock exchange the lower is the share of the voting rights held by the largest shareholder. Helwege et al. (2007) also find that in IPO firms in the US ownership concentration is negatively related to years since listing. When ownership concentration is additionally instrumented by initial ownership concentration, the coefficients of both instrumental variables appear highly significant.
The results give support to the idea that ownership concentration varies inversely with intangibles. The strongly significant coefficient in ‘mature’ firms becomes, however, insignificant in the sample of high-tech firms. The reason for it may be that separating high-high-tech firms captures much of the variation in ‘soft capital’: we can see from Table 1 that the share of intangibles in high-tech firms is on average five times bigger than in more ‘mature’ firms.
The presence of large foreign owners, holding at least 20 percent of voting rights improves firm performance only in the sample of high-tech firms. This result may surprise as it is usually expected that the presence of foreign owners should be beneficial for firm performance, especially in the context of a transition economy. Hanousek et al. (2007) find indeed that in some cases foreign dominant owners positively affect firm performance. However, the results of other empirical works trying to identify such effect remain ambiguous. Bae et al. (2005) argue that in more opaque economies local rather than foreign investors have bigger information advantage. Klapper et al. (2005), looking for the impact of foreign owners on the improvement of corporate governance standards, find that foreign investors do not significantly differ from domestic owners.
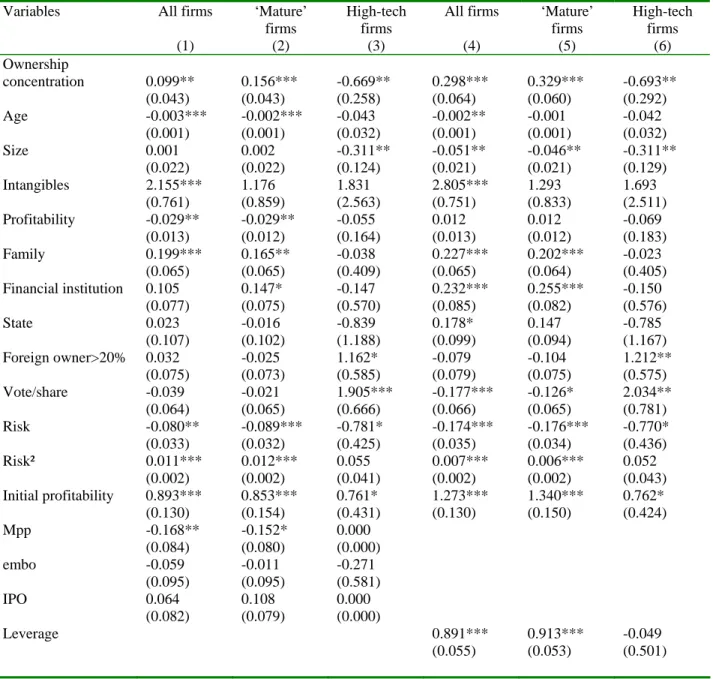
In order to make sure that the result of the differential relationship between ownership concentration and firm value in high-tech and other firms is robust to alternative specifications, I perform the following robustness tests.
First, I include privatization methods and firm leverage as additional explanatory variables (Table 8). Several authors looking at the determinants of post privatization ownership and performance considered the potential impact of privatization process itself (see Boubakri et al., 2005; Bortolotti et al., 2003; Hanousek et al., 2007). It is possible that in the sample of Polish listed firms particular privatization
method could significantly affect ownership structure of privatized firms, especially during the initial years of listing.For instance, firms privatized in the framework of mass privatization scheme had initially uniform ownership structure (the largest owner holding 33 percent of shares). In firms privatized through IPO the state has initially an important stake. We distinguish four privatization methods: IPO, private sale, employee-managerial buy out, and mass privatization scheme and in both equations (1) and (2) we include three dummy variables equal to one if, respectively, a firm was privatized by IPO, employee-managerial buy-out and mass privatization (private sale is the reference category). The results in columns 1-3 of Table 8 confirm that when we control for privatization methods the results remain basically unaffected.
Capital structure does not appear in the model considered in this paper. This follows Loderer and Martin (1997), who argued that although the role of debt could be non negligible, including it would require estimating a much bigger system of equations taking into account a two-way relationship of debt and performance, and debt and ownership structure. Such simultaneous estimation of the three endogenous variables: ownership concentration, debt and firm value may be considered as a potential extension of this paper. At that stage, we simply perform another robustness test and include leverage as explanatory variable in both ownership and corporate value equations (columns 4-6 of Table 8). It turns out that the impact of debt on Tobin’s Q is significantly greater than zero in ‘mature’ firms (insignificant in high-tech firms). The coefficients of ownership concentration are not significantly changed by the inclusion of leverage.
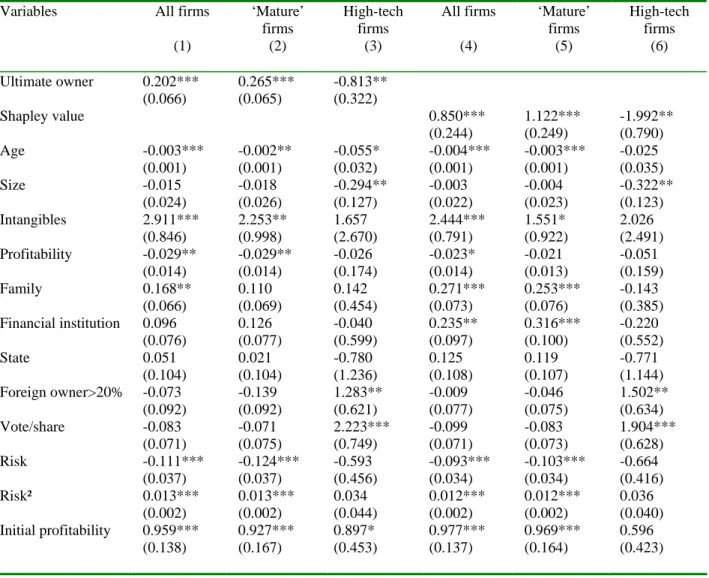
The second set of robustness tests uses two different measures of ownership concentration (Table 9). First, instead of considering the voting rights of the largest direct shareholder I use the notion of ‘ultimate’ owners, introduced by La Porta et al. (1999). If a corporation or financial institution owns a company I track its blockholder through the ownership chain and report its voting rights. If the ultimate owner is an unlisted firm, I try to identify its owners but it is rarely possible. In such case I follow the convention adopted by Faccio and Lang (2002) and classify the unlisted firm as being controlled by a family. The results are presented in columns 1-3. In the next three columns of Table 9 ownership concentration is measured as the Shapley value of the largest shareholder, i.e. the probability that he is pivotal in forming a majority coalition (>50%). In both cases, the results clearly confirm the previously obtained difference in the coefficients of ownership concentration in high-tech and ‘mature’ firms.
Finally, I also estimate the simultaneous equations system with an alternative measure of firm risk: instead of defining risk as standard error (variance) of the residual of CAPM equation, I take the standard deviation (variance) of returns. I run the regressions using two proxies for ownership concentration: the
logistic transformation of the percentage voting rights of the largest shareholder and the Shapley value of the largest owner. The two versions of regressions generate consisting results: the coefficient of ownership concentration is greater than zero in ‘mature’ firms and negative in high-tech firms.
The question arises how can be interpreted this differential impact of concentrated ownership on high-tech firms and more ‘mature’ firms. Can it be attributed to the trade-off between initiative and control? What are possible alternative interpretations? The literature has identified two other costs of concentrated ownership: higher potential for expropriation of minority investors (La Porta et al., 1998; Johnson et al., 2000) and lower stocks’ liquidity, which weakens the informational role of the stock market (Holmström and Tirole, 1993; Gaspar and Massa, 2007) and decreases firm value. If expropriation of minority investors by controlling shareholders were to be made responsible for our results, it would be difficult to explain why this effect is observed only in the sub sample of high-tech firms. But the second possibility could be an interesting alternative explanation of the results obtained in this paper. We cannot be sure indeed that the negative impact of concentrated ownership on the value of high-tech firms is due to the trade-off between initiative and control rather than to the trade-off between liquidity and control. It is possible that high uncertainty characterising high-tech firms makes information more valuable and if shares are closely held this information is less easily available. Whatever the true channel through which corporate ownership affects firm value in ‘new’ and ‘old’ economy, the common denominator of these two explanations is high degree of uncertainty: in one case it makes monitoring less valuable, in the other it increases the need for information provided by the trading of shares.
5. Conclusions
This paper explores the relationship between ownership structure and firm value in a transition economy in order to shed light on the controversial question of the potential advantages of concentrated ownership.
The results of the estimations taking into account simultaneity and reverse causality reveal that the relationship between ownership concentration and firm value is different in firms belonging to the sector of innovative technologies and in more ‘mature’ firms. For the latter, the results give support to the hypothesis that firms with higher ownership concentration is associated with higher firm performance. On the other hand, in high-tech companies, with large share of knowledge related activities, higher ownership concentration is associated with lower firm value. This effect is robust to various alternative specifications.
The findings reported here suggest that in order to better understand the relationship between ownership and performance we have to take into account important heterogeneity across firms. Answering questions such as: “what the characteristics of ‘good’ ownership structure are” or “should the power of large shareholders be limited to avoid expropriation or encouraged to curb managerial discretion”, may turn out to be more complicated than expected.
References
Aggarwal, Rajesh K., Samwick, Andrewa A. 2003. Why do managers diversify their firms? Agency reconsiderations. Journal of Finance 58, 71-118.
Aghion, Philippe, Tirole, Jean, 1997. Formal and real authority in organizations. Journal of Political Economy 55, 1-27.
Alti, Aydogan, 2003. How sensitive is investment to cash flow when financing is frictionless? Journal of Finance 58, 707-722.
Audretsch, David B., Lehmann, Erik, 2002. Does the new economy need new governance? Ownership, knowledge and performance. Discussion Paper No 3626. CEPR.
Bae, Kee-Hong, Stulz, Rene M., Tan, Hongping, 2007. Do local analysts know more? A cross-country study of the performance of local analysts and foreign analysts. Journal of Financial Economics forthcoming. Becht, Marco, Röell, Ailsa, 1999. Blockholdings in Europe: An International comparison. European Economic
Review 43, 1049-1056.
Berglof, Erik, Pajuste, Anette, 2003. Emerging Owners, Eclipsing Markets? Corporate Governance in Central and Eastern Europe. In: Cornelius Peter K. and Kogut B. (Eds.), Corporate Governance and Capital Flows in a Global Economy. Oxford University Press.
Berle, Adolph, Means, Gardimer, 1932. The Modern Corporation and Private Property. New York, Commerce Clearing House.
Bolton, Patrick, Von Tadden, Ernst-Ludwig, 1998. Blocks, liquidity and corporate control. Journal of Finance 53, 1-25.
Bortolotti Bernardo, Fantini, Marcella, Siniscalco, Domenico, 2003. Privatisation around the world: evidence from panel data. Journal of Public Economics 88: 305-332.
Boubakri, Narjess, Cosset, Jean-Claude, Guedhami, Omrane, 2005. Postprivatization corporate governance: The role of ownership structure and investor protection. Journal of Financial Economics 76, 369-399.
Brick, Ivan. E., Palia, Darius, Wang Chia-Jane, 2006. The Joint impact of corporate governance
mechanisms on firm performance and each other. mimeo.
Burkart, Mike, Gromb, Denis, Panunzi, Fausto, 1997. Large shareholders, monitoring and the value of the firm. Quarterly Journal of Economics 112, 693-728.
Carlin, Wendy, Mayer, Colin, 2003, Finance, investment and growth. Journal of Financial Economics 69, 191-226.
Cho, Myeong-Hyeon, 1998. Ownership structure, investment and the corporate value: an empirical analysis. Journal of Financial Economics 47, 103-121.
Claessens, Stijn, Djankov, Simeon, Fan, Joseph P. H., Lang Larry H. P., 2002. Disentangling the incentive and entrenchement effects of large shareholders. Journal of Finance 57, 2741-2771. Coles, Jeffrey L., Lemmon, Michael, Meschke, Felix, 2007. Structural Models and Endogeneity in
Corporate Finance: the Link Between Managerial Ownership and Corporate Performance. Available at SSRN: http://ssrn.com/abstract=423510.
Demsetz, Harold, 1983, The structure of ownership and the theory of the firm. Journal of Law and Economics 26, 375-390.
Demsetz, Harold, Lehn Kenneth, 1985. The structure of ownership: Causes and consequences. Journal of Political Economy 93, 1155-1177.
Demsetz, Harold, Villalonga, Belen, 2001. Ownership structure and corporate performance. Journal of Corporate Finance 7, 209-233.
Denis, David J., McConnell, John J., 2003. International corporate governance, Journal of Financial and Quantitative Analysis 38, 1-36.
Faccio, Mara, Lang, Larry H.P., 2002. The ultimate ownership of Western European corporations. Journal of Financial Economics 65, 365-395.
Filatotchev, Igor, Isachenkova, Natalia, Mickiewicz, Tomasz M., 2007. Ownership structure and investment finance in transition economies. Economics of Transition 15, 433–460.
Gaspar, José-Miguel, Massa, Massimo, 2007. Local ownership as private information: Evidence on the monitoring – liquidity trade-off. Journal of Financial Economics 83, 751-792.
Glaeser, Edward, Johnson, Simon, Shleifer, Andrei, 2001. Coase versus the Coasians. Quarterly Journal of Economics 116, 853-899.
Grosfeld, Irena, Hashi, Iraj, 2007. The emergence of large shareholders in mass privatized firms: Evidence from Poland and from the Czech Republic. Corporate Governance. An International Review 15, 529-543.
Gugler, Klaus, Weigand, Jürgen, 2003. Is ownership really endogenous? Applied Economics Letters 10, 483-486.
Hanousek, Jan, Kocenda, Evzen, Svejnar, Jan, 2007. Origin and concentration: Corporate ownership, control and performance in firms after privatization. Economics of Transition 15, 1-31.
Helwege, Jean, Pirinsky, Christo, Stulz, René M, 2007. Why do firms become widely held? An analysis of the dynamics of corporate ownership. Journal of Finance 62, 995-1028.
Hermalin, Benjamin E., Weisbach, Michael S., 1991. The effects of board composition and direct incentives on firm performance. Financial Management 20, 101-112.
Hermalin, Benjamin E., Weisbach, Michael S., 2003. Boards of directors as an endogenously determined institutions: A Survey of the economic literature, Economic Policy Review 9, 7-26.
Himmelberg, Charles P., Hubbard, R. Glenn, Palia, Darius, 1999. Understanding the determinants of managerial ownership and the link between ownership and performance. Journal of Financial Economics 53, 353-384.
Holderness, Clifford G., Kroszner, Randall S., Sheehan, Dennis P., 1999. Were the good old days that good? Changes in managerial stock ownership since the Great Depression. Journal of Finance 54, 435-469.
Holmström, Bengt, Roberts John, 1998. The Boundaries of the Firm Revisited. The Journal of Economic Perspectives 12, 73-94.
Holmström, Bengt, Tirole, Jean, 1993. Market liquidity and performance monitoring. Journal of Political Economy 51, 678-709.
Jensen, Michael, C., Meckling, William, H., 1976. Theory of the firm: Managerial behavior, agency costs and ownership structure. Journal of Financial Economics, 3, 305-360.
Johnson, Simon, La Porta, Rafael, Lopez-de-Silanes, Florenzio, and Shleifer, Andrei, 2000. Tunnelling. American Economic Review 90, 22-27.
Jones, Derek C., Kalmi, Panu, Mygind, Niels, 2003. Choice of ownership structure and firm performance: Evidence from Estonia. Working Paper No. 560. William Davidson Institute.
Kahn, Charles, Winton, Andrew, 1998. Ownership structure, speculation and shareholder intervention. Journal of Finance 53, 99-129.
Klapper, Leora F., Laeven, Luc, Love, Inessa, 2005. What drives corporate governance reform? Firm level evidence from Eastern Europe. Working Paper No. 3600. World Bank Policy Research.
Kole, S., 1993. Managerial ownership and firm performance: incentives or rewards? Working paper No. 93-19. Bradley Policy Research Center, Rochester, NY.
La Porta, Rafael, Lopez-de-Silanes, Florenzio, Shleifer Andrei, 1998. Law and finance. Journal of Political Economy 106, 1113-55.
La Porta, Rafael, Lopez-de-Silanes, Florenzio, Shleifer Andrei, 1999. Corporate Ownership Around the World. Journal of Finance 54, 471-517.
Lehmann Erik, Weigand, Jürge, 2000. Does the governed corporation perform better? Governance structures and corporate performance in Germany. European Finance Review 4, 157-195. Laeven, Luc, and Ross Levine, 2007, Complex Ownership Structures and Corporate Valuations, Review
of Financial Studies, forthcoming.
Lins Karl V., 2003. Equity ownership and firm value in emerging markets. The Journal of Financial and Quantitative Analysis 38, 159-184.
Loderer, Claudio, Martin, Kenneth, 1997. Executive ownership and performance: tracking faint traces. Journal of Financial Economics 45, 223-255.
McConnell, John J., Servaes, Henri, 1990. Additional evidence on equity ownership and corporate value. Journal of Financial Economics 27, 595-612.
Milnor, John, Shapley, Lloyd, 1978. Value of large games II: Oceanic games, Mathematics of Operations Research 3, 290-307.
Morck, Randall, Shleifer, Andrei, Vishny, Robert, 1988. Management Ownership and Market Valuation: An Empirical Analysis. Journal of Financial Economics 20, 293-315.
Pindado, Julio, de la Torre Chabela, 2004. Why is ownership endogenous? Applied Economic Letters 11, 901-904.
Prendergast, Canice, 2002. The tenous trade-off between risk and incentives. Journal of Political Economy 110, 1071-1102.
Rajan, Raghuram G., Zingales, Luigi, 2000. The governance of the new enterprise. In: Corporate Governance Vives, Xavier (Ed.). Cambridge University Press.
Shleifer, Andrei, Vishny, Robert, 1997. A survey of corporate governance. Journal of Finance 52, 737-783.
Stock, James H., Yogo, Motohiro, 2005. Testing the weak instruments in IV regression. In: Identification and Inference for Econometric models: A Festschfrift in Honor of Thomas Rothenber. Andrews, Donald W. K., Stock, James H. (Eds.). Cambridge University Press.
Stulz René M., 2006. Financial globalization, corporate governance and Eastern Europe, Working Paper n° 11912. NBER.
Thomsen, Steen, Pedersen Torben, Kvist Hans K., 2006, Blockholder ownership: Effects on firm value in market and control based governance systems, Journal of Corporate Finance 12, 246-269. Trojanowski, Grzegorz, 2008. Equity Block Transfers in Transition Economies: Evidence from Poland,
Economic Systems 32, 217-306.
Zeckhauser, R., J., Pound, 1990. Are large shareholders effective monitors? An investigation of share ownership and corporate performance, in Asymmetric Information, Corporate Finance, and Investment. Hubbard R. Glenn, (Ed.). University of Chicago Press, IL, 149-180.
Zhou, Xianming, 2001. Understanding the determinants of a managerial ownership and the link between ownership and performance: a comment. Journal of Financial Economics 62, 559-571.
Table 1. Firm characteristics by type of firms: high-tech versus ‘mature’ firms
Firms are classified into two groups: high-tech, when the firm belongs to the sector of innovative technologies according to the classification of listed equities used on the Warsaw Stock Exchange, ‘mature’ otherwise. The table presents firm characteristics in 2003 which is the last year covered by the sample. Tobin’s Q is defined as market value of equity plus book value of total debt divided by book value of assets. Ownership concentration is the share of the voting rights of the largest shareholder. Initial profitability is the average net profit on total assets, calculated for the years preceding the publication of the prospectus. Size is the natural logarithm of total sales. Years of listing is the number of years since the first listing on the WSE. Intangibles are the share of intangible assets, as they appear on the balance sheet, in fixed assets. Profitability is the ratio of net profit to sales. Risk is the standard error of the residual of CAPM equation. Vote/share is the ratio of voting rights to cash flow rights of the largest shareholder. Medians are in italic and standard errors in parentheses. The last column provides the t-statistics for the differences in means between the two categories of firms. Asterisks denote significance of t-tests of equality of means with ***, ** and * indicating significance at the 1, 5 and 10 percent level, respectively.Variable All firms High-tech firms ‘Mature’ firms Difference
Tobin’s Q 1.30 0.99 (0.97) 1.72 1.57 (0.97) 1.24 0.96 (0.96) 2.20** Ownership concentration 0.43 0.40 (0.23) 0.42 0.35 (0.27) 0.44 0.40 (0.23) -0.35 Initial profitability 0.22 0.19 (0.20) 0.27 0.25 (0.38) 0.22 0.18 (0.17) 1.12 Firm size 11.10 11.26 (2.07) 10.64 10.70 (2.30) 11.17 11.30 (2.03) -1.22** Years of listing 5.57 5.00 (2.66) 3.67 4.00 (2.09) 5.77 6.00 (2.64) -4.00*** Intangibles 0.02 0.003 (0.04) 0.05 0.03 (0.08) 0.01 0.00 (0.03) 4.80*** Profitability -0.34 0.02 (3.88) 0.09 0.03 (0.73) -0.40 0.02 (4.14) 0.59 Risk 3.70 3.35 (2.06) 3.03 2.31 (1.67) 3.79 3.41 (2.09) -1.60* Vote/share 1.07 1.00 (0.29) 1.07 1.00 (0.13) 1.06 1.00 (0.30) -0.10 Observations 214 28 186
Table 2. Concentration of control in high-tech and ‘mature’ firms
The table presents three measures of ownership concentration in the sample of non-financial firms listed on the Warsaw Stock Exchange, after one year and after six years of listing: 1/ fraction of voting rights of the single largest shareholder; 2/ Shapley value of the largest shareholder (i.e. the probability that he is pivotal in forming majority coalition); 3/ Herfindahl index of the voting rights (it is calculated under the assumption that unknown shareholders hold each 4% of voting rights; therefore we underestimate the actual power of the main shareholder).
Largest shareholder Shapley value Herfindahl index
Years of listing Years of listing Years of listing Sample
1 year 6 years 1 year 6 years 1 year 6 years
All firms Mean Median 0.41 0.34 0.39 0.34 0.56 0.42 0.56 0.46 0.27 0.19 0.25 0.20 Mature firms Mean Median 0.41 0.33 0.40 0.35 0.56 0.43 0.57 0.47 0.27 0.19 0.26 0.21 High-tech firms Mean Median 0.42 0.35 0.28 0.27 0.55 0.35 0.41 0.33 0.30 0.24 0.17 0.11
Table 3. Tobin’s Q by ownership category in high-tech and mature firms
Firms have majority ownership if the largest owner holds more than 50 % of voting rights. Firms have single non-majority blockholder if the largest shareholder holds between 20 % and 50 % of voting rights and there is no other blockholder with at least 20 % of voting rights. Firms have multiple blockholders if there is at least a second shareholder with at least 20 % of voting rights. In widely held firms no shareholder owns more than 20% of voting rights.
Number of firms
Average Q Median Q
Majority owner
Of which: mature firms high-tech firms 450 419 31 1.18 1.15 1.51 0.98 0.97 1.45
Single non-majority owner Of which: mature firms
high-tech firms 450 420 30 1.03 1.00 1.53 0.87 0.86 1.28 Multiple blockholders
Of which: mature firms high-tech firms 329 296 33 1.13 1.00 2.29 0.83 0.78 1.95 Widely held
Of which: mature firms high-tech firms 299 270 29 1.19 1.10 2.01 0.96 0.95 2.07
Table 4. Ownership concentration by the type of the largest shareholder
The table presents summary statistics on the evolution of ownership concentration (during the first six years of listing) measured as fraction of voting rights of the largest shareholder in the sample of non-financial firms listed on the Warsaw Stock Exchange between 1991 and 2003. Owners are classified by four types: families, industrial companies, financial institutions, and the state. N represents the number of observations.
Ownership concentration during the first six years of listing Type of the largest shareholder Prospectus 1 year 2 years 3 years 4 years 5 years 6 years Family Mean Median N 0.517 0.481 83 0.486 0.450 85 0.437 0.355 66 0.399 0.343 65 0.399 0.332 64 0.408 0.358 60 0.396 0.360 55 Financial institution Mean Median N 0.304 0.330 63 0.294 0.325 61 0.276 0.300 67 0.272 0.294 53 0.306 0.283 44 0.292 0.254 37 0.277 0.249 31 Industrial company Mean Median N 0.546 0.525 64 0.508 0.450 63 0.462 0.471 77 0.477 0.461 77 0.489 0.490 93 0.520 0.500 92 0.486 0.450 83 State Mean Median N 0.837 0.999 46 0.796 0.999 44 0.515 0.511 22 0.417 0.355 24 0.423 0.365 19 0.349 0.295 17 0.338 0.285 14
Table 5. Tests for endogeneity of ownership concentration, validity and
significance of the instruments
The table presents results of the estimation of IV regression where the dependent variable is Tobin’s Q. In columns (1) and (2) ownership concentration is instrumented by the number of years a firm has been listed on the stock exchange. In columns (3) and (4) initial ownership concentration (before the first listing) is used as additional instrument for ownership concentration. Tobin’s Q is defined as market value of equity plus book value of total debt divided by book value of assets. Ownership concentration is the logistic transformation of the percentage voting rights of the largest shareholder. Initial profitability is the average net profit on total assets, calculated for the years preceding the publication of the prospectus. Size is the natural logarithm of total sales. Years of listing are defined as the number of years of listing on the WSE. Intangibles are the share of intangible assets in fixed assets. Profitability is the ratio of net profit to sales. Owners are classified by four types: family, financial institution, and the state (industrial company is the reference category). Vote/share is the ratio of voting rights to cash flow rights of the largest shareholder. Risk and risk² are respectively the standard error and variance of the residual of CAPM equation. All regressions include intercepts and year fixed effects (not reported). Standard errors are presented in parentheses. Significance at the 1%, 5%, and 10% level is denoted ***, **, and *, respectively. Three tests are reported at the bottom of the table: Durbin-Wu-Hausman tests for endogeneity of ownership concentration; F-stat for the relevance of the instruments (joint significance of the instruments); Hansen-Sargan test of overidentifying restrictions (validity of the instruments).
IV: years of listing IV: years of listing, initial ownership concentration Variables (1) (2) (3) (4) Ownership concentration 0.111** 0.176*** 0.111*** 0.143*** (0.049) (0.057) (0.033) (0.040) Age -0.004*** -0.003*** -0.004*** -0.003*** (0.001) (0.001) (0.001) (0.001) Size -0.018 -0.001 -0.016 -0.003 (0.016) (0.021) (0.017) (0.020) Intangibles 2.086*** 2.456*** 2.104*** 2.327*** (0.709) (0.747) (0.705) (0.728) Profitability -0.013 -0.015 -0.014 -0.014 (0.010) (0.011) (0.010) (0.010) Family 0.270*** 0.243*** 0.239*** 0.210*** (0.059) (0.063) (0.060) (0.062) Financial institution 0.092 0.162** 0.081 0.123* (0.071) (0.078) (0.066) (0.071) State -0.016 -0.138 -0.030 -0.106 (0.100) (0.122) (0.090) (0.105) Foreign owner>20% 0.100 0.030 0.110* 0.060 (0.066) (0.074) (0.065) (0.070) Vote/share 0.010 -0.015 0.012 -0.009 (0.061) (0.063) (0.060) (0.060) Risk -0.073** -0.092*** (0.032) (0.031) Risk² 0.010*** 0.013*** (0.002) (0.002) Initial profitability 1.137*** 1.112*** 1.148*** 1.116*** (0.122) (0.127) (0.121) (0.124) Observations 1264 1163 1217 1116
Durbin-Wu-Hausman test, p-value 0.07 0.01 0.00 0.00
F-stat 1ststage, p-value 0.00 0.00 0.00 0.00
Table 6. Ownership concentration and Tobin’s Q: system of simultaneous
equations (1)
The table presents results of the estimation of simultaneous equations system with ownership concentration instrumented by the number of years a firm has been listed on the stock exchange. All variables are defined as in Table 5. All regressions include intercepts and year fixed effects (not reported). Standard errors are presented in parentheses. Significance at the 1%, 5%, and 10% level is denoted ***, **, and *, respectively.
Variables All firms (1) All firms (2) ‘Mature’ firms (3) ‘Mature’ firms (4) High-tech firms (5) High-tech firms (6) Dep. variable: Tobin’s Q Ownership
concentration Tobin’s Q Ownership concentration Tobin’s Q Ownership concentration Tobin’s Q (t-1) 0.036 0.133** -0.202 (0.054) (0.061) (0.125) Ownership concentration 0.341*** 0.403*** -0.859** (0.085) (0.083) (0.417) Age -0.003*** -0.002** -0.034 (0.001) (0.001) (0.034) Size -0.021 0.143*** -0.023 0.153*** -0.341** -0.105 (0.025) (0.033) (0.026) (0.036) (0.137) (0.087) Intangibles 3.129*** -4.097*** 2.143** -3.928*** 1.904 -0.028 (0.876) (1.226) (1.024) (1.482) (2.529) (1.869) Profitability -0.030** -0.008 -0.030** -0.011 -0.054 0.082 (0.014) (0.022) (0.014) (0.022) (0.162) (0.126) Family 0.301*** -0.512*** 0.281*** -0.535*** 0.055 0.362 (0.076) (0.101) (0.080) (0.108) (0.432) (0.273) Financial institution 0.305*** -0.918*** 0.363*** -0.949*** -0.146 -0.046 (0.101) (0.104) (0.103) (0.107) (0.563) (0.436) State 0.172 -0.576*** 0.152 -0.595*** -0.945 -0.834 (0.115) (0.159) (0.116) (0.163) (1.209) (0.916) Foreign owner>20% -0.137 0.763*** -0.179** 0.735*** 1.391** 0.983** (0.092) (0.105) (0.091) (0.109) (0.663) (0.444) Vote/share -0.148* 0.470*** -0.123 0.377*** 2.350** 1.894*** (0.080) (0.100) (0.082) (0.111) (0.933) (0.315) Risk -0.130*** 0.224*** -0.147*** 0.235*** -0.752* 0.028 (0.039) (0.050) (0.041) (0.052) (0.405) (0.314) Risk² 0.012*** -0.008*** 0.013*** -0.008*** 0.046 -0.020 (0.002) (0.003) (0.002) (0.003) (0.039) (0.029) Initial profitability 1.022*** 1.007*** 0.754* (0.148) (0.180) (0.426) Years of listing -0.177*** -0.178*** -0.139** (0.023) (0.024) (0.068) Observations 984 913 71
Table 7. Ownership concentration and Tobin’s Q: system of simultaneous
equations (2)
The table presents results of estimation of simultaneous equations system with ownership concentration instrumented by the number of years a firm has been listed on the stock exchange and by the ownership concentration before the first listing. All variables are defined as in Table 5. All regressions include intercepts and year fixed effects (not reported). Standard errors are presented in parentheses. Significance at the 1%, 5%, and 10% level is denoted ***, **, and *, respectively.
Variables All firms (1) All firms (2) ‘Mature’ firms (3) ‘Mature’ firms (4) High-tech firms (5) High-tech firms (6) Dep. variable Tobin’s Q Ownership
concentration Tobin’s Q Ownership concentration Tobin’s Q Ownership concentration Tobin’s Q (t-1) 0.014 0.105* -0.007 (0.054) (0.062) (0.111) Ownership concentration 0.264*** 0.342*** -0.696** (0.071) (0.072) (0.265) Age -0.003*** -0.002** -0.042 (0.001) (0.001) (0.031) Size -0.013 0.111*** -0.014 0.120*** -0.309** 0.004 (0.024) (0.034) (0.025) (0.037) (0.120) (0.074) Intangibles 2.841*** -3.923*** 1.919* -3.694** 1.728 0.639 (0.836) (1.225) (0.981) (1.487) (2.481) (1.524) Profitability -0.029** -0.004 -0.030** -0.006 -0.060 0.123 (0.014) (0.021) (0.014) (0.022) (0.159) (0.103) Family 0.257*** -0.485*** 0.232*** -0.503*** -0.020 0.214 (0.072) (0.102) (0.076) (0.110) (0.399) (0.224) Financial institution 0.228** -0.970*** 0.299*** -1.003*** -0.136 -0.130 (0.094) (0.106) (0.097) (0.109) (0.554) (0.355) State 0.127 -0.862*** 0.115 -0.838*** -0.788 -0.622 (0.110) (0.169) (0.111) (0.174) (1.149) (0.748) Foreign owner>20% -0.085 0.724*** -0.146* 0.717*** 1.225** 0.114 (0.088) (0.110) (0.088) (0.114) (0.569) (0.407) Vote/share -0.110 0.398*** -0.093 0.306*** 2.020*** 0.441 (0.073) (0.100) (0.077) (0.112) (0.648) (0.384) Risk -0.129*** 0.244*** -0.149*** 0.250*** -0.755* 0.015 (0.038) (0.052) (0.039) (0.054) (0.412) (0.263) Risk² 0.013*** -0.009*** 0.014*** -0.008** 0.049 0.003 (0.002) (0.003) (0.002) (0.003) (0.039) (0.025) Initial profitability 1.011*** 1.009*** 0.759* (0.142) (0.174) (0.419) Years of listing -0.197*** -0.199*** -0.183*** (0.023) (0.025) (0.057) Initial ownership concentration 0.053*** 0.044*** 0.568*** (0.012) (0.012) (0.117)