BLOCK 1 PROCEDURE RECOMMENDATIONS
FOR LOGAN AIRPORT COMMUNITY NOISE
REDUCTION
Prof. R. John Hansman
Luke Jensen
Jacqueline Thomas
Greg O’Neill
Alison Yu
Report No. ICAT-2017-08 December 2017
MIT International Center for Air Transportation (ICAT) Department of Aeronautics & Astronautics
Massachusetts Institute of Technology Cambridge, MA 02139 USA
Executive Summary
Recent developments in navigation and surveillance technology have enabled new high-precision approach and departure operational procedures using GPS and Required Navigation Performance (RNP) standards. These procedures have proven effective for reducing fuel consumption and streamlining some aspects of air traffic control. However, flight tracks that were previously dispersed over wide areas due to less precise navigation or ATC vectoring are more concentrated on specific published tracks with effects on underlying communities.
This study is an initial investigation to identify potential modifications to approach and departure procedures at Boston Logan International Airport (BOS) which would reduce community noise impact in areas which experience flight track concentration. Potential procedure modifications were separated into two sequential “Blocks”. Block 1 procedures were characterized by clear predicted noise benefits, limited operational/technical barriers and a lack of equity issues. Block 2 procedures exhibit greater complexity due to potential operational and technical barriers as well as equity issues (defined as noise redistribution between communities for the purposes of this study). This report presents recommendations for an initial set of Block 1 procedures. Continued analysis and community outreach will inform the identification and development of Block 2 procedures.
RNAV procedures were implemented at BOS between 2012 and 2013. Candidate approach and departure modifications were first identified based on an analysis of historical flight track densities over the communities surrounding BOS before and after the implementation of new RNAV procedures coupled with noise complaint records and US Census population data. Potential procedure modifications were considered for each identified arrival and departure runway including: lateral flight track adjustment to avoid noise-sensitive areas, vertical trajectory modifications including speed, thrust or configuration management as well as techniques to reintroduce dispersion into flight trajectories.
The technical recommendations presented in this report are not developed to an implementation-ready stage. Rather, the work completed to date represents a preliminary feasibility analysis for each recommended procedure. Prior to implementation of any of these recommendations, the FAA will need to execute internal verification and validation processes. Modifications to the recommended procedures may be required. The noise-reduction objectives for each procedure should be retained in any necessary procedure refinements.
Procedure modification options were assigned to Block 1 or Block 2 based on a preliminary evaluation of noise reduction potential, operational/technical feasibility and potential equity issues. Some candidate procedures were rejected due to safety concerns or lack of noise benefits. The noise analysis compared the proposed modification with current procedures on a single-event basis. Noise contours and corresponding population exposures were calculated for the maximum noise level (LMAX) and Sound Exposure Level (SEL) metrics.
The technical feasibility analysis included an examination of flight safety, aircraft performance, navigation and flight management system (FMS) limitations, pilot workload, ATC workload, and procedure design criteria. The process of procedure identification and refinement was informed by outreach to impacted stakeholders including community representatives, FAA
regional and national offices, air traffic control (ATC) managers and specialists, airline technical pilots, and public officials.
As a result of this process the procedures which were identified for Block 1 and their primary noise benefits are listed below.
Block 1 Procedure Recommendations
Proc. IDD = Dep. A = Arr.
Procedure Primary Benefits
1-D1 Restrict target climb speed for jet departures from Runways 33L and 27 to 220 knots or minimum safe airspeed in clean configuration, whichever is higher.
Reduced airframe and total noise during climb below 10,000 ft (beyond immediate airport vicinity)
1-D2 Modify RNAV SID from Runway 15R to move tracks further to the north away from populated areas.
Departure flight paths moved north away from Hull
1-D3 Modify RNAV SID from Runway 22L and 22R to initiate turns sooner after takeoff and move tracks further to the north away from populated areas.
Departure flight paths moved north away from Hull and South Boston
1-D3a Option A: Climb to intercept course
(VI-CF) procedure
1-D3b Option B: Climb to altitude, then
direct (VA-DF) procedure
1-D3c Option C: Heading-based procedure
1-A1 Implement an overwater RNAV approach procedure with RNP overlay to Runway 33L that follows the ground track of the jetBlue RNAV Visual procedure as closely as possible.
Arrival flight paths moved overwater instead of over the Hull peninsula and points further south
1-A1a Option A: Published instrument
approach procedure
1-A1b Option B: Public distribution of
Table of Contents
I. Introduction ... 7
II. Study Approach ... 10
A. Overview of Study Approach ... 10
B. Identification of Key Problem Areas ... 10
1. Flight Track Density Evaluation ... 10
2. Complaint Analysis ... 10
3. Procedure Identification ... 11
C. Phased Approach: Block 1 and Block 2 ... 12
D. Community and Stakeholder Feedback ... 12
E. Noise Modeling and Analysis ... 13
F. Metrics Used for Procedure Evaluation ... 14
III. Block 1 Procedure Recommendations ... 15
A. 1-D1: Runway 33L and 27 Reduced Speed Departures ... 16
1. Summary ... 16
2. Technical Basis for Recommendation ... 16
3. Track Density Plots ... 18
4. Procedure Recommendation Details ... 19
5. Noise Modeling Results and Population Exposure ... 21
6. Potential Barriers to Implementation ... 24
B. 1-D2: Runway 15R RNAV Waypoint Relocation ... 26
1. Summary ... 26
2. Track Density Plots ... 26
3. Procedure Recommendation Details ... 26
4. Noise Modeling Results and Population Exposure ... 28
5. Potential Barriers to Implementation ... 28
C. 1-D3: Runway 22L and 22R RNAV Waypoint Relocation ... 29
1. Summary ... 29
2. Track Density Plots ... 29
3. Procedure Recommendation Details ... 30
4. Noise Modeling Results and Population Exposure ... 34
5. Potential Barriers to Implementation ... 37
D. 1-A1: Runway 33L Low-Noise Overwater Approach Procedures ... 39
1. Summary ... 39
2. Track Density Plots ... 39
3. Procedure Recommendation Details ... 39
4. Noise Modeling Results and Population Exposure ... 44
5. Potential Barriers to Implementation ... 45
IV. Conclusion ... 46
Appendix A Noise Analysis Method ... 47
A. Noise Analysis Tools ... 47
B. Flight Trajectory Inputs ... 48
C. Population Exposure Calculations ... 49
Appendix B Noise Metrics ... 51
Appendix D Flight Track Density Plots ... 57 A. Runway 4R Arrivals ... 57 B. Runway 4R Departures ... 58 C. Runway 4L Arrivals ... 59 D. Runway 9 Departures ... 60 E. Runway 15R Arrivals ... 61 F. Runway 15R Departures ... 62 G. Runway 22L Arrivals ... 63 H. Runway 22R Departures ... 64 I. Runway 27 Arrivals ... 65 J. Runway 27 Departures ... 66 K. Runway 32 Arrivals ... 67 L. Runway 33L Arrivals ... 68 M. Runway 33L Departures ... 69 Bibliography ... 70
Acronyms and Abbreviations
Term DefinitionA4A Airlines for America
AEDT Aviation Environmental Design Tool
ASDE-X Airport Surface Detection Equipment Model X
ATC Air Traffic Control
BADA-4 Base of Aircraft Data Version 4
BOS Boston Logan International Airport
DNL Day-Night Average Level
FAA Federal Aviation Administration
HMMH Harris Miller Miller and Hanson, Inc.
IAP Instrument Approach Procedure
ILS Instrument Landing System
LMAX Maximum Sound Pressure Level
Massport Massachusetts Port Authority
MCAC Massport Community Advisory Committee
MIT Massachusetts Institute of Technology
MOU Memorandum of Understanding
MTOW Maximum Takeoff Weight
NABOVE Number of Events Above Set Level
NAS National Airspace System
NASA National Aeronautics and Space Administration
NATCA National Air Traffic Controllers Association
NAVAID Navigation Aid
NPD Noise Power Distance
PBN Performance Based Navigation
RNAV Area Navigation
RNP Required Navigation Performance
RVFP RNAV Visual Flight Procedure
SEL Sound Exposure Level
SID Standard Instrument Departures
SPL Sound Pressure Level
STAR Standard Terminal Arrival Route
TARGETS Terminal Area Route Generation, Evaluation, and Traffic Simulation
I.
Introduction
Aircraft noise is a growing concern for communities near airports around the United States. While modern aircraft are quieter on a flight-by-flight basis than their predecessors1, aircraft overfly some communities with increasing frequency due to traffic growth and flight track concentration. The precision of aircraft navigation has improved over the past few decades due to the introduction of GPS and other advanced navigation systems. This has led to the introduction of advanced Performance Based Navigation procedures2, including Area Navigation (RNAV) and Required Navigation Performance (RNP) procedures as illustrated in Figure 1.
Figure 1. Comparison between conventional, RNAV, and RNP navigation (Figure source: FAA)
Historically, routes were defined by radio navigation aids (NAVAIDS) located at various locations on the ground. Approach and departure procedures consisted of tracks connecting existing NAVAIDs or compass headings issued by air traffic controllers either through published procedures or by radar vectoring. A combination of natural variation in navigational precision and controller instruction timing resulted in a natural dispersion of flight trajectories. This can be seen in the left side of Figure 2 which shows flight tracks of 2010 Runway 33L departures from Boston Logan Airport (BOS) prior to the implementation of RNAV departures.
Figure 2. Flight track concentration from Runway 33L departures in 2010 and 2015 (before and after RNAV implementation
Area Navigation (RNAV) provides the ability for aircraft to navigate between waypoints which can be defined at any location. This improves the precision, safety and flexibility in flight procedures. RNAV procedures are generally comprised of an ordered sequence of waypoints with altitude and/or speed constraints at some or all of the waypoints. Required Navigation Performance (RNP) procedures are even more precise and allow curved flight segments and more precise vertical guidance. RNP procedures can be designed with tighter tolerances than conventional routes or RNAV procedures due to the onboard monitoring and alerting capability of participating aircraft.3
In recent years, it has become evident that some PBN procedures have potential unintended consequences in terms of community noise impact.4 The increased use of Area Navigation (RNAV) and Required Navigation Performance (RNP) procedures has resulted in a concentration of lateral tracks near airports due to the increased precision of these procedures. While this increased precision has allowed operational benefits such as improved safety, reduced ATC workload, higher runway throughput, reduced fuel burn, better terrain avoidance, and lower approach minimums3, it has also resulted in noise concentration and community opposition as aircraft fly consistent and repetitive tracks over the same communities. The right panel of Figure 2 shows an example of flight track concentration at Boston Logan Airport (BOS) arising from RNAV departure procedure implementation between 2010 and 2015.
Jet departures at BOS are normally assigned to one of nine RNAV departure procedures. These procedures are typically flown by an airplane’s autopilot system, although they can also be flown manually with guidance from the aircraft’s onboard navigation systems. Each of the procedures ends at a waypoint that serves as a transition into the high-altitude airway system for a particular direction of flight. The purpose of the published procedures is to provide a safe, systematic, and efficient transition for departing aircraft from liftoff through the cruise phase of flight. However, the precision of the new procedures has removed much of the dispersion in flight tracks that existed prior to RNAV implementation.
Arrivals at BOS also use RNAV Standard Terminal Arrival Routes (STARs) for the transition from the high-altitude airway structure to the airport terminal environment. The final approach and landing may also occur with PBN guidance at some runways, although most flights
use the conventional radio-based Instrument Landing System (ILS) or visual guidance for the final approach to landing. The observed lateral navigation precision of aircraft flying the ILS is similar to RNAV.
Communities around the US have expressed frustration with flight track concentration and noise arising from PBN implementation.5 At the same time, operational and safety benefits of PBN and the worldwide implementation of new procedures make it difficult to revert to non-PBN procedures. Ideally, non-PBN technology and procedures could be used to reduce overflight noise while retaining operational benefits.6 This study is part of an effort to identify PBN approach and departure procedures that could reduce overflight noise and address concerns raised by RNAV noise concentration.
II.
Study Approach
A.
Overview of Study Approach
The objective of this study is to identify potential procedure modifications at BOS to reduce overflight noise arising from PBN track concentration. The process to reach this objective included a review of flight procedures and radar records from before and after RNAV implementation, identification of problematic runways and procedures in terms of complaints and population impact, identification and noise analysis of candidate procedure modifications for each area of concern, and evaluation of potential barriers to implementation for the proposed modifications. The results of this study are intended to inform procedure design and implementation efforts at the FAA intended to mitigate overflight noise arising from PBN track concentration.
B.
Identification of Key Problem Areas
This study used a data-driven approach to identify those runways where approach and departure procedure modifications would have a significant community noise reduction impact. In order to evaluate the drivers of community annoyance from aircraft noise, a review of historical radar tracks and community complaints was undertaken.
1. Flight Track Density Evaluation
This process included review and visualization of published arrival and departure procedures from the time period before and after implementation of RNAV at Boston Logan Airport. Historical radar data was used to evaluate changes in flight track density for arrivals and departures from each runway used by jet aircraft. For each arrival and departure procedure, areas of flight track concentration were identified for further evaluation. Figure 2 shows an example flight track density plot generated for Runway 33L jet departures before and after RNAV implementation, clearly illustrating the communities which are impacted by increased track concentration. Visualizations for flight track density for the key runways at BOS were generated by Harris, Miller, Miller and Hanson Inc. (HMMH) and are provided for reference in Appendix D.
2. Complaint Analysis
In addition to raw radar data, complaint data from the Massport noise office were used to identify regions of widespread annoyance arising from specific arrival or departure procedures. These complaints are logged with Massport via phone, voicemail, internet, or mail. The exact time of each complaint was not included in the analysis because complaints are not always filed at the time of the motivating event. Figure 3 shows complaint data from August 2015 to July 2016, after the implementation of RNAV arrivals and departures at BOS. Each address where at least one complaint was filed is shown with a red dot. The left side of the figure shows departure radar tracks and the right side shows arrivals, including both jet and propeller aircraft.
Figure 3. Complaints at BOS between August 2015 and July 2016 (one dot per address) with departure (left) and arrival (right) tracks from 12 days in the same time period
Qualitative assessment of the complaint map shows several areas where complaint clusters were associated with particular arrival or departure corridors. Departures from Runway 33L drive a broad set of complaints in the vicinity of Medford, Somerville, Cambridge, Arlington, and beyond. Departures from Runway 27 are associated with a region of complaints ranging from the South End of Boston to Roxbury, Jamaica Plain, and points beyond. Departures from Runway 22L and 22R drive complaints in South Boston and the Hull peninsula. In terms of arrivals, approaches to runways 4R and 4L drive a region of complaints along the approach path including Braintree, Milton, Dorchester, and South Boston. Approaches to Runway 33L appear to drive additional complaints in the vicinity of Hull. Approaches to runway 22L and 22R appear to drive complaints from Revere, Lynn, Peabody, and other North Shore communities. Complaints outside of these primary clusters (including those outside the geographic bounds of the maps shown in Figure 3) were also evaluated to determine potential annoyance drivers and mitigation strategies further from the airport.
Noise concerns arising from both arrivals and departures in close-in communities surrounding the airport are also evident in the complaint map. However, RNAV technology has a minimal impact on typical flight tracks immediately after takeoff or before landing. RNAV procedure modifications, such as those under investigation in this study, are unlikely to have significant impacts on noise in the immediate vicinity of the airport.
Complaint data is important for identifying high-level annoyance trends, but can also be influenced by outside factors such as unequal access to complaint mechanisms. Therefore, direct community engagement and outreach was also a key component of the procedure evaluation process to identify and understand problem areas for overflight noise.
3. Procedure Identification
For each departure and arrival corridor, a set of candidate procedure modifications were identified with input from communities, airline technical pilots, air traffic controllers, and the project technical team. These procedures were evaluated in terms of noise reduction potential, flight safety, community equity, operational implications including airport capacity and throughput, fuel burn/flight time impact, and regulatory requirement.
The following flight procedure concepts were considered in the preliminary phase7:
• Modified lateral routing for arrivals and departures to avoid high population density areas, with an emphasis on implementing overwater flight tracks
• Thrust cutbacks on departure
• High-thrust steep climbs
• Reduced speed climbs
• Steeper descent angles on approach
• Multi-segment approaches with a steep segment transitioning to a standard final approach
• Noise-masking approach procedures that overfly regions of high ambient noise (major freeways and industrial areas)
C.
Phased Approach: Block 1 and Block 2
In order to provide noise relief to communities in a timely manner, this study involved the development and recommendation of procedures in two phases. The initial set of procedures (Block 1) is characterized by noise benefits in terms of absolute population exposure, no significant equity issues, and manageable operational or technical barriers. These procedures are intended to be “win-win” concepts with strong potential for implementation, pending verification and environmental review.
A follow-on set of procedures (Block 2) will be recommended after further analysis. The Block 2 procedures are expected to exhibit greater complexity due to potential operational and technical barriers as well as equity issues. Altering flight procedures may benefit one community at the expense of another. While such changes may have merit in terms of noise redistribution or environmental equity, negotiation and governance strategies between impacted communities will be needed to reach consensus.
In addition to community equity considerations, Block 2 procedures may involve additional complexity due to operational or technical barriers. Some PBN procedures require specialized pilot training and/or cockpit avionics that may reduce the initial utilization rate in day-to-day operations. Other procedures in Block 2 may be easily flown using standard operating procedures and avionics but require airspace or procedure design waivers.
D.
Community and Stakeholder Feedback
Stakeholder feedback was solicited throughout the procedure evaluation process. Communities provided feedback on preliminary concepts through open-forum public meetings as well as briefings to the Massport Community Advisory Committee (MCAC) Aviation Subcommittee. Through these meetings, several concepts were suggested, tested, and/or revised in order to consider specific areas of concern for highly-impacted communities. Due to procedural complexity and potential equity concerns, some of these suggestions were incorporated into analysis plans for Block 2 of this study. Community input also motivated several specific modifications to the Block 1 procedures, including waypoint relocation to maximize potential noise benefits for communities near proposed flight tracks. Community concerns were also communicated through meetings with public officials and political representatives at the state and federal level.
Operators were engaged in this project through several meetings with airline technical pilots and the trade association Airlines for America (A4A). These pilots represented air carriers with significant operational footprints at BOS. The meetings provided feedback on potential operational constraints from the airline perspective including safety concerns arising from specific procedure proposals (including steep approaches, two-segment steep approaches, and speed management on departure). Preliminary versions of certain Block 1 candidate procedures were also test-flown in a full-motion Boeing 767 simulator by technical pilots from a major US airline. This test was intended to provide insight on basic feasibility and flyability of the proposed procedures. No flyability concerns were found based on these informal simulator trials of the Block 1 procedures, although official and detailed procedure design and evaluation is still required to confirm the qualitative preliminary findings.
Regulators and air traffic controllers were also engaged throughout the process. Representatives from the FAA Air Traffic Organization (ATO) were consulted to gain insight and understanding of air traffic control procedures, airspace layouts, standard operating procedures, and potential ATC-related constraints to procedure modification. Meetings with ATC included representatives from the Boston Tower, Boston Terminal Radar Approach Control, Boston Air Route Traffic Control Center, FAA New England Regional Office, the National Air Traffic Controllers Association (NATCA), and FAA headquarters. In addition to ATC, additional FAA engagement included meetings with the following offices: Environment and Energy, ATO Mission Support Services, Flight Standards, Airport Planning and Programming, and NextGen.
E.
Noise Modeling and Analysis
Candidate procedures were evaluated using two noise models. The NASA Aircraft Noise Prediction Program (ANOPP) was used for procedures where aircraft speed and/or configuration played a key role in projected noise benefits. The FAA Aviation Environmental Design Tool (AEDT) was used for procedures where the primary noise benefit arises from modified track definitions. This is because AEDT does not fully account for airframe noise changes arising from speed and configuration changes. Noise levels were computed on a 0.1 nautical mile square grid for all desired noise metrics. For calculating population exposure, block-level data from the 2010 US Census was re-gridded onto a 60 nautical mile square grid centered at BOS.
Analysis was performed for three aircraft types representative of the fleet mix at BOS: the Boeing 737-800 (single-aisle, medium range), Boeing 777-300 (twin-aisle, long range), and Embraer 170 (regional jet, short range). Results for all three types are presented in this report for procedures where aircraft-specific configuration and performance plays a key role. For all other procedures, results for the 737-800 alone are shown. This aircraft is representative of narrowbody twin-engine aircraft types that comprise the majority of operations at BOS. In terms of flight profile definitions, each departure procedure was modeled at 90% of maximum takeoff weight (MTOW) and each arrival procedure was modeled at 75% MTOW. For departures, the baseline vertical profile and thrust levels were derived from the median of historical radar tracks. For arrivals, the baseline vertical profile was a 3° glideslope. In both cases, the thrust profile was derived from historical radar tracks and a force-balance kinematics model. This thrust calculation method used aerodynamic data (lift and drag coefficients) calculated using the Eurocontrol Base
of Aircraft Data 4 (BADA-4). The noise analysis tools and methods used in this study are described in greater detail in Appendix A.
F.
Metrics Used for Procedure Evaluation
All noise analyses for the Block 1 procedure concepts were performed on a single-event basis. The objective was to evaluate the noise reduction potential for each individual operation rather than integrated impacts. Noise contours and corresponding population exposures were calculated for the maximum noise level (LMAX) and Sound Exposure Level (SEL) metrics. LMAX
describes the loudest absolute sound level generated during an overflight, regardless of the duration of the noise event. SEL accounts for the duration of an event.8 Both LMAX and SEL
showed noise benefits for each Block 1 recommendation presented in this report. For simplicity, only LMAX results are presented in the main body of this report. Additional details about the
single-event noise metrics used for this study are provided in Appendix B. SEL contours and population exposure values are provided in Appendix C for completeness.
III.
Block 1 Procedure Recommendations
The Block 1 recommendations identified and presented below are intended to: 1. Provide noise benefits in terms of absolute population exposure
2. Generate no significant equity issues in terms of noise redistribution between communities
3. Impose minimal operational, technical, or implementation barriers
In the process of evaluating flight tracks, complaints, and community feedback, several communities were identified where noise impacts were clearly evident but no procedures were identified consistent with Block 1 criteria. Arrival and departure procedures for such communities will be considered under Block 2. The specific procedures recommended under Block 1 are listed in Table 1 and are expanded upon in this section of the report.
Table 1. Block 1 Procedure Recommendations Proc. ID
D = Dep. A = Arr.
Procedure Primary Benefits
1-D1 Restrict target climb speed for jet departures from Runways 33L and 27 to 220 knots or minimum safe airspeed in clean configuration, whichever is higher.
Reduced airframe and total noise during climb below 10,000 ft (beyond immediate airport vicinity)
1-D2 Modify RNAV SID from Runway 15R to move tracks further to the north away from populated areas.
Departure flight paths moved north away from Hull
1-D3 Modify RNAV SID from Runway 22L and 22R to initiate turns sooner after takeoff and move tracks further to the north away from populated areas.
Departure flight paths moved north away from Hull and South Boston
1-D3a Option A: Climb to intercept course (VI-CF)
procedure
1-D3b Option B: Climb to altitude, then direct (VA-DF)
procedure
1-D3c Option C: Heading-based procedure
1-A1 Implement an overwater RNAV approach
procedure with RNP overlay to Runway 33L that follows the ground track of the jetBlue RNAV Visual procedure as closely as possible.
Arrival flight paths moved overwater instead of over the Hull peninsula and points further south
1-A1a Option A: Published instrument approach
procedure
1-A1b Option B: Public distribution of RNAV Visual
A.
1-D1: Runway 33L and 27 Reduced Speed Departures
Restrict target climb speed for jet departures from Runways 33L and 27 to 220 knots or minimum safe airspeed in clean configuration, whichever is higher.
1. Summary
Typical jet aircraft departures involve an acceleration to 250 knots shortly after takeoff. At this speed, the NASA ANOPP noise model indicates that, for modern aircraft, airframe noise dominates engine noise. By reducing departure climb speed to a level where airframe noise is similar to engine noise, total source noise can be minimized. ANOPP results indicate that the airframe/engine noise equivalence speed is in the vicinity of 220 knots for most jet aircraft. It is recommended that a speed constraint of 220 knots be assigned to all jet departures. For aircraft not capable of safe operation at 220 knots in a clean configuration, the minimum safe airspeed may be used.
The specific noise benefits and population exposure reduction presented in this report are based on NASA ANOPP modeled results. These results are consistent with the best publicly-available noise analysis data and methods. It may be valuable to conduct initial flight tests or operational trials to provide empirical validation of modeled results. However, the physical drivers of speed-based noise reduction are clear, so implementation of this recommendation is expected to have a beneficial impact regardless of model fidelity.
2. Technical Basis for Recommendation
Aircraft noise is generated by a combination of engine and airframe sources. Improvements in materials and engine design over the past several decades have significantly reduced engine noise. In older generations of aircraft, engines were the dominant noise source during departure. As engine noise has decreased, airframe noise has become more perceptible from the ground. Airframe noise arises due to turbulence in the airflow around components such as flaps and landing gear. Airframe noise is highly dependent on aircraft speed, with higher speeds resulting in higher noise levels. Airframe noise also increases when flaps are extended, speed brakes are used, and/or the landing gear is deployed.9
In a typical jet departure, the aircraft accelerates on the runway and performs its initial climb segment at a predetermined takeoff thrust. The initial thrust level may vary based on aircraft weight, runway length, weather conditions, and other variables. During this initial segment, the aircraft climbs at an initial climb speed dependent on aircraft weight. Upon reaching a transition altitude, typically between 1,000 ft and 1,500 ft, the thrust is reduced to a climb setting and the aircraft accelerates to a target climb speed. The target climb speed is typically 250 knots, which is the maximum speed permitted below 10,000 ft in the United States. As the aircraft accelerates, the flaps are incrementally retracted until the wing is in its clean configuration.10 Figure 4 shows a schematic of a typical departure profile.
Figure 4. Standard jet departure profile (figure source unknown)
Noise model results indicate a strong interaction between aircraft speed and airframe noise. To demonstrate this effect, the departure profile shown in Figure 4 was modeled with a variable target climb speed ranging from 160 knots to 250 knots. For modeling purposes, thrust levels were held constant for each departure speed. Flaps were assumed to be configured as required for the target speed.
LMAX noise contours for the variable-speed departure profiles for a Boeing 737-800 are
shown in Figure 5, illustrating the contribution of engine and airframe sources to the total noise contour at a range of climb speeds. At 160 knots, noise is dominated by engine sources. As the target climb speed increases, airframe noise becomes more pronounced. At 220 knots, engine and airframe noise sources are similar under the departure path. At 250 knots, airframe noise is the dominant source. The transition from engine-dominated to airframe-dominated noise occurs in the range of 210 knots to 230 knots for each of three aircraft types examined in this analysis (Boeing 737-800, Boeing 777-300, and Embraer 170).
Figure 5. LMAX noise contours for a 737-800 departure with target climb speeds varying from 160 knots to 250
knots.
For an aircraft operating in the airframe-dominated noise regime, speed reduction results in a reduction of total noise. This presents an opportunity to reduce total noise for departing jet aircraft by setting a target climb speed that is lower than 250 knots, ideally near the transition speed where airframe and engine noise sources are of similar magnitude. Climbing near this transition speed provides the majority of the noise reduction benefit from reduced airframe source while minimizing operational impact.
The benefits from reducing departure speed occur from the initial climb thrust cutback point approximately 5 miles from departure to the point where the aircraft reaches 10,000 ft. This noise reduction occurs primarily underneath the centerline of the departure flight track, which is where the RNAV track concentration effects are most pronounced.
3. Track Density Plots
Runway 33L and 27 are the two departure runways at BOS where the climb segment below 10,000 ft occurs primarily over land. Therefore, this procedure recommendation focuses on those runways. Figure 6 shows jet track concentration for departures from Runway 33L before and after implementation of RNAV procedures (2010-2015). Figure 7 shows the same data for Runway 27. In both cases, increased concentration is evident after the implementation of RNAV procedures, especially for communities more than 5 nautical miles away from the airport where tracks were historically dispersed.
Reduced speed departures would serve as an initial step to provide noise relief to those underneath the centerline of departure corridors by reducing the noise associated with each
60 60 60 60 65 65 65 70 70 60 60 60 60 65 65 65 70 70 60 60 65 70 160 KTS Climb Speed Flight Direction -2 0 2 4 6 8 10 12 -2 -1 0 1 2 y Distance (nmi) Total Engine Airframe 60 60 60 60 65 65 65 70 70 60 60 60 60 65 65 65 70 70 60 60 60 65 6570 190 KTS Climb Speed Flight Direction -2 0 2 4 6 8 10 12 -2 -1 0 1 2 Total Engine Airframe 60 60 60 60 65 65 65 70 70 60 60 60 60 65 65 65 70 70 60 60 60 65 65 70 220 KTS Climb Speed Flight Direction -2 0 2 4 6 8 10 12 x Distance (nmi) -2 -1 0 1 2 y Distance (nmi) Total Engine Airframe
Boeing 737-800 Departure LAMAX Contours with Variations in Climb Speed
60 60 60 60 60 65 65 65 70 70 60 60 60 60 65 65 65 70 70 60 60 60 60 65 65 65 70 250 KTS Climb Speed Flight Direction -2 0 2 4 6 8 10 12 x Distance (nmi) -2 -1 0 1 2 Total Engine Airframe
overflight. Any further procedure modification requiring reallocation of traffic or movement of tracks over other communities does not meet the criteria for Block 1 recommendation (see Section C on page 12).
Runway 33L Departures
2010 2015
2010: 25,046 Total Flights – 69/Day 2015: 24,055 Total Flights – 66/Day
Figure 6. Comparison between flight track density from Runway 33L jet departures between 2010 and 2015
Runway 27 Departures
2010 2015
2010: 14,681 Total Flights – 40/Day 2015: 19,090 Total Flights – 52/Day
Figure 7. Comparison between flight track density from Runway 27 jet departures between 2010 and 2015
4. Procedure Recommendation Details
Based on modeling results, it is recommended that speed reductions be implemented for jet departures from runways 33L and 27 at BOS. This is expected to reduce noise over populated
areas under the centerline of published departure procedures away from the immediate airport vicinity. This speed reduction could be accomplished through multiple operational strategies, including ATC clearances or modification to published procedures.
The objective of this recommendation is to reduce target climb speed to a value where airframe and engine noise are roughly equivalent in the clean configuration (flaps up). In order to simplify air traffic management and sequencing, it is recommended that the same speed constraint be applied to all departing jet traffic. Noise model results indicate that the airframe/engine noise equivalence speed is in the vicinity of 220 knots for most jet aircraft. Therefore, this procedure consists of modifying the standard departure profile illustrated in Figure 4 with a reduced target climb speed of 220 knots.
Not all aircraft types are capable of operating safely at 220 knots in a clean configuration. There is precedence for safety-based exceptions to speed constraints in the Federal Aviation Regulations under 14 C.F.R. §91.117(d), which state that an aircraft may use the minimum safe airspeed for any particular operation if that speed is greater than the prescribed legal limit. In practice, this would result in certain aircraft types exceeding the 220 knot limitation. This is driven by multiple factors including aircraft weight and wing design. Analysis of the 2015/2016 fleet mix at BOS indicates that 6.9% of departures would likely need to fly at a minimum safe climb speed higher than 220 knots. The need to fly faster than 220 knots would be determined by airline procedures based on aircraft type, weight, and flight conditions. Traffic spacing would be managed by air traffic controllers using the same techniques currently applied to aircraft operating at different speeds.
In order to observe benefits for outlying communities under the departure flight path, the reduced speed must be maintained until an altitude where noise levels are below an acceptable threshold. Based on noise modeling for the 737-800, 777-300, and E-170, an acceleration altitude of 10,000 ft. captures the noise reduction benefit for both heavy and light aircraft. An acceleration altitude of 6,000 ft. was found to retain the population exposure benefits for light aircraft but significantly reduce benefits for heavy aircraft (which typically generate more source noise and climb at a shallower gradient). Therefore, it is recommended to implement the speed restriction to 10,000 ft. to maximize population exposure benefits from the procedure.
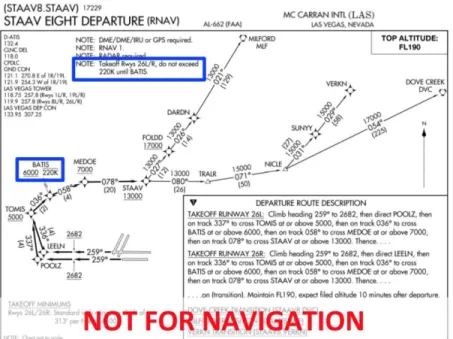
In terms of implementation strategy, the procedure modification could be accomplished through a notation on existing SIDs or through explicit air traffic controller instructions for departing aircraft. There is precedent for published speed restrictions of 220 knots on existing SIDs elsewhere in the NAS, such as the STAAV Eight RNAV Departure from Las Vegas McCarran airport shown in Figure 8. These restrictions are typically motivated by procedure design constraints assuming worst-case wind conditions. However, similar constraints could be applied for noise mitigation reasons. For rapid implementation (or implementation on a trial basis), the speed constraint could be assigned by the tower controller as part of the takeoff clearance or the departure controller as part of the initial climb clearance.
Figure 8. STAAV Eight RNAV SID at Las Vegas McCarran airport with 220 knot speed restriction before BATIS waypoint
5. Noise Modeling Results and Population Exposure
Noise was modeled for the proposed reduced speed departure procedures using the NASA ANOPP model described in Appendix A. In order to evaluate population impact for a single representative departure, each of these aircraft was modeled on the “BLZZR Four” RNAV standard instrument departure (SID) from Runways 33L and 27, a typical route used for departures to southwesterly destinations such as Atlanta and Dallas. For a procedure baseline, the analysis uses a standard departure profile with a 250-knot target climb speed and a vertical profile derived from median radar data for that aircraft type and runway. The thrust cutback altitude for the baseline procedure and all modified procedure was also based on this historical data.
For all aircraft types, the contour geometry is unchanged in the immediate vicinity of the airport. Contour contraction occurs approximately five to thirty miles from the departure end of the runway where unrestricted departures would have already accelerated beyond 220 knots. This corresponds to regions of concern for RNAV track concentration. Figure 9 shows single-event noise contours (LMAX) and population exposure results for the 737-800 in a clean
configuration with a target climb speed of 220 knots. Figure 10 shows similar results for the 777-300, although the target climb speed was limited to 240 knots due to minimum speed constraints for that aircraft type. Figure 11 shows contours for the E-170 with a target climb speed of 220 knots. Figure 12 shows contours for 737-800 with a target climb speed of 220 knots from runway 27. According to these modeled results, all three aircraft types show noise reduction due to reduced speed departures. Large population exposure reductions are evident, particularly at the 65 dB level and below. Specific reductions depend on the underlying population density which varies by departure runway and procedure. For both runways, areas of noise reduction occur in locations under the departure procedure centerline corresponding to areas of frequent community noise complaints. No communities experience an increase in noise as a result of reduced speed departures.
LA,MAX Population Exposure 60dB 65dB 70dB
Baseline 187,106 69,266 25,904
Proc. 1-D1a 162,558 53,905 25,691
Decrease 24,548 15,361 213
Figure 9. Noise exposure reduction for the Boeing 737-800 departing runway 33L via the BLZZR4 departure on a standard climb profile compared to a 220-knot reduced speed departure. Noise Model: NASA ANOPP
LA,MAX Population Exposure 60dB 65dB 70dB
Baseline 384,953 197,874 70,839
Proc. 1-D1a 378,425 192,907 69,932
Decrease 6,528 4,967 907
Figure 10. Noise exposure reduction for the Boeing 777-300 departing runway 33L via the BLZZR4 departure on a standard climb profile compared to a 240-knot reduced speed departure. Noise Model: NASA ANOPP
LA,MAX Population Exposure 60dB 65dB 70dB
Baseline 106,870 30,625 4,495
Proc. 1-D1a 70,310 27,096 4,495
Decrease 36,560 3,529 0
Figure 11. Noise exposure reduction for the Embraer E-170 departing runway 33L via the BLZZR4 departure on a standard climb profile compared to a 220-knot reduced speed departure. Noise Model: NASA ANOPP
LA,MAX Population Exposure 60dB 65dB 70dB
Baseline 178,973 58,925 11,624
Proc. 1-D1a 169,397 54,931 9,162
Decrease 9,576 3,994 2,462
Figure 12. Noise exposure reduction for the Boeing 737-800 departing runway 27 via the BLZZR4 departure on a standard climb profile compared to a 220-knot reduced speed departure. Noise Model: NASA ANOPP
6. Potential Barriers to Implementation
Three potential barriers to entry were identified in consultation with operational stakeholders:
• Fuel burn and flight time increase
• Potential runway throughput reduction
• Limitations on aerodynamic maneuvering margins at 220 knots
Each of these potential barriers to entry was evaluated as part of the study and found not to pose an unmanageable issue. Details of each potential barrier are provided below.
a) Fuel Burn and Flight Time
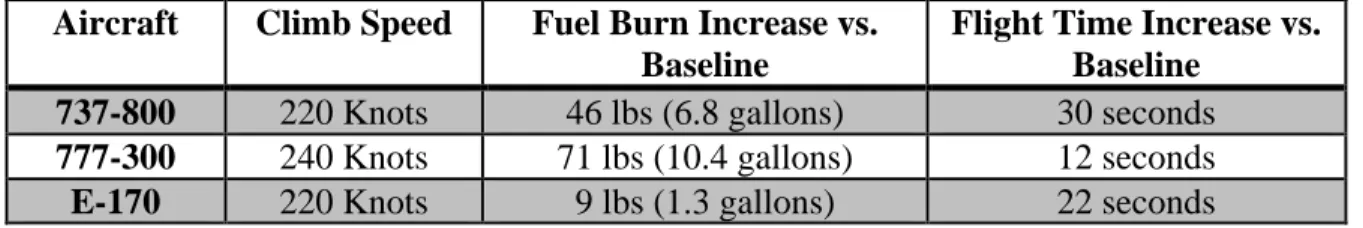
Performance modeling of reduced-speed climbs was conducted using the Eurocontrol BADA-4 model and indicates a slight fuel burn and flight time penalty from the procedure. This is because the aircraft are require to cover the baseline track distance at a slower speed. Naturally, this results in a slight time increase. Fuel burn also increases slightly for each aircraft type examined in this study, which can be attributed to the increased flight time as well as slightly lower aerodynamic efficiency at reduced speeds. Table 2 shows the fuel burn and time impact for representative reduced-speed departures with an acceleration altitude of 10,000 ft. These relatively small values (under 11 gallons of fuel and 30 seconds of flight time) are not considered significant and are smaller than penalties for other common noise abatement procedures .
Table 2. Fuel consumption and flight time implications from reduced speed climb procedures
Aircraft Climb Speed Fuel Burn Increase vs. Baseline
Flight Time Increase vs. Baseline
737-800 220 Knots 46 lbs (6.8 gallons) 30 seconds
777-300 240 Knots 71 lbs (10.4 gallons) 12 seconds
E-170 220 Knots 9 lbs (1.3 gallons) 22 seconds
b) Departure Sequencing and Runway Throughput
When tower controllers release aircraft for takeoff, they commonly assume that the leading aircraft will accelerate and take this into consideration when determining the departure release time for the trailing aircraft. Airborne aircraft are subject to minimum separation requirements. In general, aircraft must be separated by 3 nautical miles horizontally and/or 1,000 ft. vertically or placed on divergent headings. Detailed separation requirements are specified in FAA Joint Order 7110.65X11. For the purpose of departure metering, air traffic controllers must provide a sufficient time interval between takeoff clearances to ensure 3 nautical mile separation between leading and trailing aircraft after the trailing aircraft becomes airborne and throughout the departure procedure. Imposing reduced speed constraints on departing aircraft has the potential to impact the required interval between takeoff clearances.
In order to evaluate potential throughput implications of reduced speed departures, historical radar tracks from the Airport Surface Detection Equipment X (ASDE-X) were analyzed. This system logs aircraft position, altitude, and speed in 1-second intervals within
10-12 nautical miles of the airport. The analysis data set consisted of 2015 and 2016 departures from Runways 33L and 27 at BOS, for a total of 27,713 operations. Each pair of sequential departures in this set was analyzed on a second-by-second basis using the baseline (as-flown) speed profile as well as a modified speed profile limited to 220 knots or the minimum safe airspeed for the respective aircraft type, whichever was greater. In the reduced speed scenario, the start of takeoff roll time was maintained at the baseline value. Minimum horizontal separation was determined on a second-by-second basis for both the baseline and modified scenarios.
The historical radar data analysis showed minimal throughput implications for the proposed reduced speed departure procedure. 54 departure pairs that had maintained 3 nautical mile separation in the baseline case would have violated that horizontal spacing after the imposition of reduced speeds if no adjustments to release time occurred. This corresponds to 1 departure out of every 513 that would have required air traffic control action different from what occurred in the 2015-2016 timeframe. The departure release delay required to remove these conflicts was small, with a median delay of 1.1 seconds. Therefore, the potential departure sequencing and runway throughput impact of reduced speed departures is expected to be small and manageable by air traffic controllers without requiring significant changes in standard operating practices.
c) Slow-Speed Maneuvering
Some aircraft types cannot operate with adequate maneuvering margins at 220 knots in a clean configuration at high takeoff weights. This is addressed through a provision for minimum safe airspeed in lieu of the 220 knot restriction for aircraft with such constraints. For the majority of the fleet mix at BOS, the 220 knot recommendation is safely flyable in the clean configuration at normal weights. However, airline policy and pilot discretion can guide the use of alternative minimum safe airspeed on a case-by-case basis. This allows sufficient flexibility to pilots and air traffic controllers to implement the noise-driven departure modification without compromising safety.
The recommendation also calls for minimum safe airspeed in the clean configuration rather than with flaps or slats extended. This reduces noise from flap gaps and edges, fatigue on structural components, and potential issues with extended high-lift devices in icing conditions. It also minimizes the fuel burn penalty associated with the recommended procedure. Therefore, concerns regarding flaps-extended climbs have been minimized to the extent possible in this recommendation.
B.
1-D2: Runway 15R RNAV Waypoint Relocation
Modify RNAV SID from Runway 15R to move tracks further to the north away from populated areas.
1. Summary
Turbojet departures from Runway 15R currently climb on runway heading before proceeding to an RNAV waypoint located 0.46 nautical miles north of Hull. This waypoint location concentrates overflights near a populated area rather than further to the north over Boston Harbor. It is recommended that the initial segment of the standard RNAV SID departure be redesigned to remain farther north, maximizing overflight of Boston Harbor rather than the Hull Peninsula.
2. Track Density Plots
Figure 13 shows jet track concentration for departures from Runway 15R before and after implementation of RNAV procedures (2010-2015). It is clear from the figure that the departure tracks became more concentrated after RNAV implementation and that the centroid of the departure corridor shifted south toward Hull. It is desirable to retain the benefits of RNAV technology while returning the departure flight path from Runway 15R closer to its pre-RNAV centroid over Boston Harbor.
Runway 15R Departures
2010 2015
2010: 11,227 Total Flights – 31/Day 2015: 8,348 Total Flights – 23/Day
Figure 13. Comparison between flight track density from Runway 15R jet departures between 2010 and 2015
3. Procedure Recommendation Details
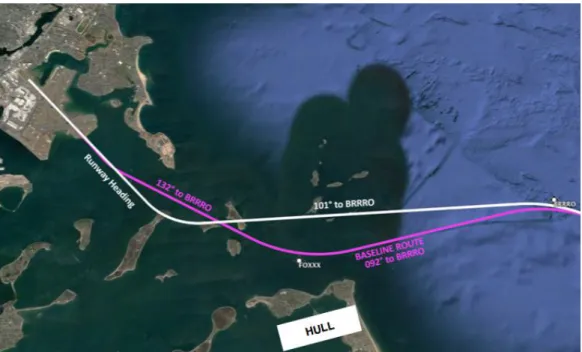
Turbojet departures from Runway 15R currently climb on runway heading to intercept course 131° to the FOXXX waypoint located 0.46 nautical miles north of the Hull Peninsula, then eastbound on course 091° to the BRRRO waypoint 4 nautical miles offshore in Massachusetts Bay before diverging onto the various departure procedure tracks. Because Hull is
impacted by departures and arrivals from multiple runways at BOS, it is desirable to move the published RNAV procedures as far overwater to the north as possible to provide relief. While a specific procedure definition is recommended in this report, any modification that shifts the centerline further north over Boston Harbor would accomplish the underlying objective of this recommendation. Figure 14 shows the recommended procedure modification, bypassing the FOXXX waypoint and proceeding directly to BRRRO as close as possible to the center of Boston Harbor.
Figure 14. Procedure illustration for a 15R departure climbing via the BLZZR4 departure (baseline) compared to procedure 1-D2
This recommendation is intended to comply with existing RNAV SID design constraints. Bypassing the FOXXX waypoint reduces noise in Hull while maintaining the basic structure of the baseline procedure (a climb on runway heading to intercept a course to a specific waypoint, or “VI-CF” type procedure). Waypoint coordinates are provided in Table 3, corresponding to the white line shown in Figure 14. All waypoints are designated as flyby rather than flyover.
Table 3. Waypoint locations and leg type definitions for procedure recommendation 1-D2
Leg Number
Leg Definition From To Notes
1 Climb to Intercept (VI)
Runway Heading (approx. 150°)
RW15R 42°22'27.25"N 71°01'04.35"W
Turn Point (Approx.) 42°19'35.04"N 70°57'14.03"W
Precise intercept location may vary based on initial heading and other factors
2 Course to Fix (CF)
Course 101° to BRRRO
Turn Point (Approx.) 42°19'35.04"N 70°57'14.03"W
BRRRO 42°20’00.78"N 70°48’05.48"W
3+ As defined in baseline BRRRO
42°20’00.78"N 70°48’05.48"W
As Defined Remainder of existing
RNAV SID definitions unchanged
4. Noise Modeling Results and Population Exposure
Noise was modeled for the proposed waypoint relocation using the AEDT model described in Appendix A. Analysis was performed for the Boeing 737-800. The “BLZZR Four” RNAV SID from Runways 15R was modeled for the purpose of this report, although each of the published SIDs uses the same initial segment definition in the vicinity of interest near Hull. The baseline procedure was a standard departure profile with a 250-knot target climb speed and a vertical profile derived from median radar data for that aircraft type and runway.
Figure 15 shows single-event LMAX contours and the population exposure reduction over
the Hull Peninsula for a Boeing 737-800 following procedure 1-D2 as illustrated in Figure 14. No communities are exposed to new noise as a result of this recommended modification.
LA,MAX Population Exposure 60dB 65dB 70dB
Baseline 5,372 299 116
Proc. 1-D2 4,058 288 116
Decrease 1,314 11 0
Figure 15. Noise exposure reduction for the Boeing 737-800 departing runway 15R climbing via the BLZZR4 departure on an AEDT-standard climb profile compared to procedure 1-D2
5. Potential Barriers to Implementation
No significant barriers to entry are anticipated for this procedure recommendation. The procedure involves a minimal track length reduction relative to the baseline procedure. Compliance with procedure design criteria will require final verification in TARGETS. Additionally, the presence of Boston Harbor under and to the north of the existing departure corridor provides substantial flexibility to modify detailed aspects of this recommended procedure if needed while maintaining the overall objective of noise reduction in Hull.
C.
1-D3: Runway 22L and 22R RNAV Waypoint Relocation
Modify RNAV SID from Runway 22L and 22R to initiate turns sooner after takeoff and move tracks further to the north away from populated areas.
Option A: Climb to intercept course (VI-CF) procedure Option B: Climb to altitude, then direct (VA-DF) procedure Option C: Heading-based procedure
1. Summary
Turbojet departures from Runway 22L and 22R currently climb on runway heading to a specified point before making a left turn overwater towards a waypoint three miles to the southeast. At that waypoint, the departures turn eastbound toward Massachusetts Bay along an RNAV procedure segment that is offset from Hull by less less than 0.5 nautical miles. This RNAV segment concentrates overflights near a populated area rather than further to the north over Boston Harbor. It is recommended that the segment of the standard RNAV SID near Hull be redesigned to remain farther north, maximizing overflight of Boston Harbor rather than the Hull Peninsula. In addition, it is recommended that procedure definition be modified to initiate the overwater turn as early as practical after takeoff to reduce noise in South Boston.
2. Track Density Plots
Figure 16 shows jet track concentration for departures from Runway 22R before and after implementation of RNAV procedures (2010-2015). Similar to the Runway 15R departures, the departure tracks became more concentrated after RNAV implementation and the centroid of the departure corridor shifted south toward Hull. In addition, some aircraft appear to have initiated the initial turn after takeoff sooner prior to RNAV implementation. It is desirable to retain the benefits of RNAV technology while returning the departure flight path from Runway 22R closer to its pre-RNAV state, including an earlier turn after takeoff and centroid further north over Boston Harbor.
Runway 22R Departures
2010 2015
2010: 46,446 Total Flights – 127/Day 2015: 49,911 Total Flights – 137/Day
3. Procedure Recommendation Details
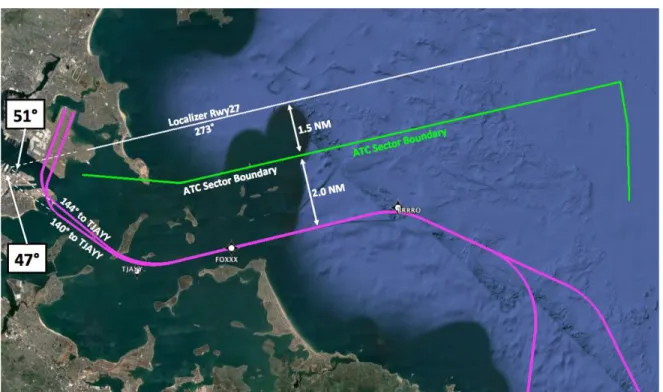
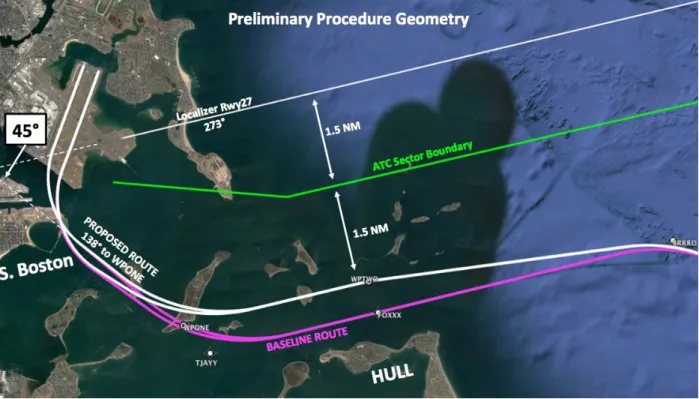
Turbojet departures from Runway 22L and 22R currently climb on runway heading to intercept course 139° or 143° (respectively) to the TJAYY waypoint located in Boston Harbor, then eastbound on course 091° to the BRRRO waypoint 4 nautical miles offshore in Massachusetts Bay before diverging onto the various departure procedure tracks. The preliminary turn to TJAYY is intended to reduce overflights of South Boston, while the eastbound segment is intended to keep departure trajectories overwater until aircraft reach sufficient altitude to reduce noise. Figure 17 shows the baseline RNAV SID geometry for departures from Runway 22L and 22R in magenta. The figure also shows in white the final approach corridor for traffic landing on Runway 27 which must be separated from departure flows when both procedures are simultaneously in use. In this situation, separate air traffic control sectors generally handle arrivals and departures. The boundary between the arrival and departure sectors is shown in green.
Figure 17. Baseline procedure definitions for RNAV SIDs from Runway 22L and 22R (magenta) shown with ILS Localizer to Runway 27 (white) and the air traffic control sector boundary (green)
Two communities could benefit from implementation of modified departure procedures from Runway 22L and 22R. Earlier turns after takeoff could reduce overflight noise in South Boston, while waypoint relocation in the vicinity of Hull could move tracks further overwater and reduce impacts in that heavily-impacted community. Three specific procedure definition options are recommended in this report. Each of these options has unique benefits mechanisms as well as potential implementation barriers that may require evaluation and mitigation prior to implementation. Should revision of these recommendations be required prior to implementation, any modification that shifts the centerline of departures further north over Boston Harbor would accomplish the underlying objective of this recommendation. It is also desirable to enable earlier turns on departures through RNAV design or alternative methods.
a) 1-D3a: Runway 22L/R RNAV waypoint relocation (climb to intercept course)
Figure 18 shows the procedure recommendation 1-D3a (white line). This procedure variant uses the same leg types and geometry used in the current published departures, shifting the segment between TJAYY and FOXXX on the baseline procedure to the north. It retains the current turn location after takeoff.
Figure 18. Procedure illustration for a 22L/R departure climbing via the BLZZR4 departure (baseline) compared to procedure 1-D3a
Procedure 1-D1a maintains the existing leg type definition with modified waypoint location (a climb on runway heading to intercept a course to a specific waypoint, or “VI-CF” type procedure). The procedure is intended to maintain a 45° divergence angle between the initial departure flow from Runway 22R and the extended centerline of Runway 27 until 3 nautical miles of separation is achieved11. The waypoint locations were selected to maintain minimum separation with the ATC sector boundary (1.5 nautical miles) as well as to provide procedural separation of 3 nautical miles with the localizer to Runway 27. Waypoint coordinates are provided Table 4, corresponding to the white line shown in Figure 18. All waypoints are designated as flyby rather than flyover.
Table 4. Waypoint locations and leg type definitions for procedure recommendation 1-D3a (listed for Runway 22R departures only)
Leg Number
Leg Definition From To Notes
1 Climb to Intercept (VI)
Runway Heading (approx. 215°) RW22R 42°22'41.76"N 71°00'16.30"W Intercept Point 42°20'32.28"N 71°01'19.05"W (Approx.)
Precise intercept location may vary based on initial heading and other factors 2 Course to Fix (CF) Course 143° to WPONE Intercept Point 42°20'32.28"N 71°01'19.05"W (Approx.) WPONE 42°18'43.78"N 70°58'10.07"W 3 Direct to Fix (DF) WPONE
42°18'43.78"N 70°58'10.07"W
WPTWO 42°19'24.04"N 70°54'21.64"W 4 Direct to Fix (DF) WPTWO
42°19'24.04"N 70°54'21.64"W
BRRRO 42°20’00.78"N 70°48’05.48"W
5+ As defined in baseline BRRRO
42°20’00.78"N 70°48’05.48"W
As Defined Remainder of existing
RNAV SID definitions unchanged
b) 1-D3b: Runway 22L/R RNAV waypoint relocation (climb to altitude then direct)
Figure 19 shows the procedure recommendation 1-D3b (white lines). This procedure variant uses a modified procedure definition that allows for earlier turns after takeoff for certain steep climbing aircraft. The figure shows three possible ground tracks: the earliest turn represents a steep-climbing aircraft, the next turn represents a typical narrow-body departure, and the final track represents the latest permitted turn location based on minimum climb gradient (which would occur very rarely in actual operations). The majority of departures on this procedure would follow a ground track close to the middle trajectory (also used for noise modeling purposes in this study).
Figure 19. Procedure illustration for a 22R departure climbing via the BLZZR4 departure (baseline) compared to procedure 1-D3b
Procedure 1-D1b modifies the waypoint location in the vicinity of Hull and also changes the initial leg type to a climb on runway heading to an altitude threshold then direct to a specific waypoint (a “VA-DF” type procedure). Waypoint coordinates are provided in Table 5, corresponding to the set of white paths shown in Figure 19. No coordinates are provided for the expected turn point because of variability in climb rate between aircraft types.
Table 5. Waypoint locations and leg type definitions for procedure recommendation 1-D3b
Leg Number
Leg Definition From To Notes
1 Climb to Intercept (VA) Runway Heading (approx. 215°) to 500’ AGL RW22R 42°22'41.76"N 71°00'16.30"W Point Reaching 500’ AGL
Turn location may vary based on aircraft climb gradient, autopilot
engagement delay, or other factors 2 Direct to Fix (DF) Direct WPTWO Point Reaching 500’ AGL WPTWO 42°19'24.04"N 70°54'21.64"W 3 Direct to Fix (DF) WPTWO
42°19'24.04"N 70°54'21.64"W
BRRRO 42°20’00.78"N 70°48’05.48"W
4+ As defined in baseline BRRRO
42°20’00.78"N 70°48’05.48"W
As Defined Remainder of existing
RNAV SID definitions unchanged
c) 1-D3c: Runway 22L/R heading-based departure when Runway 27 arrivals not in use
Figure 20 shows the procedure recommendation 1-D3c (white line). In this procedure, the local tower controller would issue a heading of 100° at the time of takeoff clearance. Aircraft would have the flexibility to commence the turn based on pilot discretion and company policy, likely allowing earlier turns than the current RNAV engagement altitude between 400 and 500 ft above ground level. Once clear of population-sensitive areas, the aircraft may continue on ATC vectors or be cleared to a downstream fix on a published RNAV SID. This procedure is only possible when Runway 27 is not in use for arrivals.
Recommendation 1-D3c is not mutually exclusive from 1-D3a and 1-D3b. When Runway 27 arrivals are in use, one of the other options would be required to provide separation. This heading-only procedure places departures over the center of Boston Harbor and has the largest noise benefit of the three recommendation options. It would have a positive impact on surrounding communities if implemented when traffic conditions allow.
Figure 20. Procedure illustration for a 22R departure climbing via the BLZZR4 departure (baseline) compared to procedure 1-D3c
Procedure 1-D3c involves ATC vectors after takeoff to join existing departure streams, so no additional RNAV waypoint definitions or leg types must be specified.
4. Noise Modeling Results and Population Exposure
Noise was modeled for the three procedure recommendation options using the AEDT model described in Appendix A. Analysis was performed for the Boeing 737-800. The “BLZZR Four” RNAV SID from Runways 22R was modeled for the purpose of this report. Similar to the Runway 15R recommendation, each of the published SIDs from runway 22L and 22R uses the same initial segment definition in the vicinity of interest near Hull, so the same noise results are applicable for all jet departures regardless of SID assignment. The baseline procedure was a
standard departure profile with a 250-knot target climb speed and a vertical profile derived from median radar data for that aircraft type and runway.
Figure 21 shows single-event LMAX contours and population exposure reduction results
for a Boeing 737-800 following procedure 1-D3a as illustrated in Figure 18. The primary noise benefit occurs at the 60 dB level in the vicinity of Hull. No communities are exposed to new noise as a result of this recommended modification. However, this procedure does not change the turn altitude after takeoff, so no noise benefits are realized in South Boston under this version of the recommendation.
LA,MAX Population Exposure 60dB 65dB 70dB
Baseline 17,630 4,541 549
Proc. 1-D3a 16,258 4,511 549
Decrease 1,372 30 0
Figure 21. Noise exposure reduction for the Boeing 737-800 departing runway 22R climbing via the BLZZR4 departure on an AEDT-standard climb profile compared to procedure 1-D3a
Figure 22 shows single-event LMAX contours and population exposure reduction results
for a Boeing 737-800 following procedure D3b as illustrated in Figure 19. As in procedure 1-D3a, no new communities are exposed to noise in this procedure. Noise benefits at the 60dB level in the vicinity of Hull are retained. Additionally, this procedure recommendation results in an earlier turn after takeoff relative to the baseline for most aircraft types. This provides additional noise benefits to South Boston under this version of the recommendation compared to 1-D3a.