HAL Id: hal-02818029
https://hal.inrae.fr/hal-02818029
Submitted on 6 Jun 2020HAL is a multi-disciplinary open access
archive for the deposit and dissemination of sci-entific research documents, whether they are pub-lished or not. The documents may come from teaching and research institutions in France or abroad, or from public or private research centers.
L’archive ouverte pluridisciplinaire HAL, est destinée au dépôt et à la diffusion de documents scientifiques de niveau recherche, publiés ou non, émanant des établissements d’enseignement et de recherche français ou étrangers, des laboratoires publics ou privés.
Rationales for the selection of the case studies
Sophie Drogue, Jean-Philippe Gervais
To cite this version:
Sophie Drogue, Jean-Philippe Gervais. Rationales for the selection of the case studies. [Other] 2010, 70 p. �hal-02818029�
Rationales for the selection of the case studies
2
Authors’ contact:
John Beghin
Iowa State University, USA
[email protected] Maria Cendon
INTA, Argentina
[email protected] Caesar Cororaton
Virginia Tech University, USA
[email protected] Sophie Drogué
INRA-AgroParisTech, France
[email protected] Marie-Hélène Felt
Université Laval, Canada
[email protected] Jean-Philippe Gervais
North Carolina State University, USA
[email protected] Graciela Ghezan INTA, Argentina [email protected] Estelle Gozlan INRA-AgroParisTech, France [email protected] Thomas Heckelei
University of Bonn, Germany
[email protected] Jikun Huang
Centre for Chinese Agricultural Policy, China
[email protected] Daniel Iglesias INTA, Argentina [email protected] Gabriela Iturrioz INTA, Argentina [email protected] Natalia Karlova
Institute for Agricultural Market Studies, Russia
Heloisa Lee Burnquist
ESALQ, University of Sao Paulo, Brazil
[email protected] Fukunari Kimura Japan [email protected] Bruno Larue
Université Laval, Canada
[email protected] Rajesh Mehta
Research and Information System for Developing Countries
[email protected] Mark Melatos
University of Sydney, Australia
[email protected] Luiza Meneguelli Fassarella
ESALQ, University of Sao Paulo, Brazil
Marian Mraz
Slovak Agricultural University of Nitra, Slovakia
[email protected] David Orden
Virginia Tech University, USA
[email protected] Tsunehiro Otsuki
Japan
Mauricio Jorge Pinto de Souza
ESALQ, University of Sao Paulo, Brazil
Jan Pokrivcak,
Slovak Agricultural University of Nitra, Slovakia
[email protected] Dmitri Rylko
Institute for Agricultural Market Studies, Russia
Simon Schlueter
University of Bonn, Germany
[email protected] Christine Wieck
University of Bonn, Germany
[email protected] Niven Winchester
University of Otago, New Zealand
[email protected] Jun Yang
Centre for Chinese Agricultural Policy, China
4
Contents
Contents ... 4
Tables and illustrations ... 6
Introduction... 8
1- Case studies on meat (HS Chapters 02 and 16)... 10
1.1 Argentina’s case study on beef (HS 0201, 0202) – D. Iglesias, G. Ghezan, M. Cendon and G. Iturrioz... 10
Objective and research questions... 12
Justification for the Argentina’s beef case study ... 12
Beef SPS measures ... 15
1.2 The Impact of Nontariff Measures on Imports of Pigmeat into Australia (HS0203) – M. Melatos, J. Beghin... 16
Objective and research questions... 16
Justification for the Australian case study ... 16
NTMs and Australian pigmeat imports... 17
1.3 Case study on poultry trade in Japan and Russia (HS 0207 and 1602 -31, -32, -39) – T. Heckelei, S. Schlueter and C. Wieck – F. Kimura and T. Otsuki... 20
Justification for the poultry trade case study ... 20
NTMs affecting poultry trade ... 21
Objective and research question ... 22
Food safety threat and Japanese SPS measures on poultry... 23
1.4 Rationale behind the selection of the poultry case study in China (HS 0207) – J. Yang and J. Huang ... 24
Justification for the Chinese case study ... 24
Objective and research question ... 26
1.5 India’s case study on poultry meat and eggs (HS 0207, 0407) – R. Mehta... 26
Objective and research question ... 28
1.6 Assessment of technical and sanitary norms and regulations upon poultry trade flows for the EU-27 and Brazil – H. Lee Burnquist, M.J. Pinto de Souza and L. Meneguelli Fassarella 28 Justification of the case study ... 28
Objective and research question ... 31
2 - Case studies on dairy (HS Chapter 04)... 33
2.1 The Impacts of Canadian Cheese Compositional Standards on the Competitiveness of Dairy Exporting Firms (HS 0406 -10, -20, -30, -40, -90) – J.P. Gervais, B. Larue and M-H. Felt ... 33
Objective and research question ... 33
Justification for the Canadian cheese case study ... 34
2.2 Case study on the United States cheese imports (HS 040690) – N. Winchester ... 38
Objective and research question ... 38
Justification for the USA cheese imports case study ... 39
2.3 Non tariff measures faced by the EU’s dairy exports to Russia (HS0401 to HS0406) – M. Mraz and J. Pokrivcak... 40
5
Justification for the Russian dairy case study ... 41
Dairy NTMs in Russia ... 42
2.4 Rationale behind the selection of the dairy case study in China... 42
Justification for the Chinese case study ... 42
Objective and research question ... 45
3 - Case studies on fruits and vegetables (HS Chapters 07 and 08) ... 46
3.1 Impact of NTMs on European apples (HS 0808) and tomatoes (HS0702) competitiveness on the Russian market – N. Karlova and D. Rylko... 46
Objective and research question ... 46
Justification for the Russian apples and tomatoes case study... 46
NTMs affecting Russian fruits and vegetables imports... 48
3.2 Technical Measures Affecting Spain’s Competitiveness in International Citrus Markets (HS 0805) – D. Orden and C. Cororaton ... 49
Objective and research question ... 49
Justification for the Spain’s citrus case study ... 50
SPS Issues in Citrus Trade of the United States ... 56
3.3 Argentina’s lemon case study (HS 080550) – D. Iglesias, G. Ghezan, M. Cendon and G. Iturrioz... 57
Objective and research question ... 57
Justification for the lemon case study... 58
Lemon’s SPS measures... 61
3.4 Case study on apples (0808) – S. Drogué and E. Gozlan ... 62
Objective and research question ... 62
Justification for the apples case study... 62
NTMs faced by the EU when exporting apples ... 63
6
Tables and illustrations
Figure 1 : Beef and veal importers (2000-2015, Incl. Live) ... 10
Figure 2 : Beef and veal exporters (2000-2015, Incl. Live)... 11
Figure 3 : Argentina’s beef trade cluster... 11
Figure 4 : EU beef imports projections by country... 12
Figure 5 : Main intra-Community beef providers (2008) ... 13
Figure 6 : Destinations of extra EU27 beef exports (fresh and chilled), 2008 ... 13
Figure 7 : Pigmeat imports into Australia... 18
Figure 8 : Us imports and exchange rate changes... 18
Figure 9 : Global exports of poultry meat (Chapter 02) in millions of US dollars, selected countries... 21
Figure 10 : Chinese agricultural trade 1992-2008 (in 2000 price)... 24
Figure 11 : China’s imports of poultry products (HS 0207) from the EU, 1992-2008 (2000 price) ... 26
Figure 12 : India’s share of agriculture and livestock in GDP ... 27
Figure 13 : India’s share of poultry in livestock sector ... 27
Figure 14 : Poultry exports and imports, by country 1000 tons... 29
Figure 15 : Total cheese imports (HS 0406) from May 2007 to April 2009 ... 36
Figure 16 : Total cheese imports from the European Union May 2007 to April 2009... 36
Figure 17 : Total cheese imports from the United States from May 2007 to April 2009... 37
Figure 18 : Value of EU27’s exports to Russia of dairy products (Chapter 04), millions euros.. 42
Figure 19 : Chinese agricultural trade 1992-2008 (in 2000 price)... 43
Figure 20 : China’s imports of dairy products (HS 0401 to 0406) from the EU, 1992-2008 (2000 price) ... 44
Figure 21 : Dynamics of vegetable imports to Russia ... 46
Figure 22 : Dynamics of fruits imports to Russia ... 47
Figure 23 : Structure of Russian imports of tomatoes by countries in % ... 47
Figure 24 : Structure of the Russian imports of apples by countries, %... 48
Figure 25 : International trade flows of citrus ... 51
Figure 26 : Argentina’s lemon trade cluster ... 58
Figure 27 : Share in the world production, processing and export of lemon by country (2000-2006), in %... 58
Figure 28 : Main importers of fresh lemon, 2008... 59
Figure 29 : Evolution of EU fresh lemon trade (tons, 2002-2008)... 59
Figure 30 : EU imports by country (2008)... 59
Figure 31: Evolution of fresh lemons exports by country (tons, 2002-2008)... 60
Figure 32 : Value of apples exports in US$ million, 2007, selected countries... 63
Figure 33 : Major EU’s destinations of apples exports, 2007... 63
Table 1 : Top 5 EU member states’ beef production, 1000 tons ... 12
Table 2 : Top 5 EU member states’ beef exports, 1000 tons... 14
Table 3 : Argentina’s beef market patterns... 14
Table 4: Argentina’s Beef exports by main destinations in 2009 (*). ... 15
7
Table 6 : Pork trade... 17
Table 7 : Specific trade concerns raised in the SPS Committee ... 21
Table 8 : Meat categories ... 23
Table 9 : China’s imported agricultural commodities top 15 in 2008 ... 25
Table 10 : Top 10 destinations of Brazil poultry exports, 2008 ... 30
Table 11 : Brazilian chicken exports by product (1000 tons), 2008... 30
Table 12 : Top 10 destination of EU’s poultry export, 2008 ... 31
Table 13 : European chicken exports by product (1000 tons), 2008 ... 31
Table 14 : Casein ratio derived from milk (over total content) ... 34
Table 15 : Top five cheese exporting countries in the Canadian market for 2008 ... 35
Table 16 : United States imports of dairy products (Chapter 04) and cheese (HS 040690), selected countries, in millions of US$, 2007. ... 38
Table 17 : EU dairy exports to non-EU nations by country, 2008 ... 39
Table 18 : EU dairy exports to non-EU nations by product, 2008 ... 40
Table 19 : China’s imported agricultural commodities top 15 in 2008 ... 44
Table 20 : World citrus production... 50
Table 21 : Spain exports of Citrus in 2005 ... 53
Table 22 : Spain imports of citrus in 2005... 53
Table 23 : Sources of United States imports of citrus fruits ... 55
Table 24 : Main markets for Argentina lemon exports... 60
Table 25 : Main markets for Spain lemon exports... 61 Table 26 : Summary table of proposed case studies ... Erreur ! Signet non défini.
8
Rationales for the selection of the case studies
Introduction
Non-tariff measures (NTMs) come under many different shapes and forms. While there is still a long way before trade liberalization in agri-food markets reduces the tariff barriers to the level observed in industrial sectors, bilateral and regional initiatives to lower import tariffs have certainly contributed to the growth in agri-food trade. At the same time, many countries are concerned that NTMs could be substituted for explicit tariff barriers in response to protectionist pressures. Conversely, NTMs can also play an important role in the current environment where evolving food preferences and technology contribute to increase segmentation of food markets in which consumers value food safety and their own footprint on the planet. In that regard, NTMs will impact the different stages of the agri-food supply chains in many different ways based on domestic market structure, exporters’ behavior and a host of different structural variables and parameters such as consumer preferences, policies, etc. The objective of Work Package #6 (WP6) of the NTM-Impact research project is to analyze the impact of NTMs on the relative competitiveness of the EU and selected trade partners at a highly disaggregated level. This exercise should allow us to capture many specific features of supply chains that would be absent at a more aggregated level.
The purpose of this working paper is to present a brief description of the various case studies that will be analyzed as part of WP6. Globally, the set of case studies focuses on product-trade clusters that have a particular economic interest to the EU: fruits and vegetables, meat and dairy. The selection of case studies is based on the important criterion that it must provide an analysis of the relative competitiveness of European exporters in one particular sector. Yet, the rationale behind the selection of the case studies can vary across and within a product-trade cluster. It can be based upon the product significance for EU stakeholders, import market significance for EU stakeholders, concerns that were raised in front of World Trade Organization (WTO)’s Dispute Settlement Body (DSB) or trade frictions officially expressed by European authorities, etc.
This document offers a review of the different case studies which are categorized in three clusters (dairy, meat, and fruits and vegetables). Research efforts targeted at the dairy sector involve:
• measuring the impacts of Canadian new compositional standards for cheese on the competitiveness of EU exports in relation to other exporting countries such as New Zealand and the U.S;
• estimating the tariff equivalent of U.S. NTMs on cheese imports from the EU, New Zealand;
• surveying dairy NTMs in Russia and computing their impact on EU exporters’ competitiveness;
9 • computing the trade impacts of dairy NTMs in China on European dairy exports.
The NTMs of the dairy case studies are quite different in both their scope and linkage to EU exports. Yet, the common thread between these case studies is the importance of the dairy export markets for the EU and the challenges noted by EU authorities and other exporting countries in these markets. Similar observations can be made for the two other trade cluster. The second product-trade cluster focuses on meat. Research efforts for this trade cluster include:
• an analysis of major exporters’ welfare following changes in sanitary and phytosanitary measures for beef, with a particular focus on Argentinean vs European firms;
• estimating trade impacts of various non-tariff measures imposed by Australia on its imports of pigmeat;
• an analysis of changes in poultry meat exporters’ welfare following changes in regulatory policy of Japan, Russia and China, India and other import markets
The third product-trade cluster is centered on fruits and vegetables. Research efforts related to this cluster include:
• assessing the impact of NTMs in the Russian market on the competitiveness of European exporters of fruit and vegetables;
• measuring the impacts of technical measures in world citrus markets affect the competitive position of Spain;
• analyzing the welfare effects of a change in EU and US SPS measures affecting lemon trade with a particular focus on Argentinean and European exporters;
• analyzing the effects of SPS and other NTMs related to apple trade on the competitiveness of European exporters
10
1- Case studies on meat (HS Chapters 02 and 16)
1.1 Argentina’s case study on beef (HS 0201, 0202) – D. Iglesias, G. Ghezan, M. Cendon and G. Iturrioz
Lately, the increase in trade flows in the global meat sector followed the changes in the pattern of trade in agrifood. Regarding beef, the increase in international trade flows accelerated in the late 1990s, despite recurrent episodes of foot-and-mouth disease (FMD) and Bovine Spongiform Encephalopathy (BSE). These events triggered new quality standards and sanitary measures for bovine products.
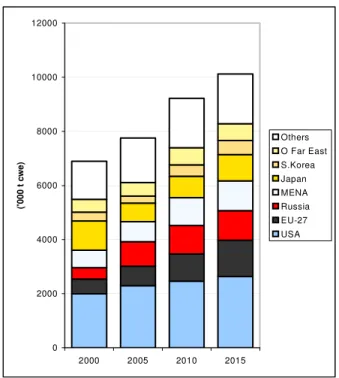
Today, the main producers and exporters are Brazil, Australia, Argentina, Canada, the EU, New Zealand, the United States and Uruguay. Recently, some of these countries such as Brazil and Australia managed to consolidate their leadership in the global beef market. The main importers are the United States, the EU, Russia, Japan, Korea and Mediterranean countries (Middle East and North Africa).
Figure 1 : Beef and veal importers (2000-2015, Incl. Live)
Source: GIRA 2008 0 2000 4000 6000 8000 10000 12000 2000 2005 2010 2015 (' 0 0 0 t c w e ) Others O Far East S.Korea Japan MENA Russia EU-27 USA
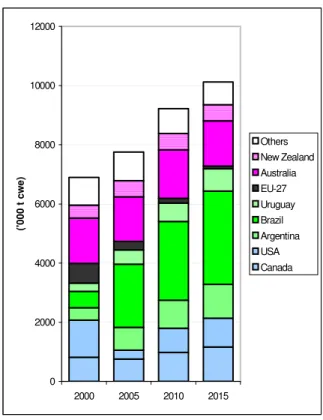
11 Figure 2 : Beef and veal exporters (2000-2015, Incl. Live)
Source: GIRA 2008
Figure 3 : Argentina’s beef trade cluster
EU Arg Ru 0 2000 4000 6000 8000 10000 12000 2000 2005 2010 2015 (' 0 0 0 t c w e ) Others New Zealand Australia EU-27 Uruguay Brazil Argentina USA Canada
12
Objective and research questions
The objective of this case study is to analyze how NTMs in beef markets affect the competitive position of Germany vis-à-vis Argentina in exporting frozen beef in the Russian market.
Particularly, the aim is to analyze the exporters’ welfare effects of a change in the importers’ regulatory policy with regard to Sanitary and Phytosanitary (SPS) beef requirements.
In the EU, Germany is one of the major producer of beef and the major exporter of frozen beef to Russia; and the Russian market is the major destination of Argentine beef export.
Justification for the Argentina’s beef case study
In the EU, the domestic production was almost 8 million tons of beef with bone in 2007 and would reach 7.6 million in 2012; France and Germany are the main producers.
Table 1 : Top 5 EU member states’ beef production, 1000 tons
2008 2009 2010 France 1,490 1,500 1,490 Germany 1,210 1,165 1,150 Italy 1,059 1,036 1,022 United Kingdom 862 836 805 Spain 658 640 640
Source: USDA GAIN Report. 2009
The estimated imports were nearly 570 thousand tons in 2007 and would reach 713 thousand tons in 2012. Exports would be reduced by 65.5 thousand tons when compared 2012 to 2007 for a total of 59 thousand tons approximately. The domestic consumption would slip slightly, from 8.42 million tons in 2007 to 8.26 million tons in 2012.
Figure 4 : EU beef imports projections by country
Source: GIRA 2008 U E A R B R U R O t h e r s 0 2 0 0 4 0 0 6 0 0 8 0 0 1 0 0 0 1 2 0 0 1 4 0 0 2 0 0 0 2 0 0 5 2 0 1 0 2 0 1 5 (' 0 0 0 t c w e )
13 The main destination of EU beef exports is the EU itself. Italy imports about 400 thousand tons each year (fresh or chilled meat) from other countries of the Union. Spain, Germany and Netherlands import 200 thousand tons a year.
The main exporters of beef in the community are Germany, Ireland and Netherlands (nearly 300 thousand tons each, per year), representing 58.4 percent of the yearly European beef imports (Figure 5). Argentina is one of countries that competed with them (extra block), selling 47 thousand tons per year, of high quality of beef.
Figure 5 : Main intra-Community beef providers (2008)
Source: authors’ own calculation based on Export Helpdesk.
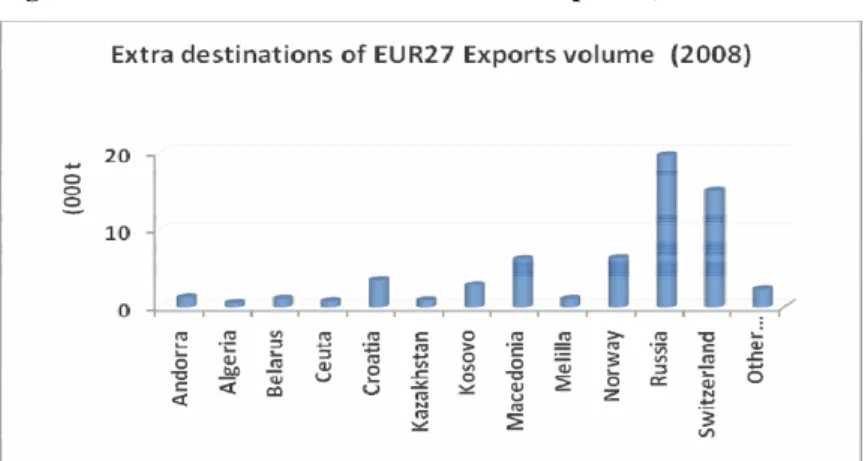
European external sales of beef represent around US$ 188 million. The main buyer is Russia with 20 thousand tons per year (29 percent of the total). EU beef exports increased from 140 thousand tons in 2007 to 204 thousand tons in 2008. EU exporters benefited from a decrease in the Brazilian fresh beef supplies to Switzerland and an increased demand for frozen beef in Russia.
Figure 6 : Destinations of extra EU27 beef exports (fresh and chilled), 2008
14 Table 2 : Top 5 EU member states’ beef exports, 1000 tons
2008 2009 2010 Germany 48 35 35 France 26 25 25 Italy 21 20 20 Poland 16 18 18 Benelux 20 15 15
Source: USDA GAIN Report. 2009
In Argentina the beef supply chain represents a total gross value of around US$ 8 billions. It is one of the most relevant agrifood chains of the country, after the soybean chain. The main target of beef production is the internal market (75 percent) with an apparent yearly consumption of 63 kg per capita. The second target is the beef export market (25 percent), which has reached a peak in 2005 with 771 thousand tons of beef.
In 2008, the number of cattle fell sharply compared to a year earlier due to adverse weather conditions (drought), a higher slaughter rate and to government policies that led to a shift away from ranching, including export limits and price controls.
Currently, Argentina exports about 17 percent of its production (282 thousand tons in 2009 see Table 4), and it is at the fifth and the sixth position of beef exporting countries. The main destinations for beef have been Russia with 141 thousand tons exported (half the total volume and one third in value). Chile is the second destination representing 16 percent in volume and value. The EU is in third position.
Table 3 : Argentina’s beef market patterns Periods Total
slaughtered
Carcass
performance Production Exports
Domestic consumption External consumption Million head.
Kg/head 1000 tons 1000 tons 1000 tons Kg/person/yr Averages 1981-2008 12.89 213.7 2 755.6 400.8 2 354.8 69.5 ´80s 12.85 210.3 2 701.7 377.1 2 324.6 76.3 ´90s 12.71 214.8 2 729.4 378.2 2 351.2 67.4 ´00s 13.22 217.2 2 869.9 466.9 2 403.0 62.8 2003-2007 13.88 217.2 3 015.0 553.6 2 461.4 63.7 Source: SAGPyA-SENASA
15 Table 4: Argentina’s Beef exports by main destinations in 2009 (*).
Hilton Fresh meat Processed meat Country 1000 tons Mill. U$S 1000 tons Mill. U$S 1000 tons. Mill. U$S
Russia 141.3 337.4 Germany 11.239 112.0 20.2 170.3 Chile 44.2 155.1 Israel 30.5 111.0 Holland 5.0 48.1 3.2 10.7 Italy 3.8 39.6 2.8 14.4 US 9.7 48.7 UK 1.5 8.8 9.5 23.0
(*) Provisory information about first 11 months 2009. Source: author’s own calculation based on SENASA (2009).
Beef SPS measures
The measures that are thought to be the most important determinants of beef exports are Sanitary and Phytosanitary’s (SPS) measures. They cover the following aspects:
i) Sanitary status and regionalization: The sanitary status is determinant in defining a market strategy, as it prevents for example the development of special cuts in countries that do not import fresh meat. Recent changes in trade regulations (WTO SPS agreement) allow countries with FMD to export to FMD-free markets if the exports originate in FMD-free regions, and if the disease is contained within a quarantine area. However, the two largest markets for American fresh meats and other animal products, Japan and Korea, do not recognize the regionalization principle yet. Argentina has two areas internationally recognized as free from FMD without vaccination: Patagonia and a zone from the Colorado River up to the northern boundary of the country has been classified as a country where the BSE risk is negligible. Conversely, countries such as the United States, Canada, Japan and Mexico do not accept fresh meat imports from Argentina unless it has been subjected to a heat treatment.
ii) Authorization of establishments and producing areas: a commonly imposed SPS is the authorization of slaughterhouses and producing areas. All meat shipments require a sanitary certificate issued by the sanitary services of both countries which usually consist of the product's name, the data of the establishment, the country of origin or the producer's name and address, the product's quantity and weight, additives etc. iii) Shipments certification.
iv) Border inspection.
v) Traffic and internal compliance.
SPS barriers can result in significant costs of compliance for producers and exporters. A foreign SPS action can stop all imports of a product, resulting in major losses for the exporting industry. FMD-free status with vaccination imposes additional costs and loss of market share. Until recently, FMD-affected countries could not export live animals or unprocessed animal products
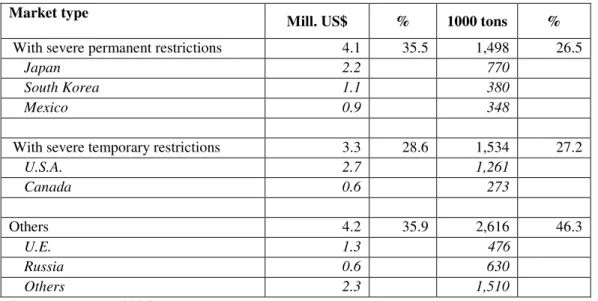
16 to countries free from the disease. Because of this restriction, the international beef market has been segmented into FMD-free and FMD-endemic markets. Since Argentina is a FMD-free country with vaccination, its beef had no access to the markets of the United States, Canada, Mexico, Japan and Korea South, which only imported from FMD-free without vaccination areas. Recently, the United States and Canada have relaxed their rules and currently allow imports from countries qualified as FMD-free with vaccination. Table 5 shows that countries with severe sanitary rules represented 35.5 per cent of world imports in 2003.
Table 5 : Share of major beef importers by level of restriction, 2003 Market type
Mill. US$ % 1000 tons %
With severe permanent restrictions 4.1 35.5 1,498 26.5
Japan 2.2 770
South Korea 1.1 380
Mexico 0.9 348
With severe temporary restrictions 3.3 28.6 1,534 27.2
U.S.A. 2.7 1,261 Canada 0.6 273 Others 4.2 35.9 2,616 46.3 U.E. 1.3 476 Russia 0.6 630 Others 2.3 1,510 Source: Nogues J. 2006
1.2 The Impact of Nontariff Measures on Imports of Pigmeat into Australia (HS0203) – M. Melatos, J. Beghin
Objective and research questions
The objective of the Australian subproject is to analyze the impact of various non-tariff measures (NTMs) imposed by Australia on its imports of pigmeat (pork), taking into account the recent policy changes induced by a WTO dispute between Australia and some of its EU trade partners, most significantly Denmark (WTO, 2003). We describe the dispute in a subsection below
Justification for the Australian case study
Australian pigmeat imports provide an interesting NTM case study for a number of reasons. The quarantine regulations applied by Australia on pigmeat imports have been the subject of a recent (2003-2007) WTO dispute between Australia and the European Union. Denmark, a EU member state, played a central role in the WTO dispute. Denmark is consistently one of the three leading exporters of pigmeat into Australia along with Canada and the United States (USDA gain report 2008, and Figure7). As such, Denmark is likely to have felt the impact of the NTM regime changes that have occurred. In addition, current quarantine regulations allow EU members
17 Sweden and Finland to export pigmeat into Australia; apparently, none has been exported yet. This case study is representative of Australia on two dimensions. It focuses on quarantine measures, the most important class of NTMs imposed by Australia on agricultural and food products. Quarantine regulations represent the only barriers to entry faced by importers. Australia levies zero tariffs on imported pigmeat, which is also typical of Australia’s trade policy. Australia has low or no duties on most goods.
Pigmeat production and trade are important in EU agriculture as documented in Table 6. Several EU member states are competitive producers and exporters of high quality pigmeat/pork products. Denmark dominates in this role. The EU competes with Canada and the United States, and in recent years with Brazil in many third markets including Australia
Table 6 : Pork trade
1999 2000 2001 2002 2003 2004 2005 2006 2007 2008 2009
Net Exporters
(Thousand Metric Tons)
Australia 8 5 28 21 5 -20 -49 -49 -87 -102 -97 Brazil 108 162 337 590 603 621 761 639 730 675 805 Canada 489 592 637 773 884 867 945 936 862 860 859 European Union 1,566 1,315 938 962 1,096 1,249 1,044 1,159 1,251 1,475 1,239 Other CIS † 4 9 24 10 -20 -16 -2 -6 -6 -6 -14 Thailand 582 335 244 0 0 0 0 0 0 0 2 United States 207 145 276 246 241 490 744 909 986 1,794 1,459
Total Net Exports * 3,007 2,584 2,566 2,692 2,980 3,616 3,914 4,097 3,981 4,804 4,368
Net Importers
Argentina 64 65 61 13 38 31 22 23 32 39 44
China - Hong Kong 187 212 224 237 260 285 263 277 302 367 366
China - Mainland -34 75 -53 -73 -132 -368 -403 -454 -152 282 172
Indonesia 0 1 0 0 0 0 0 0 0 0 0
Japan 874 946 1,021 1,107 1,090 1,269 1,314 1,153 1,210 1,248 1,184
Mexico 137 217 233 264 323 406 361 380 371 455 371
New Zealand 2 2 2 2 2 3 3 2 2 2 5
Other Eastern Europe ‡ 7 14 7 10 7 15 8 13 13 13 12
Paraguay 0 0 0 0 0 0 0 0 0 0 -4 Philippines 36 27 25 31 22 24 23 24 25 54 37 Russia 588 288 491 799 707 613 751 834 893 939 837 South Korea 44 152 88 142 128 215 329 396 434 444 450 Taiwan 72 44 11 23 41 50 33 23 16 19 15 Ukraine -2 -9 0 0 -7 48 51 59 80 140 71 Vietnam -7 -11 -29 -17 -12 -21 -17 19 6 39 34 Rest of World 996 541 403 64 342 620 704 840 504 656 659
Total Net Imports 3,007 2,584 2,566 2,692 2,980 3,616 3,914 4,097 3,981 4,804 4,368
* Total net exports are the sum of all positive net exports and negative net imports.
† Countries included: Armenia, Azerbaijan, Belarus, Georgia, Kazakhstan, Kyrgyzstan, Moldova Republic, Tajikistan, Turkmenistan, Uzbekistan. ‡ Countries included: Albania, Bosnia and Herzegovina, Croatia, Macedonia, Yugoslavia.
NTMs and Australian pigmeat imports
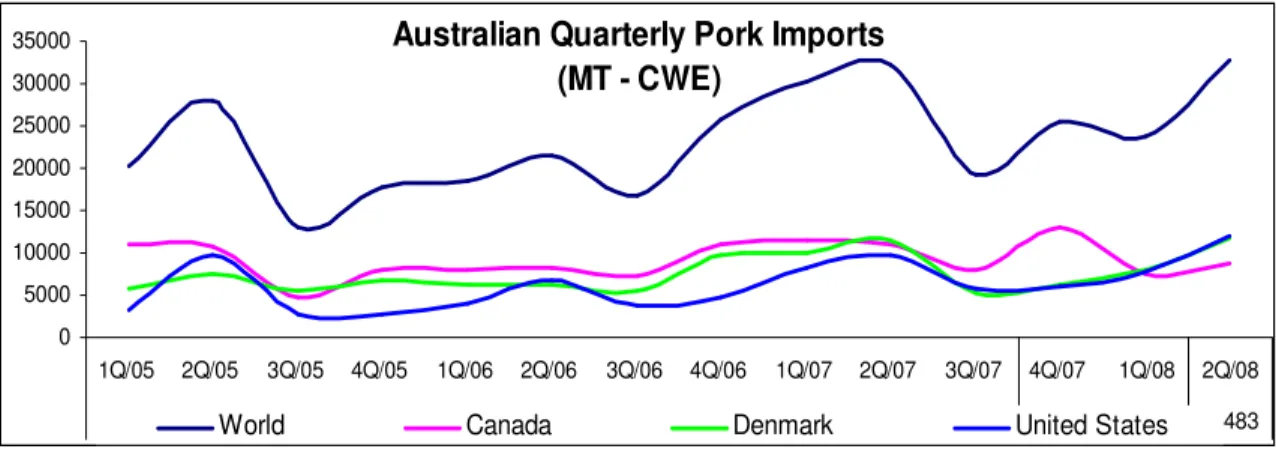
Many factors, apart from NTMs, can influence the volume of pigmeat imports as well as their source: input cost changes affecting meat cost (e.g. feed and labor costs for live animals), exchange rate changes, prices of substitute products (e.g. chicken, mutton, beef etc), market structure (size and vertical integration), genetics technology and producer switching between different market segments. Our aim is to identify the impact of NTMs on pigmeat imports. Imports of pigmeat into Australia are growing (Figure 7 and Figure 8, and p. 18, Productivity Commission Report, USDA Gain reports). This reflects not just the change in quarantine regulations, but also the long-standing and acute drought that has stricken Australia, as well as
18 the appreciation of the Australian dollar vis-à-vis the US dollar and to a lesser extent, the Euro and Canadian dollar. Given the considerable variation in domestic market conditions, exchange rates and SPS regulations, these variations should presumably be reflected in the trade data.
Figure 7 : Pigmeat imports into Australia
Australian Quarterly Pork Imports (MT - CWE) 0 5000 10000 15000 20000 25000 30000 35000 1Q/05 2Q/05 3Q/05 4Q/05 1Q/06 2Q/06 3Q/06 4Q/06 1Q/07 2Q/07 3Q/07 4Q/07 1Q/08 2Q/08 Quantity 44643 56483
World Canada Denmark United States
Source: USDA Gain Report
Figure 8 : Us imports and exchange rate changes
Pork Imports and Australian Dollar Value
20,000 40,000 60,000 80,000 100,000 120,000 2000/01 2001/02 2002/03 2003/04 2004/05 2005/06 2006/07 2007/08 40 50 60 70 80 90
Imports MT (GTA) AU/US Exchange rate US Cents (ABARE)
Source: USDA Gain report
The nature of the quarantine regime regulating the import of pigmeat into Australia has undergone significant and regular changes over time (p.4, Productivity Commission Report). These changes have often been bilateral, that is, country specific. This variation in NTM regime over time on a bilateral basis should help overcome limitation of SPS analysis purely based on cross-sectional variation often confounded with bilateral fixed effects. This variation is also useful because it permits the analysis of the impact of different NTM regimes on a particular importer and of a particular NTM regime on different importers.
Currently, the United States, Canada, and Denmark are the source of almost all imports of pigmeat into Australia. There has been great variation in the market shares of these importers over time (p. 6, Productivity Commission Report). This stylized fact should make it easier to more accurately identify any country-specific and regime-specific impacts. Moreover, different
19 importing countries tend to specialize in different types of cuts: Denmark (mainly middles for bacon), Canada (mainly legs and shoulders for ham) and the United States (mainly shoulders and legs). The fresh pork market and small goods markets for “ham-on-the-bone” and uncooked salami are supplied entirely from local production. Therefore, country-specific NTMs may in fact be “product-specific”; this could influence the composition of consumer demand.
The level of government support seems to be quite similar across the countries involved, although the EU has been using export subsidies in 2004. OECD Producer Support Estimates (PSE) for pigmeat producers are similar for Canada, the United States, Australia and Denmark (p.34, Productivity Commission Report). This farm policy situation reduces the chance that observed NTMs are being implemented for strategic or retaliatory reasons. The 2007 industry request for safeguard duties was denied by the Australian government in 2007, despite a palpable stress imposed on the industry via expensive feed and decreased competitiveness on world market because of the appreciating Australian dollar. We note however that in 2007, the EU re-introduced pigmeat export subsidies, which probably have further decreased the competitiveness of Australian producers.
Policy Background
Variation in quarantine regulations on pigmeat imports • Pre-1990: no imports permitted except for canned hams. • May 1990: imports of uncooked pigmeat allowed from N.Z.
• July 1990: imports of uncooked (frozen) pigmeat allowed from Canada.
• Late 1992: uncooked (frozen) pigmeat from Canada must also be boned prior to export and processed on arrival under quarantine control.
• May 1996: unfrozen pigmeat allowed from Canada if it is boned and cooked on arrival under quarantine control.
• November 1997: Uncooked, boneless pigmeat allowed from Denmark if it is processed on arrival under quarantine control.
• November 1997: Imports of cooked and boneless pigmeat permitted from Canada.
• From 2004, imports from anywhere permitted provided appropriate risk management undertaken (this is defined on a country-specific basis). We have collected the information on each country requirement to be able to export to Australia.
o May 2004: Frozen, cooked, boneless pigmeat from Denmark allowed if major peripheral lymph nodes removed.
o May 2004: Same policy for Canada and the United States. The meat must be processed on arrival under quarantine control.
o July 2004: Cooked, boneless pigmeat from the United States permitted provided that major peripheral lymph nodes removed. Finland and Sweden are also permitted to import currently, but do not.
The WTO dispute
In April 2003, the European Commission requested consultations with Australia regarding the Australian quarantine regime for imports of pigmeat. This consultation is a necessary first step in the dispute mechanism. The EC complained that the Australian quarantine regime for imports
20 appeared to be discretionary and arbitrary because it was left to the discretion of a Director of Quarantine. More importantly the absence of risk assessment made the a priori ban in imports suspect, because it lacked scientific basis. The Australian approach is to delay risk assessment until the import of a product has been specifically requested. In some cases, no risk assessment has been commenced despite such request. The EC request for consultation claimed that in 2003, Australia permitted the import of deboned pigmeat from Denmark for processing in Australia but not of processed deboned pigmeat from Denmark. Processing requirements imposed in Australia to protect Australia from PRRS (Porcine Reproductive and Respiratory Syndrome) were claimed to be too restrictive. Requests for market access to Australia for processed pigmeat or deboned pigmeat from other EU Member States were turned down.
Several countries requested to join the consultations: Canada, Chile, India, and the Philippines. In August 2003, the EC requested the establishment of a panel, which was initially deferred but eventually accepted by the WTO. The Dispute Settlement Body (DSB) established a panel at its meeting on 7 November 2003. Canada, Chile, China, India, Philippines, Thailand and the United States reserved their third-party rights.
In 2004, Australia’s AQIS issued a draft import risk analysis on pigmeat which clarified many of the contentious issues between all countries involved in the dispute. This import risk analysis was finalized and became the basis of current quarantine regulations on pigmeat imports.
In March 2007, Australia and the European Communities notified the DSB that they had reached a mutually agreed solution to address the issues identified by the European Communities, while providing appropriate level of protection of Australia and consistent with Australia's SPS legislation and import policy development process.
1.3 Case study on poultry trade in Japan and Russia (HS 0207 and 1602 -31, -32, -39) – T. Heckelei, S. Schlueter and C. Wieck – F. Kimura and T. Otsuki
Justification for the poultry trade case study
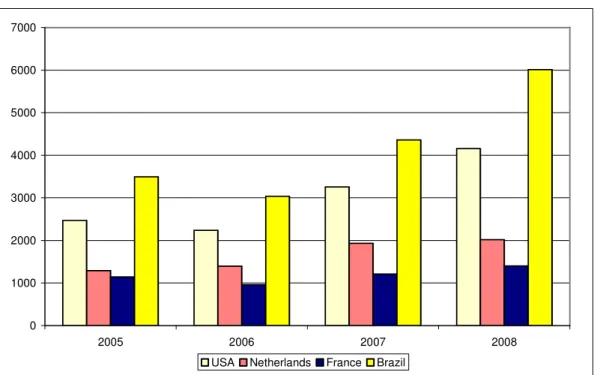
Given the growing importance of poultry meat in international trade (Figure 9), many countries implement drastic measures to restrict trade in poultry meat associated with a perceived or actual risk of transferring a pest or disease into their territory. These regulations may lead to questionable impediments to imports that compete with domestic products. When the possibility of a disease or pest transmission is very low or threat to food safety is negligible, these trade impediments cause welfare losses for importing countries and mercantilist losses (“injury” in WTO language) for exporting countries due to reduced exports.
21 Figure 9 : Global exports of poultry meat (Chapter 02) in millions of US dollars, selected countries
0 1000 2000 3000 4000 5000 6000 7000 2005 2006 2007 2008
USA Netherlands France Brazil
Source: UN COMTRADE
NTMs affecting poultry trade
Analyzing the trade concerns on poultry raised in the SPS Committee of the WTO, potential cases of measures being implemented despite of a low possibility of disease transmission can be identified. Of the 21 raised concerns on poultry meat, 12 were on avian influenza (AI) issues, whereas 3 were on microbiological contamination and on other infectious diseases, respectively, and one trade concern was on Maximum Residue Limits (MRL), antimicrobial treatment, and other issues, respectively (see Table 7).
Table 7 : Specific trade concerns raised in the SPS Committee
specific trade concern number percentage
avian influenza 12 57%
microbial contamination 3 14%
other infectious diseases 3 14%
antimicrobial treatment 1 5%
MRL 1 5%
other 1 5%
all 21 100%
Source: own calculation based on WTO SPS-IMS
Looking at the AI cases, most often the complaint of the exporting country is that the importing country imposes NTMs which are disproportional to the associated risk and not based on OIE
22 guidelines. For example, in October 2007 China raised concerns that the European Communities and the United States had suspended the importation of cooked poultry meat from China because of the presence of highly pathogenic avian influenza in China. The import ban was implemented in spite of the OIE guidelines on avian influenza which explicitly state that heat treatment de-activated the virus and that restricted measures associated with AI should not be applied to cooked poultry meat (WTO 2009). Another example is the concern of the European Communities on Indian’s import ban on European live birds, fresh poultry meat and meat products due to avian influenza. The EC argued that these measures were disproportionate to the health risks associated with imports from the EC as it was free of highly pathogenic avian influenza. Within the discussion on India’s import measures the OIE clarified that findings of avian influenza in wild birds and of low pathogenic notifiable avian influenza (LPNAI) should not lead to import bans and that there needed to be a distinction drawn between reporting and the imposition of measures. The listing of diseases such as high pathogenic avian influenza (HPAI) and low pathogenic notifiable avian influenza was first and foremost for disease reporting purposes and related to the question of transparency (WTO, 2009).
Objective and research question
Sanitary and food safety concerns stemming from animal disease outbreaks have limited the growth in trade for meat exporting countries affected by trade bans. The objective of this case study is to analyze the exporters’ welfare effects of a change in the importers’ regulatory policy with regard to avian influenza. The case study differentiates between two scenarios: (1) the implementation of an alternative regulatory policy to a ban in the case of low pathogenic notifiable avian influenza having a proportional risk mitigating effect; and (2) the implementation of an alternative regulatory policy to a ban in the case of high pathogenic avian influenza having a proportional risk mitigating effect.
To analyze the competitiveness of European poultry meat producers in terms of their potential to export, the welfare and trade effects of a change in import policies of two major importers - Japan and Russia – on four important poultry meat exporters – EU, Brazil, the United States, and China - are compared among each other.
Poultry meat cannot be assumed to be homogenous as it has to be differentiated between meats originating from sources being free of AI, from sources with LPNAI, and from sources with HPAI. Additionally the study differentiates between cooked and uncooked meat, as the OIE differentiates between both product groups when defining the appropriate measures to mitigate the spread of avian influenza. Thus there are six meat categories listed in Table 8. The green cells indicate that the guidelines of the OIE do not foresee any trade restrictions for these meat categories. The red cell indicates that trade measures are justified.
23 Table 8 : Meat categories
Cooked meat Uncooked meat
Source free of AI Meat category 1 Meat category 2
Source with
status LPNAI
Meat category 3 Meat category 4
Source with
status HPAI
Meat category 5 Meat category 6
Source: own compilation
Food safety threat and Japanese SPS measures on poultry
Sanitary and Phytosanitary regulations have been implemented to ensure the health of animal, plant and human beings of countries engaged in trade. Such regulations take various forms such as a ban, tariffs, standards and other technical requirements, and their specifications often follow their domestic regulations. In Japan, the government enacted the Food Sanitation Act in 1947 and the Plant Quarantine Law in 1950, the Domestic Animal Infectious Diseases Control Law in 1951, and those SPS rules have implemented both domestically produced and imported foods. The discordance between the Japanese SPS regulations and those of its trading partners has sometimes caused major contentions.
Recently, the incidence of avian influenza has led to trade ban on poultry and poultry meat imports to Japan from infected countries including most of the European and Asian countries. Japan announced a ban against South Korea and France in 2006 and against most of the rest of the European countries by 2009. Japan had imposed the import ban indiscriminately against high and low pathogenic type influenza until 2006. The import share of traditional exporters to Japan such as China and Thailand substantially dropped in the last decade due to the incidence of avian influenza whereas the share of Brazil which is infection-free has grown rapidly. In 2006 Japan agreed to lift the ban from uninfected regions of a country which was categorized as low pathogenic according to a France’s request. Despite this change in regulatory regime, this region-base scheme has been applied to only France, the United States, and Mexico. Also, scientific fact has not yet been provided for the risk of importation of poultry meat from infected countries for consumers and producers, and therefore, the import ban on poultry meat does not have justification. Thus, if the Japan’s regulations are to be adjusted according to the region-wise scheme for the low pathogenic countries, export loss may be contracted. The benefit of the region-wise scheme would be substantial for the European countries as Japan is one of the dominant markets for their poultry meat export, and most of them are categorized as low pathogenic.
Furthermore, the lasting Brazil’s dominance in the share in Japan’s poultry meat imports indicates possible persistence of negative reputation impact on their consumption of the ex-infection countries since the incidence of the ex-infection. Also, consumers concern about safety of imported foods may be triggered by the food safety threat, and they continued to be reluctant to purchase foods from the infected countries. Therefore, recovery of the import from the
ex-24 infection countries may take a substantial time after the elimination of the ban, and they tend to continue to purchase domestic meat and imported meat from countries with no infection history. Also, consumers tend to have strong preference toward the competing domestic products.
1.4 Rationale behind the selection of the poultry case study in China (HS 0207) – J. Yang and J. Huang
Justification for the Chinese case study
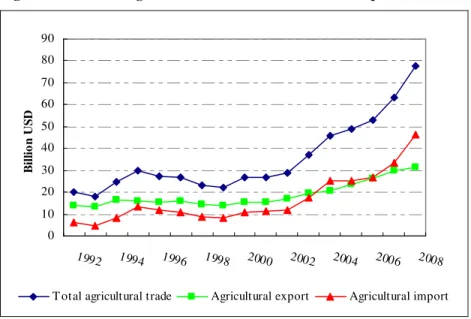
China’s agricultural trade has grown rapidly after its WTO accession in 2001. As shown in Figure 10, China’s agricultural export increased from 15.4 billion USD in 2001 to 31.5 billion in 2008, rising by 104 percent.1 Meanwhile, the import grew much faster from 11.3 billion in 2001 to 46.1 billion in 2008, increasing by 307 percent. Due to a much faster growth rate of import than export, China’s agricultural trade position has shifted from net exporter to net importer since 2004. The deficit reached 14.6 billion in 2008 (Figure 10).
Figure 10 : Chinese agricultural trade 1992-2008 (in 2000 price)
0 10 20 30 40 50 60 70 80 90 1992 1994 1996 1998 2000 2002 2004 2006 2008 B il li o n U S D
T otal agricultural trade Agricultural export Agricultural import
Source: authors’ calculation based on UNCOMTRADE
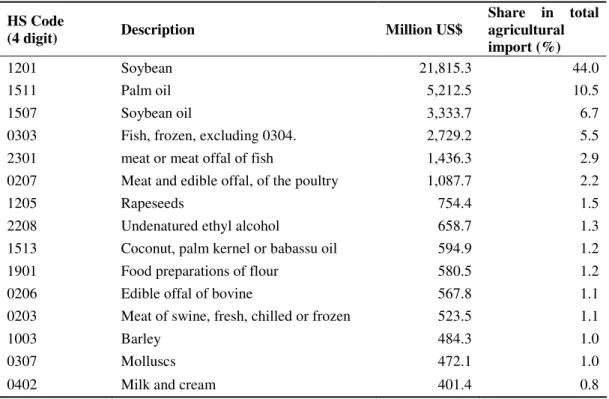
As shown in Table 9, China’s agricultural imports are quite concentrated on a few major commodities. For example, the largest importing agricultural commodity is soybean, which accounted for almost half (44 percent) of total agricultural import in 2008. However, it is also notable that the import of certain high-value agricultural commodities (e.g., animal and dairy products, high-quality grape wine) also account for large shares and their imports grow rapidly. Moreover, imports of these commodities are expected to rise in the future as the domestic demand will increase with the rise in per capita income in China. For example, there are 7 animal and dairy products and 1 processed food (HS 1901) in the list of top 15 commodities, which accounts for 15.7 percent of total agricultural import (Table 9).
1
25 Table 9 : China’s imported agricultural commodities top 15 in 2008
HS Code
(4 digit) Description Million US$
Share in total agricultural import (%) 1201 Soybean 21,815.3 44.0 1511 Palm oil 5,212.5 10.5 1507 Soybean oil 3,333.7 6.7
0303 Fish, frozen, excluding 0304. 2,729.2 5.5
2301 meat or meat offal of fish 1,436.3 2.9
0207 Meat and edible offal, of the poultry 1,087.7 2.2
1205 Rapeseeds 754.4 1.5
2208 Undenatured ethyl alcohol 658.7 1.3
1513 Coconut, palm kernel or babassu oil 594.9 1.2
1901 Food preparations of flour 580.5 1.2
0206 Edible offal of bovine 567.8 1.1
0203 Meat of swine, fresh, chilled or frozen 523.5 1.1
1003 Barley 484.3 1.0
0307 Molluscs 472.1 1.0
0402 Milk and cream 401.4 0.8
Source: UNCOMTRADE
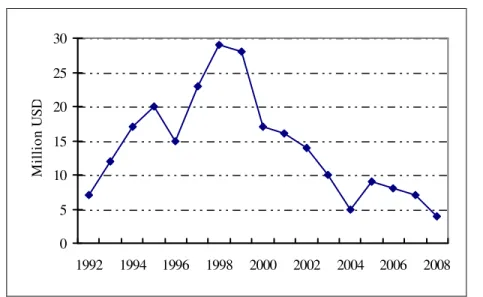
Agricultural trade between China and EU is growing rapidly and the Chinese market is getting more and more important for EU agricultural exports. Exports of agricultural commodities from the EU to China have increased from US$ 636 million (evaluated at 2000 prices) in 2001 to US$ 2.196 billion (evaluated at 2000 prices) in 2008, with an average annual growth rate of 19%. In 2008, the EU became the fifth largest exporter of agricultural commodities to China. The importance of China’s market for EU agricultural exporters has risen from the twelfth position in 2001 to the seventh in 2008. Considering the continued growth of the Chinese economy, it could be expected that the importance of Chinese market for EU will increase further in the future. Imports of poultry products in China increased from 1992 to 1999, but have started to fall since 2000 (Figure 11). Trade of high value-added animal products, often faces NTMs. EU’s poultry exports to China have raised questions on what are major determinants of China’s import of high value-added animal products and what are the likely impacts of NTMs on EU’s export of agri-food products to China.
26 Figure 11 : China’s imports of poultry products (HS 0207) from the EU, 1992-2008 (2000 price)
0 5 10 15 20 25 30 1992 1994 1996 1998 2000 2002 2004 2006 2008 M il li o n U S D Source: UN COMTRADE
Objective and research question
Critical issues on NTMs include the following four sets of questions.
• What kinds of NTMs have been adopted to regulate the import of poultry products? Do they differ between dairy and poultry products?
• How have these NTMs been implemented for poultry products?
• Have these NTMs significantly affected the import of poultry products? Especially, was the recent decline in poultry export from EU to China mainly due to loss of EU’s competitive position in China’s poultry market or due to changes in China’s NTMs? • What are the competitive positions of major poultry products providers in China, (e.g.
EU, New Zealand, Australia and United States)?
1.5 India’s case study on poultry meat and eggs (HS 0207, 0407) – R. Mehta
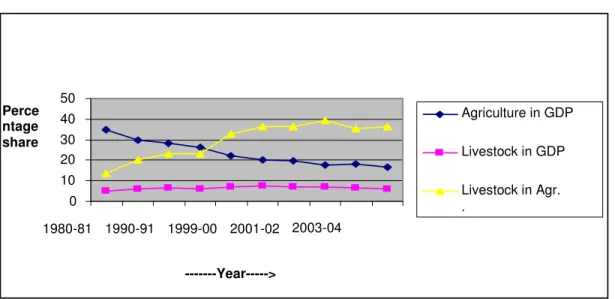
Livestock is one of major growing sectors in India. The share of livestock in GDP has been 4.8 percent in 1980-81, based on official statistics. Between then and 2000-01, the share rose to 7.33 percent; but then dropped to 6.10 percent in 2004-05. The livestock sector gaining prominence can also be seen if we look at the relative share of this sector in the agricultural sector - it was 13.8 percent in 1980-81, and then moved to 36.51 percent in 2004-05, i.e. out of every three units produced in agriculture, one unit of output and even more comes from the livestock sector. Figure 12 below exhibits the structural changes affecting the Indian economy at large.
27 Figure 12 : India’s share of agriculture and livestock in GDP
The relative share of poultry in the livestock sector is on a continuous ascending. This can be seen from Figure 13. The relative share of poultry in total livestock is lifted up from 10 percent in 1996-97 to 12 percent in 2003-04. Poultry industry is seen to have grown at the rate of around 14 per cent per annum, during 1994-2005.
Figure 13 : India’s share of poultry in livestock sector
Poultry meat is today the major source of meat in India. Its share in total meat consumption during 2004 was 28 percent as against 14 percent during 1995. In 2004, the total consumption of poultry meat was 1.7 million tons.
India consumed 44 billion Eggs during 2004-05. Most of this is produced in India. India is the world’s 5th largest producer of eggs. Egg and egg-based products account for 90 percent of
0 5 10 15 199 6-97 1997-98 1998 -99 1999-2000 2000-2001 2001-2002 2002-2003 2003-2004 Year Percentage
share Share of poultry in
Livestock sector 0 10 20 30 40 50 1980-81 1990-91 1999-00 2001-02 2003-04 ---Year---> Perce ntage share Agriculture in GDP Livestock in GDP Livestock in Agr. .
28 India’s poultry exports. Exports of hatching and table eggs have increased dramatically – from Indian Rupees (IR) 196 million in 1996-97 to IR 408 million in 2005-06. Similarly, exports of egg powder have increased from IR 351 million in 1996-97 to IR 1126 million in 2005-06. Exports of egg powder fell drastically between 1997 and 2000 because of the ban imposed by the EU on egg powder imports from India, but have started to recover in 2001.
Objective and research question
However, in spite of a significant growth in consumption and production during the last 25 years, the amount of India’s level and growth of import and export of poultry meat, eggs and their based products is negligible. It can be due to (i) competitive advantage of India vis-à-vis principal trading partners, (ii) trade restrictive measures, e.g. tariff and non-tariff measures, of India, and/or (iii) trade restrictive measures of principal trading partners.
The main objective of this case study is to understand the implication of different NTMs (particularly SPS standards) on exporter’s welfare of the EU and India. This will be carried out for (i) poultry meat, and (ii) egg and egg-powder. The emphasis will be given on cost competitiveness, and trade foregone for exporters. The country coverage can be extended to other competitive/trading partners like the United States, Australia, etc.
In particular, this case-study will concentrate on
(a) Identification of different types of SPS standards imposed by India, the EU, the United States, Australia, etc.
(b) An index of SPS standards of Poultry meat and egg-powder of above mentioned countries using methodology developed by Mehta et al.(2005),
(c) Impact of food safety standards on poultry exports from EU and other countries. This will be carried out by a partial equilibrium model.
1.6 Assessment of technical and sanitary norms and regulations upon poultry trade flows for the EU-27 and Brazil – H. Lee Burnquist, M.J. Pinto de Souza and L. Meneguelli Fassarella
Justification of the case study
Poultry meat has been chosen for this case study given its relative importance for the Brazilian and European agri-food trade as illustrated in Figure 14. In fact, the poultry sector has been one of the most dynamic meat sectors through the last decade, presenting the largest growth of world consumption and production of all meat categories. At a global level, total poultry consumption and production (all species) increased from 66 million tons in 1999 to 85.6 million tons in 2009, corresponding to an annual increase of 2.7 percent (USDA; 2010). Trade experienced a 6.2 percent annual increase in the same period, from 3.7 million tons in 1999 to 6.7 million tons in 2009 (FAPRI; 2009). These results were achieved despite recurrent consumers' scares and trade restrictions due to disease outbreaks such as avian influenza, which represented a major threat for the poultry sector worldwide.
29 In addition, poultry meat trade has been frequently subject to technical and sanitary norms and regulations introduced by governments of several developed and developing countries in economic contexts of market failures, where the price mechanism is unable to balance supply and demand, such that government intervention is required. The introduction of new norms and regulations may also be driven by disease outbreaks as well as increased consumers’ and producers’ awareness of risks associated with food products. New requirements may be as diverse as temperature control, regulation for salt content, inspections, conformity analysis, certifications, issues related to contamination such Salmonella spp, Listeria, monocytogenes, Nitrofuran, Nitrofurazone, religious patterns etc.
Empirical analysis has shown that the introduction of technical and sanitary requirements can result in major rearrangements in the international market. However, the effect of these standards and regulations upon trade is unclear a priori. Regulations might present either positive or negative impacts upon trade (Schlueter and Wieck; 2009; Moenius; 2004), being conditioned by factors such as information content, for example. The present analysis will explore evidence presented by Moenius (2004), which is considered appropriate to evaluate the importance of agri-food standards and regulations in shaping chicken meat trade for Brazil and the European Union.
An overview of exports and imports of poultry meat shows that Brazil is among the major world exporters, followed by the United States and the European Union in 2008. Russia, Japan, the European Union and Saudi Arabia are the main importers (Figure 14).
Figure 14 : Poultry exports and imports, by country 1000 tons
Source: USDA 2010
Brazil has presented a positive performance in the world poultry market being currently responsible for 40 percent of total world exports, (3.6 million tons and US$ 6.9 billion). Brazilian poultry have been shipped to more than 50 countries between 2007 and 2008. Despite of this relative wide number of importers 48.6 percent of the total volume is concentrated in the 4 largest importers of Brazilian poultry see Table 10. European Union represented 14.6 percent of the total in 2008.
30 Table 10 : Top 10 destinations of Brazil poultry exports, 2008
Country Quantity (1000 tons) Share
EU - 27 530.75 14.6%
Japan 422.18 11.6%
China, Hong Kong SAR 415.27 11.4%
Saudi Arabia 400.37 11.0%
Venezuela 316.62 8.7%
United Arab Emirates 208.42 5.7%
Kuwait 163.63 4.5%
Russian Federation 158.87 4.4%
South Africa 147.36 4.0%
Singapore 75.63 2.1%
Source: UN COMTRADE
A look at the structure of the market is useful to understand the strategic importance of the EU market for Brazilian poultry exports (Table 11). Chicken cuts shipments registered 1.9 million tons in 2008. The main importing countries of this segment were Japan, Hong-Kong, the European Union, South Africa and Russia. Whole chicken exports from Brazil have been concentrated in the Middle East (Saudi Arabia, United Arab Emirates, Yemen and Kuwait) Venezuela, Russia and Angola. The main market for processed and salted chicken is the European Union.
Table 11 : Brazilian chicken exports by product (1000 tons), 2008
World EU - 27 Whole 1,336.46 16.64 Cuts 1,931.42 173.66 Processed 168.76 132.58 Salted 208.88 207.87 Source: UN COMTRADE
Imports from the EU-27 (excluding intra-bloc trade) reached 744 thousand tons which is equivalent to exchange revenues of US$ 1.14 billion in 2008. The 10 major poultry meat buyers from the European Union are classified in Table 12 in terms of their relative volume of imports. Brazil and the European Union compete for shares in Russian, Saudi Arabian and Chinese markets. The structure of the European poultry market shows that, as for Brazil, chicken cuts predominate (Table 13).
31 Table 12 : Top 10 destination of EU’s poultry export, 2008
Country Quantity (1000 tons) Share
Russian Federation 143.15 19.2%
Saudi Arabia 94.60 12.7%
Ukraine 83.61 11.2%
Benin 58.96 7.9%
China, Hong Kong SAR 40.84 5.5%
Viet Nam 32.60 4.4%
Ghana 28.80 3.9%
Yemen 26.64 3.6%
United Arab Emirates 25.57 3.4%
Switzerland 18.80 2.5%
Source: UN COMTRADE
Table 13 : European chicken exports by product (1000 tons), 2008
Chicken Quantity Share
Whole 269.24 36.2%
Cuts 436.34 58.6%
Processed 31.23 4.2%
Salted 7.20 1.0%
Source: UN COMTRADE
In summary, market information indicates that Brazil and the EU are major exporters in the poultry global trade and compete in relevant importing markets, such as Russian Federation and Saudi Arabia, among others. This information was fundamental for establishing the objectives and formulating research hypothesis to be addressed in this case study.
Objective and research question
The major purpose of the research is to evaluate the importance of agri-food regulations and standards in shaping poultry trade for Brazil and the European Union, assuming that the current strategic position assumed by these players in the world poultry market can be significantly affected by these measures. Research question is twofold:
1. What are the sanitary and technical requirements (norms and regulations) imposed by countries importing poultry from Brazil and the European Union that may potentially affect their relative competitiveness?
2. How do sanitary and technical measures affect access of Brazilian and EU poultry to relevant international markets?
32 To answer the first question, a broad survey of SPS and TBT notifications to WTO will be conducted, considering information from public and private national institutions involved with import and export. Requirements will be classified and organized according to MAST (2008), observing the objective of the notification, such as: 1) Food safety; (2) Animal health; (3) Plant health; (4) Protect humans from animal/plant pests or diseases. An inventory approach will be applied (count measure: frequency and coverage ratios).
To evaluate how the sanitary and technical measure (public and private) affects market access of Brazil and the EU, two gravity type equations will be estimated, using the Anderson and van Wincoop (2003, 2004) approach and the methodology proposed by Silva and Tenreyro (2006). Gravity equations will be included as well as conventional variables such as tariffs, sanitary and technical measures, classified and analyzed according to MAST (2008) (Item 1). This approach is similar to Disdier et al. (2008); Karov et al. (2009); Schlueter and (2009); Burnquist and Souza (forthcoming).
33
2 - Case studies on dairy (HS Chapter 04)
2.1 The Impacts of Canadian Cheese Compositional Standards on the Competitiveness of Dairy Exporting Firms (HS 0406 -10, -20, -30, -40, -90) – J.P. Gervais, B. Larue and M-H. Felt
Objective and research question
This case study will focus on recent modifications to regulations on compositional standards of cheese in Canada. The objective is to analyze the impacts of these regulations on the competitiveness of exporters in the Canadian market. The new compositional standards for cheese were issued by the Canadian government in December 2007. The stated objective of the changes in regulations was to “guarantee the integrity and quality of Canadian cheese for consumers”. The regulations amending the Food and Drug Regulations (FDR) and the Dairy
Products Regulations (DPR) came into force in December 2008. In essence, the new regulations require that cheese products derive a minimum amount of its casein from fluid milks and ultra-filtered milks rather than from other milk products, as well as have a whey protein to casein ratio that does not exceed that of milk. In addition, the casein content derived from milks must meet or
exceed the percentage of the total protein content for a given cheese variety. Changes to the
DPRs also introduced new cheese import requirements. All cheese importers now need a cheese import license issued by the Canadian Food Inspection Agency (CFIA) as of December 14, 2008. Canada officially notified the WTO of these changes through the Agreement on Technical Barriers to Trade Agreement
These new standards raise a number of important issues which can be sorted out according to whether they are Canadian dairy stakeholders or foreign suppliers. Canadian dairy producers have been overwhelmingly in favor of the changes to the existing regulations. Due to technological advances in dairy processing, ingredients from milk or dairy by-products (whey, buttermilk) are increasingly used in food products for their nutritional technological properties. The demand for dairy ingredients has grown considerably in Canada. Under previous rules, Canadian dairy processors would use the domestic milk fat content and import dairy proteins at a lower price than on the domestic market, reselling to producers non-fat milk solids. One of the secondary objectives of the new regulations is to create a more stable market for Canadian milk proteins (as well as a more profitable market than the secondary feed market onto which domestic dairy ingredients were sold)
Canadian dairy processors use dairy ingredients (especially dairy protein isolates) for the price and competitive advantage they confer. If the new regulations are binding, it is expected that they will raise the cost structure of Canadian dairy processors. The following table report the
estimated ratio of casein derived from milk to total content used in the Canadian industry as well as the new ratio set by regulations.