HAL Id: hal-02375014
https://hal.archives-ouvertes.fr/hal-02375014
Submitted on 21 Nov 2019HAL is a multi-disciplinary open access
archive for the deposit and dissemination of sci-entific research documents, whether they are pub-lished or not. The documents may come from teaching and research institutions in France or abroad, or from public or private research centers.
L’archive ouverte pluridisciplinaire HAL, est destinée au dépôt et à la diffusion de documents scientifiques de niveau recherche, publiés ou non, émanant des établissements d’enseignement et de recherche français ou étrangers, des laboratoires publics ou privés.
Alteration mechanisms of ancient glass objects exposed
to the atmosphere
Fanny Alloteau, Valentina Valbi, Odile Majérus, Isabelle Biron, Patrice
Lehuédé, Daniel Caurant, Thibault Charpentier, Antoine Seyeux
To cite this version:
Fanny Alloteau, Valentina Valbi, Odile Majérus, Isabelle Biron, Patrice Lehuédé, et al.. Alteration mechanisms of ancient glass objects exposed to the atmosphere. Glass Atmospheric Alteration: Cul-tural Heritage, Industrial and Nuclear Glasses, 2019, 9782705697945. �hal-02375014�
F. Alloteau, V. Valbi, O. Majérus, I. Biron, P. Lehuédé, D. Caurant, T. Charpentier, A. Seyeux in Glass Atmospheric Alteration: Cultural Heritage, Industrial and Nuclear Glasses, Eds. I. Biron, F.
Alloteau, P. Lehuédé, O. Majérus, D. Caurant, Hermann Ed., ISBN978-2705697945, Paris (France) (2019) 11-22.
Alteration mechanisms of ancient glass objects exposed to the atmosphere Fanny Alloteaua,b, Valentina Valbia,b, Odile Majérusb, Isabelle Birona, Patrice Lehuédéa,
Daniel Caurantb, Thibault Charpentierc, Antoine Seyeuxb
a) Centre de Recherche et de Restauration des Musées de France (C2RMF), PCMTH, IRCP, UMR CNRS 8247, F-75001 Paris, France
b) Chimie ParisTech, PSL Research University, PCMTH, IRCP, UMR CNRS 8247, F-75005 Paris, France
c) NIMBE, CEA, CNRS, Université Paris-Saclay, CEA Saclay, F-91191, Gif-sur-Yvette, France
ABSTRACT
The development of new efficient protective methods for ancient glass objects that decay under atmosphere could only be achieved through a better understanding of the alteration mechanisms on a very small scale. To this end, ageing experiments (temperature and humidity control) are conducted on relevant chemically unstable ancient glass composition replicas (alkali (Na,K)–rich silicate). Ageing temperature and glass composition effects on the chemical, morphological and structural evolution of the glass surface replica are evaluated by a combination of multi-tool analysis. Our results put in evidence the non-correlation between the weathering process (formation of a hydrated surface layer) and the departure of alkalis. The slow diffusion of alkalis may be related to the all-solid-state character of the altered layer: all molecular water is H-bound to the network or as Si-OH. These water molecules do not have the same solvation properties than liquid water. Moreover, we highlight a strong influence of the ageing conditions and of the glass composition on the atmospheric alteration mechanisms. In particular, these parameters affect the proportion of alkali elements that are retained into the hydrated layer, which would severely impact the glass chemical durability. Based on preliminary results, a rinse operation promoting the removal of a fraction of alkalis from the altered layer appears very interesting from a glass conservation perspective.
INTRODUCTION
The deterioration of ancient glass objects by atmospheric alteration is a serious issue for the museum collections. Active degradation is indeed observed on the surface of about 10 to 20 % of the glass objects stored in the museum collections of western Europe [1] [2] [3], mainly glass productions from the Middle-Age when glassmakers have employed new raw materials and new purification process of the raw materials [4] [5]. This alteration is visible through macroscopic manifestations such as white salt deposits, weeping or crizzling, resulting in a loss of transparency and material disintegration [6] [7]. On a smaller scale however, the manifestations are far less known, as well as the mechanisms underlying the glass atmospheric alteration which depend both on the glass composition and on the conservation conditions.
The current research aims to get a better knowledge of these mechanisms, what appears to be of major concern to identify efficient means of glass conservation in museums.
alteration kinetics, in total absence of condensed water and in neutral environment (without any acidic pollutants) what corresponds to the best monitored museum conditions. In particular, the influence of the ageing temperature and the glass composition on the phenomenology of the atmospheric alteration is studied by characterizing the altered layers from the macroscopic to the atomic scale with a combination of multi-tool analysis. On the basis of these results and by introducing a few additional experiments aiming to evaluate the incidence of a rinse step of the altered layer, mechanisms of the glass atmospheric alteration are discussed and very interesting directions of research are arisen for the glass artwork conservation in the longer term.
EXPERIMENTAL Sample preparation
Three alkali silicate glass replicas, referred as SL, A and P, are studied. Their respective composition, as detailed in Table 1, have been chosen to be representative of one or several productions of glass objects from the Middle-Age, with various degrees of atmospheric alteration [8] [9]. These glass replicas are fabricated by Saint-Gobain Recherche (France) by melting the mixture of reagent grade powders at 1450 °C for 2 h, annealing the casted block at 560 °C and then cooling down slowly for 1 h to relieve stresses and enable cutting1.
Samples are prepared in the form of polished plates (1 ×1 ×0.3 cm3) to perform surface analysis and to work on reproducible surfaces2, which are cleaned shortly before ageing tests, according to the procedure described in Ref. [10]. For bulk spectroscopy analysis, calibrated glass powders (32– 50 μm, 5–10 μm and 2–5 μm size fractions) are prepared by crushing before sieving the casted glasses to recover the 32–50 μm and 0-32 μm size fractions. The 32–50 μm size fraction is washed in acetone then ethanol to remove small particles stuck on the grain surface. The two smallest size fractions 5–10 μm and 2–5 μm are obtained by settling of the size fraction 0-32 μm in acetone then ethanol using the Stokes’ law. Afterwards, the size homogeneity is checked under an optical microscope or an electronic microscope. The specific surface area is measured by the BET method, using a Belsorp Max analyser with krypton as adsorbing gas3.
SiO2 Al2O3 MgO CaO Na2O K2O NBO/Si
SL: Soda Lime Silicate
66.8 2.5 3.0 7.5 18.0 2.1 0.90
From Antiquity
coastal plants
A: Mixed Alkali Silicate
71.3 0.8 0.8 5.0 11.0 11.0 0.66
Middle-Age, Renaissance
purified ashes of plants with tartar or salpetre salt P: Potassium Silicate
75.8 0.3 0.2 2.0 1.5 20.2 0.44
XVIe, XVIIe and XVIIIe centuries
purified ashes of continental plants
1 The composition of each casted block is checked by chemical analysis and corresponds at +/−0.1 % (oxide weight) to the target
composition
2 Tof-SIMS (Time of flight-secondary ion mass spectrometry) analysis conducted on glass plates after the preparation steps and
prior a V test showed an outermost surface layer of about 30 nm partially alkali depleted
Table 1 – Composition of glass replicas (weight %), from ancient glass compositions with their production periods and main sources of alkalis. NBO: Non-Bridging Oxygen.
Ageing tests
Two different devices are used in parallel to control simultaneously the relative humidity and the temperature of the ageing atmosphere on various time periods (from some hours to several months): (i) climatic chamber4 and (ii) hermetic box put in oven and containing a saturated saline solution5. For each ageing tests, glass plates are put horizontally with the polished face upwards and powders are scattered on Teflon dishes within the ageing atmosphere. These tests are performed in static mode (no cycling), and the climatic conditions (T°C and RH%) are chosen to prevent from any liquid water flow on the samples during a test. As the target relative humidity and temperature are respectively 85 % RH and 80 °C, 60 °C, 50 °C or 40 °C6, each ageing test conducted with the device (i) begins with a heating ramp of 3 hours from ambient conditions (20 °C, 35 % RH) until the dwell, and ends with a cooling ramp of 3 hours until ambient conditions7. The device (ii) is used exclusively for ageing tests at 85 % RH and 50 °C or 40 °C, of some weeks or several months, with a bath of KCl in large excess in milliQ water [11]. The hermetic box containing the samples is put in the preheated oven before the thermodynamic equilibrium of the three phases (solid salt – liquid water – air/water vapour), that takes place in less than 3 hours. At the end of the ageing test, the hermetic box is removed from the oven and immediately open in order to drop down simultaneously and very quickly the relative humidity and the temperature by avoiding the condensation phenomena.
In this paper, these ageing tests are noted V test or VXh, VXd or VXm tests with X the total duration in hours (h), days (d) or months (m) including the ramps, and time noted t1 refers to the end of the V test. At t1, glass plates aged with the device (i) are put in the atmosphere of the laboratory at room temperature8, while the aged glass powders are kept in Eppendorf tubes stored in desiccators until their characterization, to limit interaction with the atmosphere. As the V tests conducted with the device (ii) don’t include a cooling ramp, samples aged according to this method are first put in desiccator during a few days to remove from them the “freest” water before to be left in laboratory atmosphere (plates) or kept in Eppendorf tubes stored in desiccators (powders). Note that the good correspondence between the two ageing methods (with the device (i) or (ii)) has been checked by the comparison of a 2 months ageing test at 50 °C, 85 % RH, for the 3 glass replicas.
Characterization methods
The surface and sub-surface modifications of the glass resulting from a V test are studied from t1 and on a 6 months period after t1, when the aged glass surface plates can deteriorate under the laboratory atmosphere as evidenced by Alloteau & al [10].
Sample preparation before the characterization is very limited. In particular, no rinse nor polishing are performed as these operations can be very harmful for the altered layers integrity [10]. Thus, the surfaces of the aged samples are potentially covered by alteration products and we employ analytical methods that are compatible with these constraints for the multi-scale characterization.
Glass surface states
4 Details about the climatic chamber and its operation are described in Ref. [10]
5 The control of the relative humidy of the vapour atmosphere created above a saturated saline solution is a common method for
the calibration of hygrometers [11]
6 For both devices, T°C and RH% have been checked very close to these set values at sample position and at the equilibrium by
using an external sensor (MadgeTech data logger): ± 3 % RH and ± 0.5 °C respectively
7 as described in Ref. [10] for an operation at 85% RH, 80 °C
8 T°C and RH% variations in laboratory are checked with a MadgeTech data logger (average temperature: 22.2 °C; average RH:
The surface states of the glass plates are characterized before the V tests (to) and repeated several times after the V tests (from t1) by the mean of a binocular magnifier and an optical microscope equipped with a camera Nikon DS-3, or with a numerical microscope Keyence VHX-5000 in direct or grazing light. This characterization is supplemented by observations with an electronic microscope FEG-SEM 9 JEOL 7800F, preferentially in secondary electron mode at low acceleration tension (2 to 7 kV), after making the glass surface conductive with a platinum deposit of about 1 nm thick10.
Altered layers thicknesses
Altered layer thicknesses are noted ea in this paper.
The very small ones (some tens of nm to about 200 nm) are determined from the elementary concentration profiles obtained from the surfaces of the aged glass plates by Tof-SIMS analysis. To this end, we consider the distance on which the 45SiOH+/28Si+ ratio is halfway between its sub-surface concentration11 and its baseline concentration as a marker of the interface altered layer-pristine glass, by analogy with a method described in Ref. [12] using the 1H+/28Si+ ratio. These analysis are carried out on a Tof-SIMS V instrument (Ion-Tof company), using a O2+ ion beam (2 keV, about 150 nA) for in-depth abrasion, a Bi+ ion beam (25 keV, 0.3 pA) for the analysis, and an unfocused electron beam of some eV for the charge neutralization. The crater is 200 μm × 200 μm or 300 μm × 300 μm in size and at its center the analysis zone is 50 μm × 50 μm or 100 μm × 100 μm respectively. The sputtering rate is determined on aged glass plates thanks to mechanical profilometry (about 0.34 nm/s into the altered layer for a current of 100 nA).
For the altered thicknesses high enough (about 200 nm and above), their evaluation by SEM observations is preferred. When flakes form on glass plates, their thicknesses are measured and associated to the altered layer thicknesses after checking that the flaking occurs in the region near the interface altered layer-pristine glass. Otherwise, SEM observations are performed on edge, on a freshly fractured sample, preferentially in backscattered electrons mode to visualize the chemical contrast at the interface altered layer-pristine glass. These observations are performed in different areas of a same aged glass plate and we report a mean thickness ea.
Chemical analysis
Elementary compositions of the altered layers are quantified by EDX12 with the system Bruker QUANTAX 400, at the same time as SEM observations. Analysis are performed from the glass plate surface, outside any defect or crystal, according to the operating conditions and the specific quantification method described in Ref. [10]. In particular, for the effective quantification with STRATAGem data processing software, glass is modeled in layers of known thicknesses: stack altered layer / Pt or pristine glass / altered layer / Pt when ea is smaller than the analyzed depth. Elementary composition profiles into the altered layers, from the glass surface plates to the interface altered layer-pristine glass, are obtained by the Tof-SIMS analysis13 of a zone free of salt deposits as far as possible.
Chemical characterization of the alteration products on the surface of glass plates are performed by EDX at low acceleration tension, by XRD14 on a X'Pert PRO PANalytical instrument using Cu-Kα radiation, and by micro-Raman spectroscopy on a Renishaw Invia spectrometer equipped with a Leica optical microscope.
9 Field electron gun – scanning electron microscopy
10 For the platinum layer deposition and the SEM observation, samples were submitted to a vacuum of about1 Pa and 5.10−5 Pa
respectively.
11 After the pronounced surface enrichment 12 Energy dispersive X-ray
13 See above for the operating conditions 14 X-ray diffraction
Hydration rate measurement
Hydration rate is measured on glass plates by EDX according to the original method described in Ref. [10]. This local measurement corresponds to the water content that has not been evaporated under vacuum, i.e tightly bound water. For a comparison, global measurements on glass powders by TGA15 analysis are performed on a NETZCH STA449 F3 Jupiter equipment, considering that the tightly bound water disappears between about 150 and 500 °C [13]. About 150 mg of powder are put in an alumina crucible and heated from 20 °C to 900 °C (10 °C/min) then cooled to room temperature with the same rate, under nitrogen flux. The TGA measurements are corrected for a baseline that is separately measured using an empty crucible.
Furthermore, transmission FTIR16 spectroscopy is used to compare the hydration rate of different glass plates after a V test. The spectra are recorded on a Bruker Tensor27 infrared spectrometer, in absorbance mode in the range 4000-2200 cm-1 to observe the -OH stretching bands of water molecules and Si-OH groups (3700-2500 cm-1). As the posterior face of the glass plates hydrates also during ageing test, this face is scratched prior FTIR analysis to remove its contribution. The resolution is 10 cm-1, with 100 sample scans and 100 background scans. The spectra are recorded with OPUS software.
Structural studies
Structural modifications of the glass on the atomic scale are studied by the mean of solid-state NMR17 spectroscopy on pristine and bulk altered powder18. 1H, 23Na, 27Al and 29Si magic-angle spinning (MAS) NMR spectra19 are collected on Bruker Avance I and Avance II spectrometers operating at magnetic fields of 7.02 T (300WB) and 11.72 T (500WB), respectively. For these experiments, about 100 mg of a sample is packed in 4 mm outer diameter ZrO2 rotor, and spun from 10 kHz (7.02 T) to 12.5 kHz (11.72 T) using Bruker CPMAS probes. Recycle delay applied for the complete relaxation of nuclear magnetizations is about 1 s for 1H, 23Na and 27Al nuclei and from 20 to 200 s for the 29Si nucleus. 1H spectra are acquired using the Hahn echo pulse sequence (90- TE-180-TE-Acq) with a rotor-synchronized echo delay TE. 29Si MAS spectra are recorded using the CPMG20 sequence to reduce the times of acquisition to a few tens of seconds. 29Si CP21MAS experiments (polarization transfer 1H→29Si) are performing with contact times of about 1 ms. In this paper, we employ the Qn notation [14] to describe the structure of the silicate network at short distance.
PHENOMENOLOGY OF THE ATMOSPHERIC ALTERATION 1. Results on glass A
In this section, we focus on one glass composition (A) to study the ageing temperature effects on the phenomena prior to discussing the mechanisms.
Altered layer morphology
The main morphological features of the altered layers of glass A are compared in Table 2 for our two extreme ageing temperatures (80 °C and 40 °C), from the macro- and microscopic observations of the glass plate surfaces and edges after the V tests (at t1 time and afterwards). A striking difference is related to the formation of salt deposits on glass surface: based on our observations at t1 time, while any salt is formed during the V tests at 80 °C, 85% RH (ranging from
15 Thermogravimetric analysis
16 Fourier-Transform Infrared Spectroscopy 17 Nuclear magnetic resonance
18 i.e altered throughout the thickness of grains
19 Chemical shifts referenced using a tetramethylsilane (TMS) sample for 1H and 29Si, an aqueous solution of NaCl for 23Na and an
aqueous solution of AlNO3 for 27Al 20 Carr-Purcell-Meiboom-Gill 21 Cross-polarization
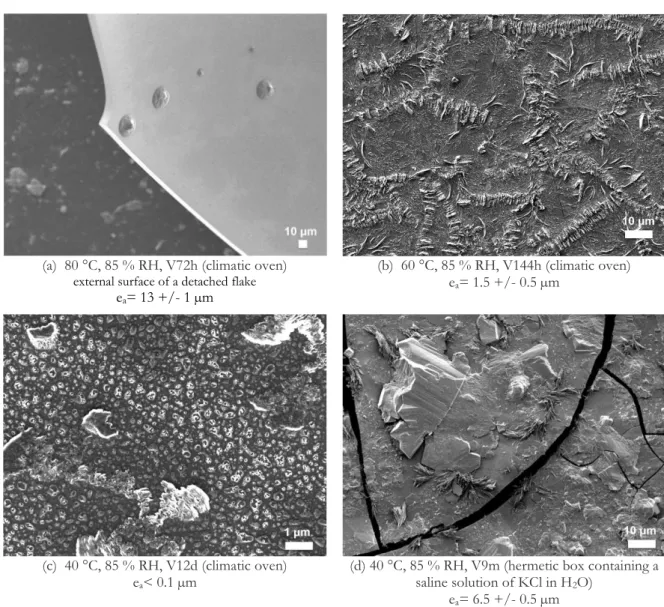
V6h to V144h), even when flakes of more than 10 µm tick are formed (Fig. 1(a)), Na and Ca carbonates precipitate22 during the V tests at 40 °C, 85% RH (ranging from V12d to V9m), so even when the altered layer is less than 100 nm (Fig. 1(c)). This precipitation at 40 °C is increasing with the V time until a continuous layer of precipitates forms above the altered layer, as shown on Figure 1(d) for a V9m test. Note that the formation of Na and Ca carbonates occurs also at 60 °C, 85% RH, as evidenced at t1 time after a V144h test (Fig. 1(b)), namely the same V time of our longer V test at 80 °C.
The progressive appearance and the growth of Na carbonates on the glass plates that have undergone a V test at 80 °C are put in evidence when plates are left under ambient atmosphere23, from the first hours after t1 and over the first months thereafter [10]. Their quantity are shown dependent of the V times. On the contrary, no evolution of the glass plate surfaces that have undergone a V test at 40 °C is observed after t1.
Whatever the ageing temperature, altered layers appear monolithic on the SEM scale and the flaking phenomenon occurs for altered layers about 2 µm thick and greater, in the region near the interface24, resulting probably from the strains induced by the evaporation of the “freest” water at the end of the V tests.
(a) 80 °C, 85 % RH, V72h (climatic oven)
external surface of a detached flake
ea= 13 +/- 1 µm
(b) 60 °C, 85 % RH, V144h (climatic oven) ea= 1.5 +/- 0.5 µm
(c) 40 °C, 85 % RH, V12d (climatic oven) ea< 0.1 µm
(d) 40 °C, 85 % RH, V9m (hermetic box containing a saline solution of KCl in H2O)
ea= 6.5 +/- 0.5 µm
Figure 1 – Surface states of glass plates A immediately after a V test (t1 time) at 80 °C (a), 60 °C
22 From EDX analysis. Only the calcium carbonate polymorphs calcite and vaterite are identified (DRX, micro-Raman) 23 From EDX analysis. Only the mineral trona (Na(CO3).2H2O) is identified (DRX)
(b) or 40 °C (c, d). SEM images. ea: altered layer thickness
80 °C 40 °C
t1 - No salt deposits
- Crizzling for V times of 48 h and more
- Flaking for V times of 72 h and more, in the region near the interface altered layer–pristine glass - Flakes poorly adherent to the
underlying glass
- Good homogeneity of the altered layer thickness
- Good homogeneity of the altered layer microtexture (SEM scale)
- Presence of Ca and Na carbonates (mainly Ca)
- Crizzling for V times of 3 months and more
- Flaking for V times of 6 months and more, in the region near the interface altered layer–pristine glass - Flakes more strongly adherent to
the underlying glass
- Good homogeneity of the altered layer thickness
- Good homogeneity of the altered layer microtexture (SEM scale) after t1 Progressive appearance and growth of
Na carbonates on the altered layer surfaces (from the first hours after t1)
No evolution
Table 2 – Comparison of the morphology of the altered layers of glass A after a V test at 80 °C or at 40 °C (85 % RH), at t1 time or after (during the 6 months period under ambient
atmosphere)
Altered layer composition
At 80 °C, 85 % RH, based on EDX analysis at t1 time, the surface and the sub-surface of glass A hydrate significantly and homogeneously in depth during the V tests (about 10 % wt of tightly bound water25) without depleting in alkalis nor in alkaline-earth elements [10]. A limited depletion in Na is measured afterwards into the altered layers (about 28 % at t1+ 6 months), in coherence with the progressive appearance of Na carbonates under ambient atmosphere, but no K nor Ca depletion.
At 60 °C, 50 °C or 40 °C, 85 % RH, tightly bound water content into the altered layers is also evaluated close to 10 % wt., both by EDX on plates and TGA on powders. As expected from the morphological study, compositional analysis of these altered layers (EDX and Tof-SIMS) show systematically a limited depletion in Na, an almost complete depletion in Ca and no K depletion26. Thus, at these ageing temperatures, the extraction of Na and Ca from the glass takes place together with the glass hydration, unlike at 80 °C.
Altered layer structure
V tests at 80 °C, 85 % RH cause a strong depolymerization of the silicate network of glass A with the insertion of a significant proportion of tightly bound –SiOH groups and molecular water, homogeneously distributed together with Na+ ions on a small scale, forming a hydrated solid phase, as detailed in Ref. [10] from 1H, 23Na and 29Si NMR studies.
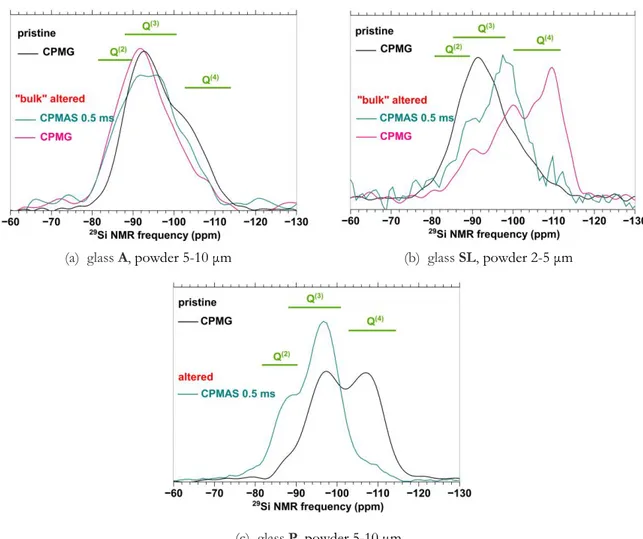
For a V test at 40 °C, 85 % HR, the comparison of the 29Si CPMG NMR spectrum of the bulk altered powder with the spectra of the pristine glass on Figure 5(a) put in evidence the disappearance of Q4 species and the formation of Q3 and Q2 species with the alteration. The shift
25 Water content determined by EDX on plates is consistent with TGA results on bulk altered powders
of the main signal around -94 ppm towards higher chemical shifts could be related to the substitution of alkali and alkaline-earth elements by protons in Q3 units, in coherence with the partial removal of these elements during the V test. On the 29Si CPMAS spectrum acquired with a short contact time of 0.5 ms (Fig. 5(a), turquoise curve), the contributions of Q3 and Q2 units are observed. In particular, the contribution of Q3 species from the glass around -94 ppm (Q3 bond to a modifier cation) is present, what suggest an immediate vicinity between these units and the hydrated species, and a particularly effective magnetization transfer between them. Note that similar 29Si NMR spectrum are obtained for a V test at 60 °C or 50 °C, 85 % RH. Thus, the depolymerization of the silicate network of glass A is predominant whatever the ageing temperature in the range 40°C-80 °C, at 85 % RH.
(a) 80 °C, 85 % RH, powder 32-50 μm, V72h (climatic oven).
Bulk alteration checked by 23Na MAS NMR.
(b)
(c) 40 °C, 85 % RH, powder 5-10 μm, V6m (hermetic box containing a
saline solution of KCl in H2O).
Bulk alteration checked by 27Al MAS NMR.
(d)
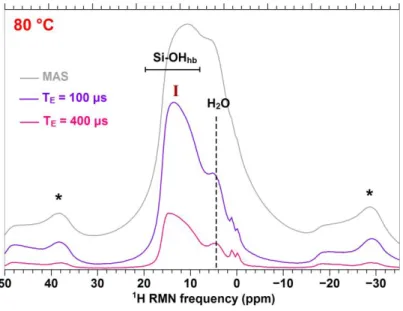
Figure 2 – (a) and (c) 1H RMN spectra of bulk altered powder of glass A obtained in direct acquisition (MAS) or by varying the echo delay (TE). hb: H-bonded. (b) and (c) possible structural
% RH and 80 °C, 85 % RH respectively, depicting two different chemical environments for the silanol groups (I and II).
Consequently, silanol groups are present in a significant proportion into the altered layers, as confirmed by 1H NMR experiments. The latter are preforming by varying the echo delay T
E to discriminate the contributions of silanol groups from the ones of water molecules27. Only one contribution, around +14 ppm, is attributed to –SiOH groups on the 1H NMR spectra of the powder aged at 80 °C (marked I on Fig. 2(a)) while an additional contribution, around + 10 ppm, is discriminated on the spectra of the powders aged at 40 °C (marked II on Fig. 2(c)). This latter band should correspond to silanol groups which are not in the direct vicinity of modifier cations. An intense spinning sidebands manifold is observed on Figure 2(a) and 2(c) also (marked (*)), revealing strong homonuclear 1H dipolar couplings: the proton network appear particularly dense
into the altered layers, with strongly H-bound hydrated species (–SiOH and H2O), for both ageing temperatures. From these results, we propose different structural configurations for the altered layer according to the ageing temperature (80 °C, Fig. 2(b) or 40 °C, Fig. 2(d)), depicting two chemical environments for the silanol groups that we associate to the 1H NMR signals marked I and II on Figure 2.
Alteration kinetics
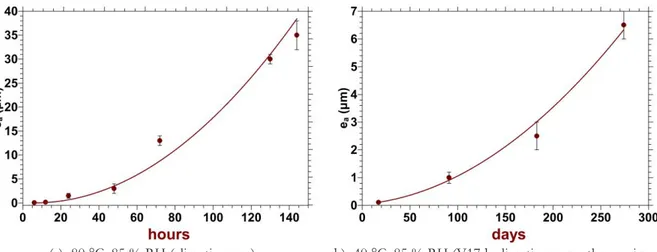
The kinetics of the atmospheric alteration of glass A are deduced at 80 °C and 40 °C from the measurement of the altered layer thicknesses as a function of the ageing times. As shown on Figure 3, these kinetics accelerate for both ageing temperatures over our periods of experiments.
Noticeably, x- and y-scales are very different on Figure 2(a) and 2(b). When approximating a linear velocity, the altered layer thickness would increase of approximately 6 µm/day at 80 °C and of about 24 nm/day at 40 °C. Thus, the atmospheric alteration of glass A shows a non-arrhenian behavior and is strongly thermally activated.
(a) 80 °C, 85 % RH (climatic oven) b) 40 °C, 85 % RH (V17d: climatic oven, other ageing
durations: hermetic box containing a saline solution of KCl in H2O)
Figure 3 – Altered layer thicknesses (ea) of glass A as a function of the ageing duration (numerical values are reported in Table 3). The lines are a guide for the eyes.
80 °C
6 h 12 h 24 h 48 h 72 h 130 h 144 h
ea (µm) 0.055 ±
0.01 * 0.07 0.01 *± 1.5 ± 0.5 3 ± 1 13 ± 1 30 ± 3 35 ± 3
40 °C
17 d 3 m 6 m 9 m
ea (µm) 0.11 ± 0.01 * 1 ± 0.2 2.5 ± 0.2 6.5 ± 0.5
Table 3 – Altered layer thicknesses (ea) of glass A developed with V tests of various ageing durations at 80 °C or 40 °C, as determined by SEM observations or (*) from Tof-SIMS profiles
Proposal for a mechanism
To reconciliate our different observations according to the ageing temperature, we assume the following steps as being responsible for the development of the altered layers in our experimental conditions, for the glass A, after the sorption of water molecules on glass surface (about 2 nm at 85 % RH [15]):
H2O + Si-O-Na+ glass SiOH + Na+OH- (1)
Na+OH- + Si-O-Si SiOH + Si-O-Na+ (2)
H2O + Si-O-Si 2 SiOH (3)
In particular, at 80 °C, the hydrolysis of the silicate network (2) is supposed to be extremely rapid what would explain that Na+ and OH- ions have not the time to be efficiently solvated, in relation with the special properties of water into the hydrated solid phase. At lower temperature, the slowing down of the step (2) would let the time to Na+ and OH- ions to be solvated into the tightly bound water, what is consistent with our observations at 60 °C and lower ageing temperatures. The (re-)generation of Si-O-Na+ sites during the atmospheric alteration process would constitute the main difference with the alteration in immersion conditions28, when Na+ and OH- ions are solvated in a liquid phase and leached from the glass.
This mechanistic scheme for the atmospheric alteration would explain that water content is decorrelated from alkalis departure. Furthermore, the fact that more and more Si-O-Na+ sites are reached by water without being extracted from the glass may explain the acceleration.
2. Influence of the glass composition
In this section, we compare the main features of the altered layers of glass A, SL and P for a same V6m test at 40 °C, 85 % RH.
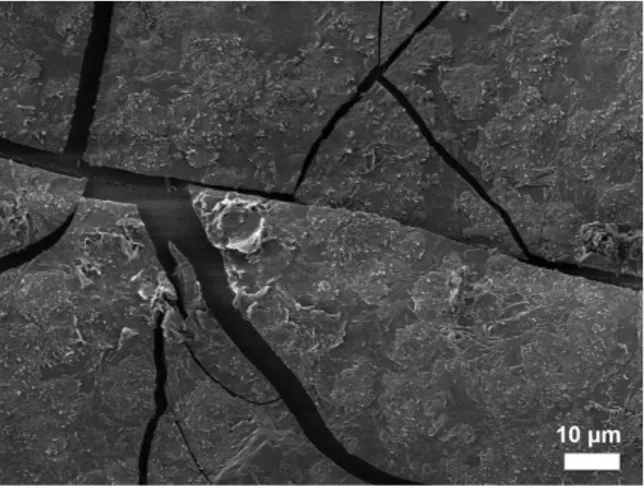
From the macroscopic and microscopic observations, the surface of glass A appear the most rugged (Fig. 4). As described in the former section29, the crizzled and delaminated altered layer, which is partially depleted in Na and almost totally in Ca, is covered by a continuous layer of Na and Ca carbonates (Fig. 4(a) and 4(b)).
The altered layer of glass P (Fig. 4(e) and 4(f)), whose thickness is comparable with that of glass A (about 2 µm), appear crizzled but not delaminated, with a lesser precipitation on its surface, as compared with glass A. These salts are mainly Ca carbonates, K,Na,Ca sulfates and deliquescent K carbonates, in coherence with the limited depletion in Na, K (~ 20 %) and Ca (~ 50 %) of the altered layer as shown by the ratio R/Si (R=Na, K, Ca) calculated from EDX analysis (Table 4, line
P V6m 15 kV).
As expected, the soda-lime composition SL is the one which degrades the least rapidly (ea ~ 350 nm). Its altered layer doesn’t show any sign of crizzling but is entirely covered by a peculiar facies of precipitation on its surface (Fig. 4(c) and 4(d)), consisting mainly of Ca carbonates and mixed Ca,Na,H-carbonates salts above a layer of reprecipitated SiO2 (from SEM-EDX analysis and Tof-SIMS profile, not shown). EDX analysis of the altered layer confirm its deep chemical modifications, which is completely depleted in Ca and strongly depleted in Na (~ 70 %) (Table 4,
28 Note that the hydrolysis reaction (3) ((1)+(2)) is well established for long in immersion conditions 29 Paragraph Altered layer morphology in the section Glass A
line SL V6m 7 kV, ratio R/Si, R=Na, K, Ca).
(a) glass A - surface (b) glass A – edge (flake)
ea= 2.5 +/- 0.2 µm (secondary electron mode)
(c) glass SL - surface (d) glass SL - edge
ea= 0.35 +/- 0.1 µm (secondary electron mode)
(e) glass P - surface (f) glass P - edge
ea= 2 +/- 0.2 µm (backscattered electron mode)
Figure 4 – SEM images of glass plates after an ageing test at 40 °C, 85 % RH, V6m (hermetic box containing a saline solution of KCl in H2O) (a), (c), (d) surface states, and (b), (d), (f) views on
O Na Mg Al Si K Ca calculated
O Na/Si K/Si Ca/Si HT
* wt% A pristine 59.55 7.58 0.42 0.33 25.22 4.98 1.90 59.55 0.30 0.20 0.075 - A V6m 7 kV 64.44 5.87 0.63 0.28 23.61 5.06 0.11 58.29 0.25 0.21 0.004 9 SL pristine 58.53 12.09 1.57 1.01 23.07 0.94 2.79 58.53 0.52 0.04 0.12 - SL V6m 7 kV 66.91 3.66 2.18 0.95 25.08 0.52 0.09 57.15 0.14 0.02 0.003 8.8 P pristine 61.16 1.05 0.11 0.13 27.45 9.33 0.78 61.16 0.04 0.34 0.03 - P V6m 15 kV 65.01 0.78 0.09 0.12 26.59 7.13 0.28 57.69 0.03 0.27 0.01 6.2
Table 4 – EDX average composition (atom% element with 100% normalization) of the altered layers thicknesses analyzed from glass surface plates (7 or 15 kV acceleration tension) after a V test (40 °C, 85 % RH, V6m). Pristine glasses (A, SL or P) are used as a standard and matrix effects are taken into account by using the data processing software STRATAGem. * Average
hydration rate (HT) in weight % estimated from the comparison between the oxygen atomic fraction analyses by EDX and the one calculated by stoichiometry (calculated O column). Ratios
R/Si (R=Na, K, Ca) are calculated from EDX results.
For the three glass compositions, altered layers are significantly enriched in tightly bound water according to EDX (Table 4, last column) and TGA analysis on bulk altered powders. However, by performing 1H NMR experiments, only the presence of molecular water as H bearing species is put in evidence for the glass SL (spectra not shown), while silanol groups, strongly H-bound to molecular water, appear in a significant proportion for glass A30 and glass P (spectra are very similar to those of glass A (Fig. 2(b)). In coherence with these results, 29Si NMR experiments on glasses A and P show clearly the depolymerization of the silicate network with the alteration (Fig. 5(a) and 5(c))31. For the glass SL on the contrary, the repolymerization is highlighted (Fig. 5(b)): the contributions of the altered powder on the CPMG spectrum (pink curve) are shifted to lower frequencies as compared to the signal of the pristine glass (black curve), what evidences the formation of Q4 species to the expense of Q3 and Q2 units. CPMAS experiment conducted with a short contact time of 0.5 ms (turquoise curve) reveals the species having the strongest heteronuclear coupling with protons, namely Q2 (around -90 ppm) and Q3 species (around -98 ppm), as expected.
To resume, the figure 6 compare the main features of the altered layers highlighted in this study, for the 3 glass replicas, after an ageing at 40 °C, 85 °C, V6m. It is worth to notice that the soda-lime composition, SL, stand out clearly from the two other ones. The much better chemical durability of this composition is certainly related to the peculiar chemical and structural reorganization of the altered layer. It is possible that the concomitant extraction of alkali ions and their counter ions (NBO or OH-) contribute to neutralize and stabilize the silicate network form hydrolysis, and promote also the silanol recondensation leading to the repolymerization of the silicate network. Thus, this composition would bring the necessary conditions for a faster maturation of the hydrated solid phase towards repolymerized silica. Inversely, the poor chemical
30 See Paragraph Altered layer structure in the section Glass A
durability of glass A and P could be related to the significant alkalis retention into their hydrated solid phase.
(a) glass A, powder 5-10 μm (b) glass SL, powder 2-5 μm
(c) glass P, powder 5-10 μm
Figure 5 – 29Si RMN spectra of pristine and bulk altered powders after an ageing test at 40 °C, 85 % RH, V6m (hermetic box containing a saline solution of KCl in H2O). Bulk alteration checked
by 27Al MAS NMR. The spectra are normalized to the same area.
e
a~ 2.5 µm
e
a~ 350 nm
e
a~ 2 µm
Micro
…
(a) glass A (b) glass SL (b) glass P
Figure 6 – Comparison of the chemical and structural properties of the altered layers of glasses A,
SL and P developed with a V6m test at 40 °C, 85 % RH. ADDITIONAL EXPERIMENTS
In this part, we introduce some experiments aiming to evaluate the influence of a rinsing step of the altered layer on the atmospheric alteration kinetics.
Each of these experiments is conducted on 2 batches of glass plates of the same composition, in 3 steps, which are detailed here for an ageing temperature of 80 °C: (1) pre-ageing of the 2 batches at 80 °C, 85% RH during 18 h (noted P18h test) - (2) immediately after the P18h test (t1 time), batch 1 is immersed in milliQ water at ambient temperature during 5 minutes, then carefully dried under air flux (T<40 °C), then conserved under ambient atmosphere during 1 day. Batch 2 is conserved under ambient atmosphere during 1 day from t1 time, without any rinse, for reference - (3) V24h test of the 2 batches (80 °C, 85 % RH).
In what follows, we detail the results obtained with the experiment at 80 °C on glass A. Notably, the rinse operation in step (2) causes the removal of a fraction of alkalis from the altered layer as shown by ICP-AES32 analysis of the rinsing water (~ 20 % and 10 % of Na+ and K+ ions respectively) [10]. At the end of the step (3), the surface states of the batch 1 appear far less altered on the macroscopic scale, with no sign of crizzling and a limited quantity of alteration products, as compared with batch 2. The reduction of the macroscopic manifestations suggest a benefit of the rinsing step on the reduction of the glass hydration kinetics, which is evaluated by transmission FTIR. On Figure 7, we observe an increase of the absorbance band associated to the –OH groups subsequent to the step (1) (brown curve compared to black curve), what confirms the hydration of the glass surface during the pre-ageing step. After the step (3), the signal of the batch 2 (pink curve) is significantly higher: hydration has restarted, following an accelerating kinetics33. Remarkably, the signal of batch 1 is in contrast almost unchanged after the step (3) (blue curve compared to brown curve): the rinse step seems to stop the alteration in our experimental conditions.
Note that we have also observed a strong diminution of the alteration kinetics at 40 °C (over several months of ageing) after a rinse step of the altered layers, and for the 3 glass replicas.
In connection with our study on the glass composition effect34, the removal of a fraction of alkalis and their counter-ion by the rinsing operation should contribute to stabilize the silicate network. In addition, rinse could promote a peculiar structural reorganization of the altered layer that enhance the chemical durability of glasses.
32 Inductively coupled plasma-atomic emission spectroscopy
33 By using the ΔE3300 method [17], and assuming a constant hydration rate into the altered layer, the altered layer thickness would
have quadrupled during the step (3)
34 See section Influence of the glass composition in part PHENOMENOLOGY OF THE ATMOSPHERIC
Figure 7 – Transmission FTIR spectra obtained from pristine and aged glass plates A (ageing at 80 °C, 85 % RH). Step (1): P18h test, Step (3): V24h test, Batch 1: rinsed, Batch 2, non rinsed.
CONCLUSION
In this study, we highlight some features of the glass atmospheric alteration, namely:
The formation of a hydrated solid phase which retains partially the alkalis, with strongly bound water and an homogeneous distribution of the hydrated species and the Na+ ions on a small scale,
The non-correlation between the quantity of alkaline and alkaline-earth salts that form on glass surface and the quantity of water that enter into the glass. In particular, at 80 °C, 85 % RH, the hydration of a mixed-alkali glass (A) occurs without any alkali or alkaline-earth depletion,
A strong influence of the temperature on the phenomena. Thus, when the issue to reproduce altered surfaces arises for studying a protective treatment for ancient glass objects, it appears of great importance to lower the ageing temperature of glass replicas, A strong influence of the glass composition on the compositions and structures of the
altered layers, and as a consequence on the glass durability. In particular, poorly glass durability seems to be related to strong alkalis retention.
To go further into the underlying mechanisms, it seems now necessary to investigate the effects of the glass composition, with systematical variations of composition. Indeed, our 3 compositions (A,
P and SL) differ in numerous parameters, what makes very difficult the rationalization of the glass
composition effects on the mechanisms. The effects of the extrinsic parameters RH % and concentration in pollutant gas (CO2, SO2, formic acid…) should also be evaluated. Furthermore, it appears very important to study the altered layer on the nanometer scale corresponding to the scale of porosity.
Lastly, we emphasize on a striking and very interesting effect of the rinse of the altered layers on the reduction of the alteration kinetics, put in evidence after an ageing at 80 °C or at 40 °C (85% RH) and for our 3 glass replicas. Deeper experimentations should be now performed, notably to study the modifications induced by the rinse on a small scale, in order to evaluate the potentiality of a rinsing/washing step as an efficient way to protect glass against atmospheric alteration.
ACKNOWLEDGEMENTS
The authors gratefully thank PSL Research University for the funding of this work, Marie-Hélène Chopinet, Sophie Papin and Kamila Plevacova (Saint- Gobain Recherche, France) for the glass fabrication. Mélanie Moskura (NIMBE, CEA) is acknowledged for her help in conducting the NMR experiments.
REFERENCES
[1] B. Cobo del Arco, «Survey of the national museums of scotland glass collection,» chez
Conservation of Glass and Ceramics, London, Norman H. Tennent, 1999, pp. 229-238.
[2] V. Oakley, «Five years on: a reassessment of aspects involved in the conservation of glass objects for a new gallery at the Victoria and Albert Museum,» chez Conservation of Glass and
Ceramics, London, Norman H. Tennent, 1999, pp. 217-228.
[3] F. Burghout et M. Slager, «Cloudy Patches and Misty Glass: Early Signs of Glass Disease?,» chez Recent advances in Glass, Stained-Glass, and Ceramics Conservation, Römich, H. and Van Lookeren, K., 2013, pp. 327-329.
[4] A. Shortland, L. Schachner, I. Freestone et M. Tite, «Natron as a flux in the early vitreous materials industries: Sources, beginnings and reasons for decline,» Journal of Archeological
[5] S. Lagabrielle, «La verrerie du XIIe à la fin du XVe siècle : évolution d'une technique,»
Médiévales, vol. 19, pp. 57-78, 2000.
[6] J. J. Kunicki-Goldfinger, «Unstable historic glass: symptoms, causes, mechanisms and conservation,» Reviews in Conservation, vol. 9, pp. 47-60, 2008.
[7] J. L. Ryan, The atmospheric deterioration of glass: studies of decay mechanisms and conservation, PhD Thesis: Imperial College -University of London, 1995.
[8] M. Verita, «Modern and ancient glass: nature, composition and deterioration mechanisms.,» chez The Materials of Cultural Heritage in their Environment, Bari edipuglia, 2006, pp. 119-132. [9] R. H. Brill, «The morphology of wheatering on historical glasses,» Rivista della Stazione
Sperimentale del Vetro, vol. 6, pp. 7-8, 2000.
[10] F. Alloteau, Lehuédé, P., Majérus, O., Biron, I., Dervanian, A., Charpentier, T. et Caurant, D., «New insight into atmospheric alteration of alkali-lime silicate glasses,» Corrosion science, vol. 122, pp. 12-25, 2017.
[11] L. Greenspan, «Humidity fixed points of binary saturated aqueous solution,» Journal of
Research of the National Bureau of Standards Section A: Physics and Chemistry, vol. 81A, p. 89, 1977.
[12] L. Riciputti, Elam, J.M., Anovitz, L.M. et Cole, D.R., «Obsidian diffusion dating by secondary ion mass spectrometry: a test using results from Mound 65, Chalco, Mexico,»
Journal of Archeological Science, vol. 29, pp. 1055-1075, 2002.
[13] J. Barton et Guillemet, C., Le verre, science et technologie, Paris: edp sciences, 2005. [14] B. Mysen et Frantz, J.D., «Silicate melts at magnetic temperature: in-situ structure
determination to 1651°C and effect of temperature and bulk composition on the mixing behavior of structural units,» Contribution to Mineralogy and Petrology, vol. 117, pp. 1-14, 1994. [15] D. Asay et Kim, S.H., «Evolution of the adsorbed water layer structure on silicon oxide at
room temperature,» Journal of Physical Chemistry B, vol. 109, pp. 16760-16763, 2005.
[16] C. Bronnimann, Zeigler, R.C. et Maciel, G.E., «Proton NMR study of dehydratation of the silica gel surface,» Journal of the American Chemical Society, vol. 110, pp. 2023-2026, 1988. [17] D. Fuchs, Römich, H. et Schmidt, H., «Glass sensors: assessment of complex corrosive
stresses in conservation research,» Materials issues in art and archaeology, vol. 185, pp. 239-251, 1991.