HAL Id: hal-00317286
https://hal.archives-ouvertes.fr/hal-00317286
Submitted on 2 Apr 2004
HAL is a multi-disciplinary open access
archive for the deposit and dissemination of
sci-entific research documents, whether they are
pub-lished or not. The documents may come from
teaching and research institutions in France or
abroad, or from public or private research centers.
L’archive ouverte pluridisciplinaire HAL, est
destinée au dépôt et à la diffusion de documents
scientifiques de niveau recherche, publiés ou non,
émanant des établissements d’enseignement et de
recherche français ou étrangers, des laboratoires
publics ou privés.
plasma
S. E. Pryse, R. W. Sims, J. Moen, L. Kersley, D. Lorentzen, W. F. Denig
To cite this version:
S. E. Pryse, R. W. Sims, J. Moen, L. Kersley, D. Lorentzen, et al.. Evidence for solar-production
as a source of polar-cap plasma. Annales Geophysicae, European Geosciences Union, 2004, 22 (4),
pp.1093-1102. �hal-00317286�
Annales Geophysicae (2004) 22: 1093–1102 SRef-ID: 1432-0576/ag/2004-22-1093 © European Geosciences Union 2004
Annales
Geophysicae
Evidence for solar-production as a source of polar-cap plasma
S. E. Pryse1, R. W. Sims1, J. Moen2,3, L. Kersley1, D. Lorentzen3, and W. F. Denig41Department of Physics, University of Wales, Aberystwyth, Ceredigion SY23 3BZ, UK 2Department of Physics, University of Oslo, P.O. Box 1048 Blindern, N-0316, Oslo, Norway 3Arctic Geophysics, University Centre on Svalbard, N-9170, Longyearbyen, Norway
4Space Vehicles Directorate, Air Force Research Laboratory, Hanscom, MA 01731-3010, USA
Received: 10 March 2003 – Revised: 2 August 2003 – Accepted: 4 September 2003 – Published: 2 April 2004
Abstract. The focus of the study is a region of enhanced
ionospheric densities observed by the EISCAT Svalbard radar in the polar F-region near local magnetic noon under conditions of IMF Bz<0. Multi-instrument observations, us-ing optical, spacecraft and radar instrumentation, together with radio tomographic imaging, have been used to identify the source of the enhancement and establish the background ionospheric conditions. Soft-particle precipitation was ruled out as a candidate for the production. Tomographic observa-tions identified a latitudinally restricted region of enhanced densities at sub-auroral latitudes, distinct from the normal mid-latitude ionosphere, which was likely to be the source. The evidence suggested that the increased sub-auroral densi-ties were photoionisation produced at the equatorward edge of the afternoon high-latitude cell, where the plasma is ex-posed to sunlight for an extended period as it flows slowly sunward toward magnetic noon. It is proposed that this plasma, once in the noon sector, was drawn antisunward by the high-latitude convection toward polar latitudes where it was identified by the EISCAT Svalbard radar. The observa-tions are discussed in terms of earlier modelling studies of polar patch densities.
Key words. Ionosphere (polar ionosphere; plasma
temera-ture; plasma convection)
1 Introduction
The polar-cap ionosphere is a highly structured medium comprising irregularities in plasma density of a variety of scale sizes. The current study is concerned with lo-calised regions of enhanced density on horizontal scales of ∼100−1000 km in the F region, known as polar patches, with particular interest being to establish the source of the ionisation. The patches were originally identified by iono-spheric sounders, with the associated airglow being observed
Correspondence to: S. E. Pryse
by all-sky imaging photometers (Buchau et al., 1983; We-ber et al., 1984). The density enhancements and associated effects have since been studied by a variety of experimen-tal techniques including incoherent scatter radar (Pederson et al., 1998), radio tomography (Walker et al., 1999), HF radar (Ogawa et al., 1998) and radio scintillation (Buchau et al., 1985), although comparisons of features observed by ent techniques are not always straightforward, with differ-ent techniques involving differing criteria to define a patch. An extensive review of the polar-cap plasma structure has been given by Crowley (1996), who defined a patch as hav-ing a horizontal spatial dimension of at least 100 km and a density of at least two-fold above background level. Po-lar patches occur predominantly under conditions of IMF Bz negative (McEwan and Harries, 1996) and drift anti-sunward across the polar cap at speeds of typically 300–1000 m s−1. They have been observed in both summer and winter at sunspot maximum and minimum (Buchau and Reinisch, 1991) and have been seen in geomagnetically conjugate re-gions (Rodger et al., 1994a). The origin of patch ionisation and the structure remain open to question. Most of the pro-posed mechanisms for patch production rely on the trans-port of ionisation from lower latitudes into the cusp region, with subsequent structuring into patches. Photoionisation at lower latitudes has been cited as a potential plasma source with the plasma being entrained into the polar cap by the high-latitude convection pattern. Patch densities compara-ble to those at dayside sub-auroral latitudes were reported by Buchau et al. (1985), with the observations of Valladares et al. (1994), suggesting that the plasma was being convected in a tongue-of-ionisation (TOI) from sub-auroral latitudes into the polar cap. The modelling studies of Sojka et al. (1994) have indicated the presence of patches in all seasons but with an occurrence that is modulated by UT. A subsequent study by Bowline at al. (1996) discusses the dependency of the UT modulation on the observing location. Soft-particle precipi-tation in sub-polar regions has also been cited as a possible source for patch ionisation, with the less energetic incom-ing particles givincom-ing rise to enhanced density at high altitudes,
Longyearbyen 20
December 1998 Az. 181 El. 82
2.00 1.05 0.10 Ne (x1011 m-3) 3500 2250 1000 Te (K) Time UT A lt it u d e ( k m ) 0700 0700 0800 0800 0900 0900 1000 1000 600 600 400 400 200 200Fig. 1. Electron densities (upper panel) and electron temperatures (lower panel) measured by the ESR radar between 07:00 UT and 10:00 UT
on 20 December 1998.
where the lifetime of plasma is sufficiently long for it to be transported over the polar cap. In this instance, it is likely that spatial resonance between the plasma convection and the precipitation region is required to allow sufficient time for the build-up of ionisation to patch levels. Weber et al. (1984) noted that there might be sufficient time for the plasma build-up if sunward convecting flux-tubes move along the cusp re-gion for tens of minutes before turning antisunward into the polar cap.
The formation of patch structure is also an open question, with several mechanisms being cited. For solar-produced plasma, modelling work by Sojka et al. (1993) showed that the break-up could occur by shearing of the TOI arising from temporal changes in the By component of the interplanetary magnetic field (IMF). Rodger et al. (1994b) suggested that enhanced recombination rates for plasma loss, accompany-ing high-velocity flow channel events, could fragment the ionisation. Earlier, Anderson et al. (1988) had suggested that an expansion of the convection throat of the polar cap into a region of solar ionisation at lower latitudes and then its subsequent contraction, could directly give rise to a patch structure that was drawn to the higher latitudes. A variation by Lockwood and Carlson (1992) proposed that the
expan-sion of the polar convection was controlled by pulsed recon-nection at the magnetopause or flux transfer events. Experi-mental evidence for precipitation-produced plasma enhance-ments with characteristics of polar patches was presented by Walker et al. (1999), who showed that soft precipitation had played an important role in the direct formation of struc-tured plasma at high altitude. In a subsequent study, Smith et al. (2000) suggested that the structuring of plasma was linked to a variation in the IMF configuration and hence, to the lo-cation of the magnetopause reconnection site and the energy distribution of the precipitating particles. Observations near winter solstice by Nielsen et al. (2003) showed density struc-tures in the pre-noon sector formed by a combination of local precipitation and photo-production, and patches of photoion-isation near magnetic noon that had been transported from lower latitudes.
The case study presented here is concerned with the ori-gin of the ionisation in a polar enhancement, rather than the mechanism for the fragmentation of the plasma into patches. Multi-instrument observations have been used to establish background ionospheric conditions and to identify the source of a region of enhanced density observed by the EISCAT Svalbard radar (ESR) near magnetic noon. The observations
S. E. Pryse et al.: Evidence for solar-production as a source of polar-cap plasma 1095
Ny Aalesund MSP 20 December 1998
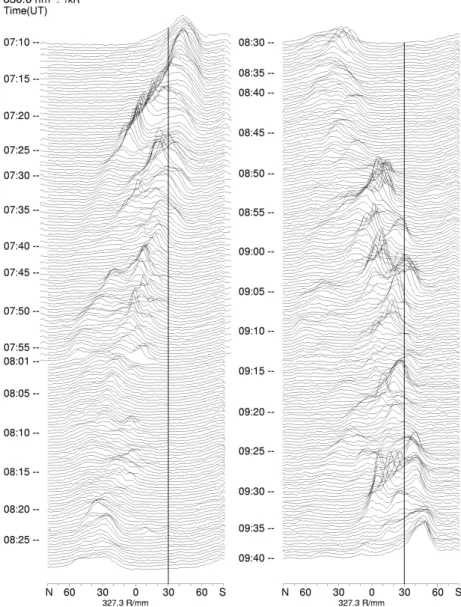
Fig. 2. Intensity of the 630.0 nm (red-line) auroral emission measured by the MSP at Ny ˚Alesund from 07:10 UT to 09:40 UT, on 20
December 1998, as a function of zenith angle. The dark line near 30◦S of zenith shows the latitudinal location of the ESR radar mapped into the zenith angle scale.
were made in the Svalbard region near winter solstice on 20 December 1998, when the general geomagnetic conditions were moderate with Kp=3−. In this particular instance, the effects of photo-production and precipitation could be sepa-rated, which is often not possible as the two processes com-pete in a common region.
2 Experimental observations
2.1 Electron density at polar latitudes
During the time of interest, spanning local magnetic noon, the EISCAT Svalbard incoherent scatter radar (ESR) at 78.2◦N, 16.1◦E (75.0◦MLAT, 113.1◦MLON) was making
measurements with the beam aligned along the geomagnetic field in the F region. The upper panel of Fig. 1 shows the electron densities measured by the radar between 07:00 UT and 10:00 UT, processed using a post-integration time of 60 s. Magnetic noon is broadly coincident with 09:00 UT. The density distribution throughout the interval shows evi-dence of multiple structures at various altitudes, but of partic-ular interest to the study is the density enhancement between 08:45 UT and 09:00 UT. This feature has a sharp bottomside edge at about 250 km with a more diffuse topside extend-ing above 400 km. The peak density at an altitude of some 300 km, has a maximum value of 1.4×10¹¹m−3at 08:50 UT. The aim of the current study is to identify the source of this enhanced ionisation.
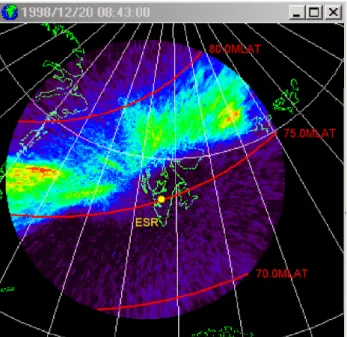
Fig. 3. Intensity of 630.0 nm (red-line) emission measured by the
all-sky camera at Longyearbyen at 08:43 UT, 20 December 1998, representative of the time period of interest. The white traces show the geographic grid, while geomagnetic latitudes are shown by the superimposed red curves. The intersection of the ESR radar beam with an altitude of 220 km is indicated by the yellow dot near 75◦MLAT.
2.2 Soft-particle precipitation 2.2.1 EISCAT Svalbard radar
The electron temperatures measured by the ESR radar are shown in the lower panel of Fig. 1. Two regions with tem-peratures in excess of 3500 K extending down to the lower F-region can be identified, indicative of soft-particle precip-itation. The first occurs from the start of the interval to 07:40 UT, while the second extends from 09:00 UT to the end at 10:00 UT. The centre period between 07:40 and 09:00 UT shows no pronounced electron heating. The plasma feature of interest between 08:45 UT and 09:00 UT occurred during this centre period of low electron temperatures and was thus not being produced locally by in-situ precipitation.
2.2.2 Meridian Scanning Photometer
Additional information on the latitudinal structure of soft precipitation can be inferred from observations by a meridian scanning photometer (MSP) located at Ny ˚Alesund (78.9◦N, 12.0◦E), slightly north of the ESR radar. The instrument measures line-of-sight intensities of auroral 630.0 nm red-line and 557.7 nm green-red-line emissions as a function of el-evation, essentially along the magnetic meridian with a scan duration of 16 s. The greline observations relate to en-ergetic electrons (∼keV) that penetrate to E-layer altitudes, while the red-line is indicative of softer precipitation (∼ few hundred eV) of relevance to the current study. Figure 2 shows
-8 07:00 07:30 08:00 08:30 09:00 09:30 10:00 Time (UT) 0 -4 4 0 0 -4 -8 Bx (n T ) By (n T ) Bz (n T ) WIND IMF 20/12/98
Fig. 4. The three components of the IMF measured by the WIND
spacecraft located in the solar wind, between 07:00 and 10:00 UT on 20 December 1998.
the distribution of the intensity of the red-line as a function of elevation between 07:10 UT and 09:40 UT. The latitudi-nal position of the ESR radar field-of-view has been mapped onto the figure, and is illustrated by the dark line near 30◦S of zenith for an assumed emission altitude of 220 km. At the start of the interval the maximum intensity is marginally south of the ESR location. A succession of poleward moving auroral forms can be identified at this time by the rapid pole-ward movements of the emission maximum breaking away from the equatorward edge of the underlying emission. How-ever, there is also a gradual trend in the location of the gen-eral emission, revealed most clearly by the equatorward edge of the enhanced intensities. At 07:10 UT the activity was mostly equatorward of the ESR radar, but by about 07:40 UT, it was entirely poleward of the radar, reaching its most pole-ward location broadly between 08:25 UT and 08:45 UT. Fol-lowing a period north of the radar with diminishing intensity, the emission intensified and advanced equatorward returning to the ESR field-of-view marker near 09:00 UT. By the end
S. E. Pryse et al.: Evidence for solar-production as a source of polar-cap plasma 1097 of the interval the maximum intensity had returned to
eleva-tions equatorward of the ESR. Between 08:45 UT and 09:00 UT there was no evidence of red-line aurora or soft-particle precipitation above ESR.
2.2.3 All-sky camera
The location of the red-line emission at the time of inter-est can also be seen in the all-sky camera observations at Longyearbyen (78.2◦N, 15.3◦N). Figure 3 shows an all-sky image for red-line emissions at 08:43 UT, which is typical of the time period. The white grid relates to geographic co-ordinates, whilst geomagnetic latitudes are shown by the su-perimposed red curves. The intersection of the ESR radar beam with an altitude of 220 km is indicated by the yel-low dot near 75◦MLAT. A band of emission containing fine structuring is seen extending in longitude across the field-of-view. The latitudinal location is clearly north of ESR, with no optical manifestation at magnetic latitudes equatorward of the ESR radar, except for a very weak emission at the west-ern extreme of the field-of-view. Taken together, the optical observations all support that there was no soft-particle pre-cipitation above or equatorward of the radar at the time of the plasma enhancement.
2.3 Interplanetary magnetic field
The latitudinal movements in the MSP 630.0 nm emissions reflect the changes in the Bz component of the interplan-etary magnetic field (IMF). Figure 4 shows the compo-nents of the IMF measured by the WIND spacecraft be-tween 07:00 and 10:00 UT upstream in the solar wind at (39.0, −58.4, 14.0)Re. The most significant changes oc-cur in the Bz component, with a gradual increasing trend from −6 to −1 nT broadly between 07:00 and 08:25 UT, followed by a period of reasonably constant magnitudes of −1 to −2 nT between about 08:25 UT and 08:45 UT, and subsequently, a steep decrease to −7 nT between 08:45 and 09:10 UT. Hence, the trend in the location, of the equator-ward edge of the MSP red-line emission, with initial gradual poleward motion to its northernmost location, followed by a more rapid equatorward return, follows the broad trends in the Bzcomponent as the polar cap contracts and then ex-pands.
During the time of interest, the solar wind speed was rea-sonably constant at about 420 km s−1, so that a simple calcu-lation indicates a delay of some 10 min for the manifestation of the effects of the IMF on the ionospheric plasma. Com-parisons of the time of the minimum magnitude of Bz with that of the most poleward position of the MSP emissions in-dicates that the two correspond more closely than the antic-ipated delay. However, geometrical considerations suggest that this can be attributed to the spacecraft location, with its relatively large displacement from the Earth in the negative Y direction, and the angle of the approaching IMF. It is thus possible that the spacecraft and the dayside ionosphere expe-rienced the IMF and its effects, almost simultaneously.
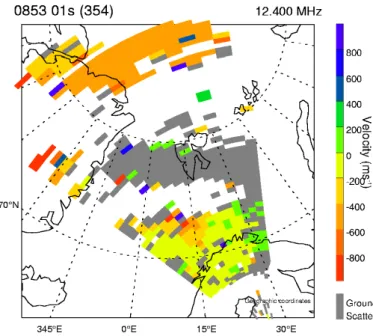
Fig. 5. Line-of-sight velocity components measured by the UK
Su-perdarn radar (CUTLASS) located in Finland on a geographic co-ordinate grid at about 08:53 UT on 20 December 1998. The illus-trated flows are representative of the broader time interval of interest between 08:45 UT and 09:00 UT.
2.4 Plasma flow 2.4.1 CUTLASS
With Bz<0 and By small and positive antisunward plasma flow would be expected into the polar cap from a throat re-gion that is rotated towards the dawn sector of the magnetic noon meridian. Experimental support was provided by the CUTLASS Superdarn radar. Figure 5 shows the line-of-sight velocities measured by the Finland radar on a geographic co-ordinate grid at about 08:53 UT that are representative of the interval between 08:45 UT and 09:00 UT. The grey region above Svalbard indicates ground scatter, but to the north, within the polar cap, velocities away from the radar were measured in excess of 400 m s−1. Antisunward compo-nents were also observed between 67◦N and 74◦N that were generally less than 200 m s−1, with the exception of a small region centred on 15◦E, where the values were larger. 2.4.2 DMSP
Further support for the anticipated flow pattern was pro-vided by measurements made by the F13 satellite of the Defence Meteorological Satellite Programme (DMSP). The satellite followed an essentially east-to-west path north of the ESR field-of-view, reaching a maximum latitude of about 77◦MLAT and crossing the magnetic noon meridian at about 08:52 UT. The cross trajectory horizontal plasma flow velocities are shown in the bottom panel of Fig. 6. The generally negative values between 08:50 UT and 08:54 UT, infer that the plasma drift had an antisunward component as the satellite traversed the noon magnetic sector (10–14 MLT).
102 103 104 102 103 104 108 102 103 104 Ion Ele -3000 0 3000 Sunward Antisunward HOR-C 105 107 109
ELECTRON FLUX eV/(cm 2 s sr eV) 103 105 107 ION FLUX eV/(cm 2 s sr eV)
F13
M/SEC20 Dec 1998
ENERGY (eV) Electrons Ions eV 1/(cm 2 s sr) 31680 8:48 72.1 15.5 31740 8:49 74.2 15.0 31800 8:50 75.9 14.2 31860 8:51 76.9 13.4 31920 8:52 77.3 12.4 31980 8:53 76.8 11.4 32040 8:54 75.7 10.6 32100 8:55 73.9 9.90 32160 8:56 71.6 9.30 32220 8:57 69.1 8.90 UT(SEC) HH:MM MLAT MLTFig. 6. Particle data and horizontal cross trajectory plasma flow velocities measured by the F13 satellite of the Defence Meteorological
Satellite Programme (DMSP) along an essentially east-to-west geomagnetic path, crossing the noon meridian at about 08:52 UT on 20 December 1998.
Ionospheric latitude (degrees)
T o ta l e le c tr o n c o n te n t (x 1 0 1 6 m -2 )
Total electron content for satellite pass 0810UT 20 December 1998
0.0 2.0 4.0 6.0 8.0 10.0 12.0 14.0 16.0 18.0 20.0 60.0 65.0 70.0 75.0 80.0 85.0 90.0
IONOSPHERIC LATITUDE (DEGREES) EQUIVALENT VERTICAL TEC (35408_10: 66-82)
Ny Alesund Longyearbyen Bjornoya Tromso
Fig. 7. Latitudinal variation in the equivalent vertical total electron content measured at four sites in northern Scandinavia during a satellite
S. E. Pryse et al.: Evidence for solar-production as a source of polar-cap plasma 1099 The positive values before 08:50 UT are in keeping with the
return sunward flow at lower latitudes in the afternoon cell (14:30–15:30 MLT). The sunward flow near 08:54:20 UT suggests that the satellite may have intercepted the edge of the morning cell. The ion energy panel of the figure shows a dispersion signature between 08:53 UT and 08:54 UT in-dicative of the rotation in the convection pattern under By>0, with the less energetic ions at the higher latitudes due to a component of the cross-polar flow in the direction opposite to the satellite motion.
2.5 Electron density at sub-auroral latitudes
Measurements of the latitudinal variation in the elec-tron density were obtained from radio tomography ob-servations with receivers in northern Scandinavia at Ny ˚Alesund (78.9◦N, 12.0◦E), Longyearbyen (78.2◦N, 15.3◦E), Bjørnøya (74.5◦N, 19.0◦E) and Tromsø (69.8◦N, 19.0◦E). A sequence of three satellite passes is of interest here. The equivalent vertical total electron content (TEC) measured at the four sites for a pass that crossed 75◦N at 08:10 UT is shown as a function of latitude in Fig. 7; a pass selected as the closest in UT to the ESR observation and as representative of the other two. There is clear evi-dence of fine structure at latitudes poleward of 78◦N, likely to be related to the soft precipitation. To the south there is a trough, with minimum density at about 78◦N in the Longyearbyen and Ny ˚Alesund traces. Yet further south there is a much smoother ionosphere, with a peak at about 73–74◦N, bounded on its equatorward edge by a broad min-imum centred on 67◦N. The increase at latitudes equator-ward of 65◦N can be attributed to increasing photoionisation with increasing solar zenith angle in the daytime mid-latitude ionosphere.
The corresponding tomographic image, obtained from the inversion of the TEC observations, is shown in the centre panel of Fig. 8. It shows the structures at latitudes pole-ward of 78◦N, the trough with minimum at 78◦N, and the enhanced density feature centred at 74◦N with peak density in excess of 2.8×10¹¹m−3 at an altitude of about 300 km. The tomographic images for the other two satellite passes at 07:36 UT and 09:59 UT show broadly consistent iono-spheric structure. Inspection reveals that the enhancement near 74◦N has moved poleward by some 1◦latitude in the 30 min between the first two passes, but then reverts equa-torward by the third. Such motion can be interpreted as a re-sponse to a decrease and then an increase in the magnitude of Bz, with the polar cap contracting and then expanding again. Also of note is the decrease in the maximum electron den-sity of the enhancement between the first and the third pass, from 3.2×10¹¹m−3to 2.4×10¹¹m−3. This decrease occurs as time progresses towards the local geographic noon near 11:00 UT and is contrary to the expected build-up of plasma in daylight. 0.4 0.6 0.4 0.6 0.8 0.8 0.8 1.0 1.0 1.2 1.4 1.4 1.4 1.6 1.6 1.6 0.6 1.8 2.0 2.0 2.2 2.4 2.6 0.6 0.6 0.4 0.4 0.2 0.8 1.0 1.2 1.2 1.4 1.6 HEIGHT (km) LATITUDE 68o 70o 72o 74o 76o 78o 80o 82o 100 100 300 300 500 500 700 700 900 900 Tomographic Image: 20/12/98 07:36 UT Electron Density (x1011 m-3 ) 0.4 0.6 0.8 1.0 1.0 1.2 1.2 1.2 1.4 1.4 1.6 1.6 1.8 1.8 0.8 0.8 0.8 0.6 0.6 0.6 0.6 0.4 0.4 2.0 2.2 2.4 2.6 0.2 1.0 1.2 1.4 HEIGHT (km) LATITUDE 68o 70o 72o 74o 76o 78o 80o 82o 100 100 300 300 500 500 700 700 900 900 Tomographic Image: 20/12/98 08:10 UT Electron Density (x1011 m-3 ) 0.3 0.6 0.9 0.9 1.2 1.5 1.8 1.8 2.1 0.6 0.6 0.6 0.3 0.3 0.3 0.9 0.9 1.2 0.9 0.6 HEIGHT (km) LATITUDE 68o 70o 72o 74o 76o 78o 80o 82o 100 100 300 300 500 500 700 700 900 900 Tomographic Image: 20/12/98 09:59 UT Electron Density (x1011 m-3 )
Fig. 8. Tomographic images for three satellite passes that crossed
75◦N at 07:36 UT (top panel), 08:10 UT (centre panel) and 09:59 UT (bottom panel) on 20 December 1998. The reconstruc-tion in the centre panel has been obtained from the total electron content illustrated in Fig. 7.
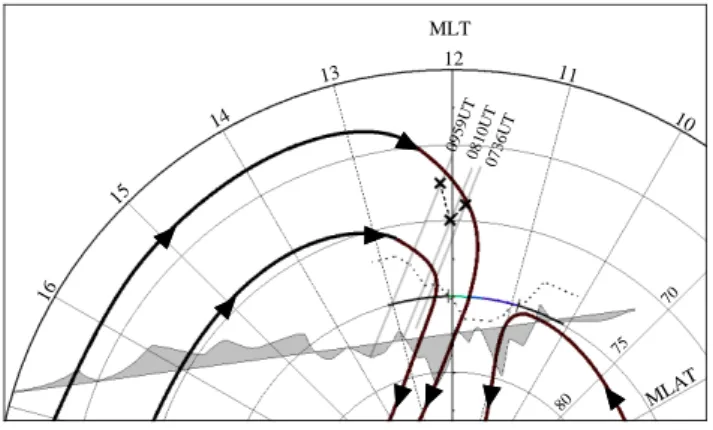
MLAT MLT 12 11 10 13 14 15 16 80 75 70 073 6U T 081 0U T 095 9U T
Fig. 9. Composite dial plot for comparison of observations by the
different instruments in the geomagnetic reference frame. It shows the locus of the ESR observations near 75◦N, the equatorward edge of the red-line emission observed by the MSP, the cross-trajectory horizontal flows measured by the F13 DMSP satellite, anticipated plasma flow lines for the pertinent IMF conditions, and the 300 km intersections of the three tomography passes indicating the location of the maximum density of the sub-auroral enhancement. For a detailed description the reader is referred to the text.
3 Discussion
As an aid to the interpretation of the measurements by the different instruments, the main features of interest have been plotted in Fig. 9 in the geomagnetic reference frame. The locus of the ESR observations essentially follows 75◦MLAT between about 10:00 and 13:00 MLT, with the two markers one before 11:00 MLT and the other after 12:00 MLT show-ing the respective times of the abrupt decrease and increase in the electron temperatures. The region of the enhancement in the electron density of particular interest to the current study is slightly earlier than the later marker. The dotted trace inter-secting the ESR locus near the two temperature markers indi-cates the equatorward edge of the red-line emission observed by the meridian scanning photometer. Its coincidence with the markers is supportive of the precipitation being entirely poleward of the radar field-of-view between about 11:00 and 12:00 MLT, and in particular at the time of the density en-hancement.
The cross-trajectory horizontal flows measured during the east-to-west DMSP satellite pass are also shown in the fig-ure. These have been extended to later MLTs than shown in Fig. 6. The satellite trajectory is indicated on the fig-ure by the straight line extending from 09:30 MLT to almost 17:00 MLT, and is used as baseline for the cross-trajectory flow component. These flows are shown by the curve with underside shading, with the displacement of the curve from the baseline indicating the magnitude and direction of the component. The regions near magnetic noon show the gen-eral antisunward component, while the sunward velocity components in the afternoon sector correspond to the re-turn flow of the dusk cell. Flows are significantly reduced at the extreme of the trajectory on the dusk-side, indicative of slow moving plasma near the stagnation region between
the sunward flow and the co-rotation regime at lower lati-tudes. Superimposed on the plot is a possible high-latitude convection flow pattern, consistent with the CUTLASS ob-servations near the noon meridian (not shown in the figure) and the DMSP flows and ion energy dispersion. The general form is typical of the flows expected with Bznegative and By positive, comprising twin convection cells with a larger dusk cell.
In-situ ionisation production was ruled out as the source of the density enhancement, since the electron temperatures within the region remained near background level (Nilsson et al., 1994). Given the direction of plasma convection through the ESR region, it is therefore expected that the enhanced density was carried by the flow into the field-of-view from a source region at lower latitudes. Of the two ionisation pro-duction processes likely to be operative at the lower latitudes, soft-particle precipitation can be ruled out by the lack of opti-cal emissions in the region. Hence, in this instance, it appears that photoionisation was the likely source.
Three grey lines near noon in Fig. 9 show the ionospheric intersections of the three tomographic images in the geomag-netic frame, with the crosses indicating the location of the maximum density of the sub-auroral enhancement. The lat-itudinal variation of the maximum density reflects the con-traction and then expansion of the polar cap in response to the changes in Bz. The latitude of the enhancement suggests that it may map broadly to the boundary between the sun-ward return flow of the dusk cell and the co-rotating flow at lower latitudes. This density feature is clearly distinct from the auroral region and also from the main photoioni-sation regime at the southern extreme of Fig. 7, where the TEC increased monotonically with decreasing latitude, be-ing separated by a weak ionisation trough. The decrease in the maximum electron density of the enhancement as time progresses towards local geographic noon, contrary to the ex-pected build-up of plasma in daylight, can now be explained if the enhancement is located slightly poleward of the stag-nation region in-between the two flow regimes, where the plasma moves slowly sunward at the equatorward edge of the dusk cell. The long times spent by the plasma in sunlight as it moves towards the flow reversal near magnetic noon allows time for the photoionisation to build-up. The increased den-sities are then entrained into the polar-cap convection flow, and subsequently swept antisunward in the noon sector to be transported poleward in the tongue-of-ionisation toward the cusp region.
Given this interpretation, the enhanced densities observed by the ESR equatorward of the cusp are likely to be those of the tongue-of-ionisation before it enters the polar region. Ionisation decay is expected as the plasma moves from sun-lit lower latitudes to the dark winter polar cap. The tomo-graphic image at 07:36 UT indicated a maximum density of about 3.2×10¹¹m−3 for the sub-auroral enhancement near noon, while by the time it had reached the ESR field-of-view it had reduced to 1.4×10¹¹m−3. The time required for plasma to decay from 3.2×10¹¹m−3 to 1.4×10¹¹m−3 in the absence of production processes can be estimated by
S. E. Pryse et al.: Evidence for solar-production as a source of polar-cap plasma 1101 considering the rate of plasma loss in the F region. At
al-titudes above approximately 250 km the primary ion con-stituent is O+. The dominant processes for the chemical loss of the ion is through slow reaction with N2and O2to form NO+ and O2+, respectively, followed by rapid dissociation of the molecules by reaction with electrons. Simple calcu-lations, as in Walker et al. (1999) using recombination rates from Brekke (1997), give a decay time of some 45 min for plasma at an altitude of 300 km. The required time increases to about 100 min at 325 km but reduces to about 20 min at 275 km. Thus, at an altitude of 300 km it can be estimated that the plasma takes about 45 min to drift from a latitude of about 73.5◦N to 78.2◦N, a distance of some 550 km. This gives a calculated poleward velocity component of approxi-mately 200 m s−1, which is in broad agreement with the flow components measured by the CUTLASS Finland radar near the northern Norwegian coastline. However, it is likely that the calculated drift time is underestimated and the velocity overestimated due to ionisation production being neglected. In reality, photo-production would also have been operative, albeit weakening significantly as the plasma moved toward the dark polar cap at winter solstice.
Various authors have suggested that break-up of the tongue-of-ionisation may be the source of the patches of en-hanced density plasma found in the polar cap when Bz is negative. Modelling studies have been carried out by Bow-line et al. (1996) to investigate ionisation in polar-cap patches as a function of UT, day of the year and location of the ob-servations. The study included modelling for Ny ˚Alesund, some 1◦latitude north of the ESR field-of-view. Comparison of absolute density levels from their model near 09:00 UT with those measured by ESR in the current study indicates that the model values are generally double those measured. However, the modelling work also included results relating to the patch-to-background density ratio, so that another com-parison is possible. Figure 7 of the Bowline et al. paper illustrates the ratio under conditions of By negative and By positive. For the winter solstice conditions with By>0, per-tinent to the current study, the ionisation enhancement was most marked in the evening sector, with the ratio attaining a value of 5 between 17:00 UT and 22:00 UT. At other times the value was generally less than 3, and occasionally be-low 2. On this basis the authors argued that the tongue-of-ionisation was unlikely to be observed at this site in the mag-netic noon sector. However, at the time of interest to the cur-rent study, between 08:00 and 09:00 UT, the modelled patch-to-background was about 2.5. Hence, while the density of the enhancement was not five times that of the background level, it was nevertheless significantly increased, and indeed in ac-cord with the patch definition of Crowley (1996) of two-fold above background. Estimation of the patch-to-background ratio from the ESR observations, with the patch density be-ing taken as that measured between approximately 08:50 and 09:00 UT and the background between 08:10 and 08:25 UT gave a value of 2.6, in broad agreement with that obtained from the model. In consequence, it is not unreasonable to conclude that the tongue-of-ionisation can be observed in the
Ny ˚Alesund sector near local magnetic noon, although the density above the background level may not be as marked as modelling studies would suggest for the evening hours.
4 Conclusion
Observations have been presented from a multi-instrument study addressing the origin of a high-latitude plasma en-hancement in the dayside ionosphere in the European sec-tor. The localised region of enhanced density observed by the ESR radar was clearly not being produced in-situ by soft-particle precipitation. A fortuitous contraction of the polar cap at the time of interest resulted in the optical emissions being to the north of the ESR viewing region. With the anti-sunward plasma flow, observed by the CUTLASS radar and a DMSP satellite, it was also possible to rule out soft precipi-tation outside the field-of-view as a source. The likely source in this instance was photoionisation at sub-auroral latitudes. Three consecutive tomographic images showed that there was enhanced density that was distinct from normal day-time photoionisation at the lower latitudes of the co-rotating flow regime. The location indicated that it was found in a regime of slow sunward convection at the equatorward edge of the afternoon convection cell, with the long time it spent in sunlight allowing for the build-up of density. It is proposed that this enhanced density was subsequently entrained into a tongue-of-ionisation and carried poleward from the sub-auroral latitudes. The long lifetime of F region plasma above 300 km allowed for the increased densities to be observed by the ESR radar as it intercepted the tongue between 08:45 and 09:00 UT. It is possible that the tongue extended to times be-yond 09:00 UT in the ESR observations, however, it cannot be identified unambiguously at these later times because of the expansion of the polar cap with the precipitation region returning into the field-of-view of the radar.
Acknowledgements. Financial support for the project was provided
by the UK Particle Physics and Astronomy Research Council un-der grant PPA/G/O/2001/00012 and the Norwegian Research Coun-cil and AFOSR Task 2311AS. The assistance of the University of Tromsø and the Norwegian Polar Research Institute in the tomo-graphic measurements is gratefully acknowledged. The CUTLASS radar is a UK national facility funded by the Particle Physics and Astronomy Research Council; the data used here have been sup-plied by T. Yeoman. EISCAT is an international facility supported by the national science councils of Finland, France, Germany, Japan, Norway, Sweden and the United Kingdom. R. Lepping pro-vided the WIND data that were obtained from the CDAWeb. RWS acknowledges receipt of a PPARC postgraduate studentship.
Topical Editor M. Lester thanks V. Howells for her help in eval-uating this paper.
References
Anderson, D. N., Buchau, J., and Heelis, R. A.: Origin of density enhancements in the winter polar cap ionosphere, Radio Sci, 23, 513–519, 1988.
Bowline, M. D., Sojka, J. J., and Schunk, R. W.: Relationship of theoretical patch climatology to polar cap patch observations, Radio Sci., 31, 635–644, 1996.
Brekke, A.: Physics of the upper polar atmosphere, Wiley-Praxis Series in Atmospheric Physics, 1997.
Buchau, J. and Reinisch, B. W.: Electron density structures in the polar F-region, Adv. Space Res., 11(10), 29–32, 1991.
Buchau, J., Weber, E. J., Anderson, D. N., Carlson, Jr., H. C., Moore, J. G., Reinisch, B. W., and Livingston, R .C.: Ionospheric structures in the polar cap: their origin in relation to 250-MHz scintillation, Radio Sci., 20, 325–338, 1985.
Buchau, J., Reinisch, B. W., Weber, E. J., and Moore, J. G.: Struc-ture and dynamics of the winter polar cap F-region, Radio Sci., 18, 995–1010, 1983.
Crowley, G.: Critical review of ionospheric patches and blobs, URSI Review of Radio Science 1993–1996, edited by Stone, W. R., 619–648, 1996.
Lockwood, M. and Carlson, Jr., H. C.: Production of polar cap electron density patches by transient magnetopause reconnec-tion, Geophys. Res. Lett., 19, 1731–1734, 1992.
McEwan, D. J. and Harris, D. P.: Occurrence patterns of F layer patches over north magnetic pole, Radio Sci., 31, 619–628, 1996. Nielsen, C. P., Moen, J., Carlson, H. C., Oksavik, K., Gallop, P., and Denig, W. F.: Patch formation in relation to cusp auroral activity, Ann. Geophysicae, 2003.
Nilsson, H., Kirkwood, S., Eliasson, L., Norberg, O., Clemmons, J., and Boehm, M.: The ionospheric signature of the cusp: a case study using Freja and the Sondrestrom radar, Geophys. Res. Lett., 21, 1923–1926, 1994.
Ogawa, T., Nishida, N., Pinnock, M., Sato, N., Yamagishi, H., and Yukimato, A.S.: Antarctic HF radar observations of irregularities associated with polar patches and auroral blobs: A case study, J. Geophys. Res., 103, 26547–26558, 1998.
Pederson, T. R., Fejer, B. G., Doe, R. A., and Weber, E. J.: Inco-herent scatter radar observations of horizontal F-region plasma structure over Sondrestrom, Greenland, during polar cap patch events, Radio Sci., 33, 1847–1866, 1998.
Rodger, A. S., Pinnock, M., Dudeney, J. R., Watermann, J., de la Beaujardiere, O., and Baker, K. B.: Simultaneous two hemi-sphere observations of the presence of polar patches in the night-side ionosphere, Ann. Geophysicae, 12, 642–648, 1994a. Rodger, A. S., Pinnock, M., Dudeney, J. R., Baker, K. B., and
Greenwald, R. A.: A new mechanism for polar patch formation, J. Geophys. Res., 99, 6425–6436, 1994b.
Smith, A. M., Pryse, S. E., and Kersley, L.: Polar patches observed by ESR and their possible origin in the cusp region, Ann. Geo-physicae, 18, 1043–1053, 2000.
Sojka, J. J., Bowline, M. D., Schunk, R. W., Decker, D. T., Val-ladares, C. E., Sheehan, R., Anderson, D.N., and Heelis, R. A.: Modelling polar cap F-region patches using time varying convec-tion, Geophys. Res. Lett., 20, 1783–1786, 1993.
Sojka, J. J., Bowline, M. D., Schunk, R. W.: Patches in the polar ionosphere: UT and seasonal dependence, J. Geophys. Res., 99, 14 959–14 970, 1994.
Valladares, C. E., Basu, S., Buchau J., and Friis-Christensen, E.: Experimental evidence for the formation and entry of patches into the polar cap, Radio Sci., 29, 167–194, 1994.
Walker, I. K., Moen, J. , Kersley, L., and Lorentzen, D. A.: On the possible role of cusp/cleft precipitation in the formation of polar-cap patches, Ann. Geophysicae, 17, 1298–1305, 1999. Weber, E. J., Buchau, J., Moore, J.G., Sharber, J. R., Livingston, R.
C., Winningham, J. D., and Reinisch, B. W.: F-layer ionization patches in the polar cap, J. Geophys. Res., 89, 1683–1694, 1984.