arXiv:hep-ex/0607048v1 24 Jul 2006
BABAR-CONF-06/032 SLAC-PUB-11994
Search for the rare decay B
→ π ℓ
+ℓ
−The BABAR Collaboration September 16, 2018
Abstract
We present results of a search for the rare flavor-changing neutral-current decay B → πℓ+ℓ−,
based on a data sample corresponding to 209 fb−1of integrated luminosity collected with the BABAR detector at the PEP-II B Factory. We reconstruct the four exclusive B decay modes B+
→ π+ℓ+ℓ−
and B0→ π0ℓ+ℓ−, where ℓ is either an e or µ. We find no evidence for a signal, and we obtain the
upper limit at 90% confidence level on the lepton-flavor–averaged branching fraction to be B(B+ → π+ℓ+ℓ−) = 2 ×τB+
τB0B(B 0
→ π0ℓ+ℓ−) < 7.9 × 10⁻⁸.
We also obtain an upper limit at 90% confidence level on the lepton-flavor–violating decay B → πeµ of
B(B → πeµ) < 9.8 × 10⁻⁸.
Submitted to the 33rd International Conference on High-Energy Physics, ICHEP 06,
26 July—2 August 2006, Moscow, Russia.
Stanford Linear Accelerator Center, Stanford University, Stanford, CA 94309 Work supported in part by Department of Energy contract DE-AC03-76SF00515.
The BABARCollaboration,
B. Aubert, R. Barate, M. Bona, D. Boutigny, F. Couderc, Y. Karyotakis, J. P. Lees, V. Poireau, V. Tisserand, A. Zghiche
Laboratoire de Physique des Particules, IN2P3/CNRS et Universit´e de Savoie, F-74941 Annecy-Le-Vieux, France
E. Grauges
Universitat de Barcelona, Facultat de Fisica, Departament ECM, E-08028 Barcelona, Spain A. Palano
Universit`a di Bari, Dipartimento di Fisica and INFN, I-70126 Bari, Italy J. C. Chen, N. D. Qi, G. Rong, P. Wang, Y. S. Zhu
Institute of High Energy Physics, Beijing 100039, China G. Eigen, I. Ofte, B. Stugu
University of Bergen, Institute of Physics, N-5007 Bergen, Norway
G. S. Abrams, M. Battaglia, D. N. Brown, J. Button-Shafer, R. N. Cahn, E. Charles, M. S. Gill, Y. Groysman, R. G. Jacobsen, J. A. Kadyk, L. T. Kerth, Yu. G. Kolomensky, G. Kukartsev, G. Lynch,
L. M. Mir, T. J. Orimoto, M. Pripstein, N. A. Roe, M. T. Ronan, W. A. Wenzel
Lawrence Berkeley National Laboratory and University of California, Berkeley, California 94720, USA P. del Amo Sanchez, M. Barrett, K. E. Ford, A. J. Hart, T. J. Harrison, C. M. Hawkes, S. E. Morgan,
A. T. Watson
University of Birmingham, Birmingham, B15 2TT, United Kingdom
T. Held, H. Koch, B. Lewandowski, M. Pelizaeus, K. Peters, T. Schroeder, M. Steinke Ruhr Universit¨at Bochum, Institut f¨ur Experimentalphysik 1, D-44780 Bochum, Germany
J. T. Boyd, J. P. Burke, W. N. Cottingham, D. Walker University of Bristol, Bristol BS8 1TL, United Kingdom
D. J. Asgeirsson, T. Cuhadar-Donszelmann, B. G. Fulsom, C. Hearty, N. S. Knecht, T. S. Mattison, J. A. McKenna
University of British Columbia, Vancouver, British Columbia, Canada V6T 1Z1 A. Khan, P. Kyberd, M. Saleem, D. J. Sherwood, L. Teodorescu
Brunel University, Uxbridge, Middlesex UB8 3PH, United Kingdom
V. E. Blinov, A. D. Bukin, V. P. Druzhinin, V. B. Golubev, A. P. Onuchin, S. I. Serednyakov, Yu. I. Skovpen, E. P. Solodov, K. Yu Todyshev
Budker Institute of Nuclear Physics, Novosibirsk 630090, Russia
D. S. Best, M. Bondioli, M. Bruinsma, M. Chao, S. Curry, I. Eschrich, D. Kirkby, A. J. Lankford, P. Lund, M. Mandelkern, R. K. Mommsen, W. Roethel, D. P. Stoker
University of California at Irvine, Irvine, California 92697, USA S. Abachi, C. Buchanan
S. D. Foulkes, J. W. Gary, O. Long, B. C. Shen, K. Wang, L. Zhang University of California at Riverside, Riverside, California 92521, USA
H. K. Hadavand, E. J. Hill, H. P. Paar, S. Rahatlou, V. Sharma University of California at San Diego, La Jolla, California 92093, USA
J. W. Berryhill, C. Campagnari, A. Cunha, B. Dahmes, T. M. Hong, D. Kovalskyi, J. D. Richman University of California at Santa Barbara, Santa Barbara, California 93106, USA
T. W. Beck, A. M. Eisner, C. J. Flacco, C. A. Heusch, J. Kroseberg, W. S. Lockman, G. Nesom, T. Schalk, B. A. Schumm, A. Seiden, P. Spradlin, D. C. Williams, M. G. Wilson
University of California at Santa Cruz, Institute for Particle Physics, Santa Cruz, California 95064, USA J. Albert, E. Chen, A. Dvoretskii, F. Fang, D. G. Hitlin, I. Narsky, T. Piatenko, F. C. Porter, A. Ryd,
A. Samuel
California Institute of Technology, Pasadena, California 91125, USA G. Mancinelli, B. T. Meadows, K. Mishra, M. D. Sokoloff
University of Cincinnati, Cincinnati, Ohio 45221, USA
F. Blanc, P. C. Bloom, S. Chen, W. T. Ford, J. F. Hirschauer, A. Kreisel, M. Nagel, U. Nauenberg, A. Olivas, W. O. Ruddick, J. G. Smith, K. A. Ulmer, S. R. Wagner, J. Zhang
University of Colorado, Boulder, Colorado 80309, USA
A. Chen, E. A. Eckhart, A. Soffer, W. H. Toki, R. J. Wilson, F. Winklmeier, Q. Zeng Colorado State University, Fort Collins, Colorado 80523, USA
D. D. Altenburg, E. Feltresi, A. Hauke, H. Jasper, J. Merkel, A. Petzold, B. Spaan Universit¨at Dortmund, Institut f¨ur Physik, D-44221 Dortmund, Germany
T. Brandt, V. Klose, H. M. Lacker, W. F. Mader, R. Nogowski, J. Schubert, K. R. Schubert, R. Schwierz, J. E. Sundermann, A. Volk
Technische Universit¨at Dresden, Institut f¨ur Kern- und Teilchenphysik, D-01062 Dresden, Germany D. Bernard, G. R. Bonneaud, E. Latour, Ch. Thiebaux, M. Verderi
Laboratoire Leprince-Ringuet, CNRS/IN2P3, Ecole Polytechnique, F-91128 Palaiseau, France P. J. Clark, W. Gradl, F. Muheim, S. Playfer, A. I. Robertson, Y. Xie
University of Edinburgh, Edinburgh EH9 3JZ, United Kingdom
M. Andreotti, D. Bettoni, C. Bozzi, R. Calabrese, G. Cibinetto, E. Luppi, M. Negrini, A. Petrella, L. Piemontese, E. Prencipe
Universit`a di Ferrara, Dipartimento di Fisica and INFN, I-44100 Ferrara, Italy
F. Anulli, R. Baldini-Ferroli, A. Calcaterra, R. de Sangro, G. Finocchiaro, S. Pacetti, P. Patteri, I. M. Peruzzi,1
M. Piccolo, M. Rama, A. Zallo
Laboratori Nazionali di Frascati dell’INFN, I-00044 Frascati, Italy
A. Buzzo, R. Capra, R. Contri, M. Lo Vetere, M. M. Macri, M. R. Monge, S. Passaggio, C. Patrignani, E. Robutti, A. Santroni, S. Tosi
Universit`a di Genova, Dipartimento di Fisica and INFN, I-16146 Genova, Italy G. Brandenburg, K. S. Chaisanguanthum, M. Morii, J. Wu
Harvard University, Cambridge, Massachusetts 02138, USA R. S. Dubitzky, J. Marks, S. Schenk, U. Uwer
Universit¨at Heidelberg, Physikalisches Institut, Philosophenweg 12, D-69120 Heidelberg, Germany D. J. Bard, W. Bhimji, D. A. Bowerman, P. D. Dauncey, U. Egede, R. L. Flack, J. A. Nash,
M. B. Nikolich, W. Panduro Vazquez
Imperial College London, London, SW7 2AZ, United Kingdom P. K. Behera, X. Chai, M. J. Charles, U. Mallik, N. T. Meyer, V. Ziegler
University of Iowa, Iowa City, Iowa 52242, USA
J. Cochran, H. B. Crawley, L. Dong, V. Eyges, W. T. Meyer, S. Prell, E. I. Rosenberg, A. E. Rubin Iowa State University, Ames, Iowa 50011-3160, USA
A. V. Gritsan
Johns Hopkins University, Baltimore, Maryland 21218, USA A. G. Denig, M. Fritsch, G. Schott
Universit¨at Karlsruhe, Institut f¨ur Experimentelle Kernphysik, D-76021 Karlsruhe, Germany N. Arnaud, M. Davier, G. Grosdidier, A. H¨ocker, F. Le Diberder, V. Lepeltier, A. M. Lutz, A. Oyanguren,
S. Pruvot, S. Rodier, P. Roudeau, M. H. Schune, A. Stocchi, W. F. Wang, G. Wormser Laboratoire de l’Acc´el´erateur Lin´eaire, IN2P3/CNRS et Universit´e Paris-Sud 11, Centre Scientifique
d’Orsay, B.P. 34, F-91898 ORSAY Cedex, France C. H. Cheng, D. J. Lange, D. M. Wright
Lawrence Livermore National Laboratory, Livermore, California 94550, USA
C. A. Chavez, I. J. Forster, J. R. Fry, E. Gabathuler, R. Gamet, K. A. George, D. E. Hutchcroft, D. J. Payne, K. C. Schofield, C. Touramanis
University of Liverpool, Liverpool L69 7ZE, United Kingdom A. J. Bevan, F. Di Lodovico, W. Menges, R. Sacco Queen Mary, University of London, E1 4NS, United Kingdom
G. Cowan, H. U. Flaecher, D. A. Hopkins, P. S. Jackson, T. R. McMahon, S. Ricciardi, F. Salvatore, A. C. Wren
University of London, Royal Holloway and Bedford New College, Egham, Surrey TW20 0EX, United Kingdom
D. N. Brown, C. L. Davis
J. Allison, N. R. Barlow, R. J. Barlow, Y. M. Chia, C. L. Edgar, G. D. Lafferty, M. T. Naisbit, J. C. Williams, J. I. Yi
University of Manchester, Manchester M13 9PL, United Kingdom C. Chen, W. D. Hulsbergen, A. Jawahery, C. K. Lae, D. A. Roberts, G. Simi
University of Maryland, College Park, Maryland 20742, USA
G. Blaylock, C. Dallapiccola, S. S. Hertzbach, X. Li, T. B. Moore, S. Saremi, H. Staengle University of Massachusetts, Amherst, Massachusetts 01003, USA
R. Cowan, G. Sciolla, S. J. Sekula, M. Spitznagel, F. Taylor, R. K. Yamamoto
Massachusetts Institute of Technology, Laboratory for Nuclear Science, Cambridge, Massachusetts 02139, USA
H. Kim, S. E. Mclachlin, P. M. Patel, S. H. Robertson McGill University, Montr´eal, Qu´ebec, Canada H3A 2T8
A. Lazzaro, V. Lombardo, F. Palombo
Universit`a di Milano, Dipartimento di Fisica and INFN, I-20133 Milano, Italy
J. M. Bauer, L. Cremaldi, V. Eschenburg, R. Godang, R. Kroeger, D. A. Sanders, D. J. Summers, H. W. Zhao
University of Mississippi, University, Mississippi 38677, USA S. Brunet, D. Cˆot´e, M. Simard, P. Taras, F. B. Viaud
Universit´e de Montr´eal, Physique des Particules, Montr´eal, Qu´ebec, Canada H3C 3J7 H. Nicholson
Mount Holyoke College, South Hadley, Massachusetts 01075, USA N. Cavallo,2
G. De Nardo, F. Fabozzi,3
C. Gatto, L. Lista, D. Monorchio, P. Paolucci, D. Piccolo, C. Sciacca
Universit`a di Napoli Federico II, Dipartimento di Scienze Fisiche and INFN, I-80126, Napoli, Italy M. A. Baak, G. Raven, H. L. Snoek
NIKHEF, National Institute for Nuclear Physics and High Energy Physics, NL-1009 DB Amsterdam, The Netherlands
C. P. Jessop, J. M. LoSecco
University of Notre Dame, Notre Dame, Indiana 46556, USA
T. Allmendinger, G. Benelli, L. A. Corwin, K. K. Gan, K. Honscheid, D. Hufnagel, P. D. Jackson, H. Kagan, R. Kass, A. M. Rahimi, J. J. Regensburger, R. Ter-Antonyan, Q. K. Wong
Ohio State University, Columbus, Ohio 43210, USA
N. L. Blount, J. Brau, R. Frey, O. Igonkina, J. A. Kolb, M. Lu, R. Rahmat, N. B. Sinev, D. Strom, J. Strube, E. Torrence
University of Oregon, Eugene, Oregon 97403, USA
2Also with Universit`a della Basilicata, Potenza, Italy
A. Gaz, M. Margoni, M. Morandin, A. Pompili, M. Posocco, M. Rotondo, F. Simonetto, R. Stroili, C. Voci Universit`a di Padova, Dipartimento di Fisica and INFN, I-35131 Padova, Italy
M. Benayoun, H. Briand, J. Chauveau, P. David, L. Del Buono, Ch. de la Vaissi`ere, O. Hamon, B. L. Hartfiel, M. J. J. John, Ph. Leruste, J. Malcl`es, J. Ocariz, L. Roos, G. Therin
Laboratoire de Physique Nucl´eaire et de Hautes Energies, IN2P3/CNRS, Universit´e Pierre et Marie Curie-Paris6, Universit´e Denis Diderot-Paris7, F-75252 Paris, France
L. Gladney, J. Panetta
University of Pennsylvania, Philadelphia, Pennsylvania 19104, USA M. Biasini, R. Covarelli
Universit`a di Perugia, Dipartimento di Fisica and INFN, I-06100 Perugia, Italy
C. Angelini, G. Batignani, S. Bettarini, F. Bucci, G. Calderini, M. Carpinelli, R. Cenci, F. Forti, M. A. Giorgi, A. Lusiani, G. Marchiori, M. A. Mazur, M. Morganti, N. Neri, E. Paoloni, G. Rizzo,
J. J. Walsh
Universit`a di Pisa, Dipartimento di Fisica, Scuola Normale Superiore and INFN, I-56127 Pisa, Italy M. Haire, D. Judd, D. E. Wagoner
Prairie View A&M University, Prairie View, Texas 77446, USA
J. Biesiada, N. Danielson, P. Elmer, Y. P. Lau, C. Lu, J. Olsen, A. J. S. Smith, A. V. Telnov Princeton University, Princeton, New Jersey 08544, USA
F. Bellini, G. Cavoto, A. D’Orazio, D. del Re, E. Di Marco, R. Faccini, F. Ferrarotto, F. Ferroni, M. Gaspero, L. Li Gioi, M. A. Mazzoni, S. Morganti, G. Piredda, F. Polci, F. Safai Tehrani, C. Voena
Universit`a di Roma La Sapienza, Dipartimento di Fisica and INFN, I-00185 Roma, Italy M. Ebert, H. Schr¨oder, R. Waldi
Universit¨at Rostock, D-18051 Rostock, Germany T. Adye, N. De Groot, B. Franek, E. O. Olaiya, F. F. Wilson
Rutherford Appleton Laboratory, Chilton, Didcot, Oxon, OX11 0QX, United Kingdom
R. Aleksan, S. Emery, A. Gaidot, S. F. Ganzhur, G. Hamel de Monchenault, W. Kozanecki, M. Legendre, G. Vasseur, Ch. Y`eche, M. Zito
DSM/Dapnia, CEA/Saclay, F-91191 Gif-sur-Yvette, France X. R. Chen, H. Liu, W. Park, M. V. Purohit, J. R. Wilson University of South Carolina, Columbia, South Carolina 29208, USA
M. T. Allen, D. Aston, R. Bartoldus, P. Bechtle, N. Berger, R. Claus, J. P. Coleman, M. R. Convery, M. Cristinziani, J. C. Dingfelder, J. Dorfan, G. P. Dubois-Felsmann, D. Dujmic, W. Dunwoodie, R. C. Field, T. Glanzman, S. J. Gowdy, M. T. Graham, P. Grenier,4
V. Halyo, C. Hast, T. Hryn’ova, W. R. Innes, M. H. Kelsey, P. Kim, D. W. G. S. Leith, S. Li, S. Luitz, V. Luth, H. L. Lynch, D. B. MacFarlane, H. Marsiske, R. Messner, D. R. Muller, C. P. O’Grady, V. E. Ozcan, A. Perazzo,
M. Perl, T. Pulliam, B. N. Ratcliff, A. Roodman, A. A. Salnikov, R. H. Schindler, J. Schwiening, A. Snyder, J. Stelzer, D. Su, M. K. Sullivan, K. Suzuki, S. K. Swain, J. M. Thompson, J. Va’vra, N. van
Bakel, M. Weaver, A. J. R. Weinstein, W. J. Wisniewski, M. Wittgen, D. H. Wright, A. K. Yarritu, K. Yi, C. C. Young
Stanford Linear Accelerator Center, Stanford, California 94309, USA P. R. Burchat, A. J. Edwards, S. A. Majewski, B. A. Petersen, C. Roat, L. Wilden
Stanford University, Stanford, California 94305-4060, USA
S. Ahmed, M. S. Alam, R. Bula, J. A. Ernst, V. Jain, B. Pan, M. A. Saeed, F. R. Wappler, S. B. Zain State University of New York, Albany, New York 12222, USA
W. Bugg, M. Krishnamurthy, S. M. Spanier University of Tennessee, Knoxville, Tennessee 37996, USA R. Eckmann, J. L. Ritchie, A. Satpathy, C. J. Schilling, R. F. Schwitters
University of Texas at Austin, Austin, Texas 78712, USA J. M. Izen, X. C. Lou, S. Ye
University of Texas at Dallas, Richardson, Texas 75083, USA F. Bianchi, F. Gallo, D. Gamba
Universit`a di Torino, Dipartimento di Fisica Sperimentale and INFN, I-10125 Torino, Italy M. Bomben, L. Bosisio, C. Cartaro, F. Cossutti, G. Della Ricca, S. Dittongo, L. Lanceri, L. Vitale
Universit`a di Trieste, Dipartimento di Fisica and INFN, I-34127 Trieste, Italy V. Azzolini, N. Lopez-March, F. Martinez-Vidal
IFIC, Universitat de Valencia-CSIC, E-46071 Valencia, Spain
Sw. Banerjee, B. Bhuyan, C. M. Brown, D. Fortin, K. Hamano, R. Kowalewski, I. M. Nugent, J. M. Roney, R. J. Sobie
University of Victoria, Victoria, British Columbia, Canada V8W 3P6 J. J. Back, P. F. Harrison, T. E. Latham, G. B. Mohanty, M. Pappagallo Department of Physics, University of Warwick, Coventry CV4 7AL, United Kingdom
H. R. Band, X. Chen, B. Cheng, S. Dasu, M. Datta, K. T. Flood, J. J. Hollar, P. E. Kutter, B. Mellado, A. Mihalyi, Y. Pan, M. Pierini, R. Prepost, S. L. Wu, Z. Yu
University of Wisconsin, Madison, Wisconsin 53706, USA H. Neal
1
Introduction
The decays B → πℓ+ℓ−, where ℓ+ℓ−is either an e+e−or µ+µ−pair, are the simplest manifestations
of b → dℓ+ℓ− flavor-changing neutral currents (FCNC). In the Standard Model (SM), these decays
are forbidden at tree level and can only occur at greatly suppressed rates through higher-order processes. At lowest order in the electroweak couplings, three amplitudes contribute: (1) a photon penguin, (2) a Z penguin, and (3) a W+W− box diagram (Fig. 1). Since these decays proceed
via weakly-interacting particles with virtual energies near the electroweak scale, they provide a promising means to search for effects from new flavor-changing interactions. Such effects are pre-dicted in a wide variety of models, usually in the context of the similar FCNC b → sℓ+ℓ− [1–5].
If there exists non-trivial flavor violation in the new interactions, b → dℓ+ℓ− can also exhibit large
observable effects, independent of the experimental constraints on b → sℓ+ℓ− [6, 7].
In the Standard Model, the b → d FCNC decay rate is suppressed relative to b → s by a ratio of Cabibbo-Kobayashi-Maskawa matrix elements |Vtd/Vts|2, making them especially rare
processes which challenge the sensitivity of the B factories. The chief experimental constraint on ∆B = 1 b → d FCNC decays comes from recent measurements of the exclusive decays B → ργ and B → ωγ [8], which constrain the photon penguin decay rate to agree with SM predictions with an experimental precision of 30%. The additional b → d electroweak amplitudes present in b → dℓ+ℓ−
are weakly constrained experimentally from older measurements [9]. A recent SM prediction [10] for the B+
→ π+ℓ+ℓ−branching fraction is based on an operator product expansion combined with
B → π form factor predictions from light-cone QCD sum rules; the predicted branching fraction is 3.3 × 10⁻⁸ with an uncertainty of about 30%. The B0
→ π0ℓ+ℓ− branching fraction is related
to the charged mode by isospin symmetry; accounting for the difference in charged and neutral B meson lifetimes, the branching fraction is given by 1
2× τB0/τB+× B(B+→ π+ℓ+ℓ−).
q
q
b
u,c,t
d
W
γ
, Z
l
+l
−q
q
b
u,c,t
d
W
+W
−ν
l
−l
+Figure 1: Standard Model diagrams for the decays B → πℓ+ℓ−. For the photon or Z penguin
diagrams on the left, boson emission can occur on any of the b, t, c, u, d, or W lines.
We also perform a search for the lepton-flavor violating decay B → πe±µ∓ which can occur
in some models beyond the Standard Model, such as theories involving leptoquarks [5]. Earlier searches [11] for these modes have yielded no such events.
2
The B
AB
ARDetector and Dataset
The data used in this analysis were collected with the BABAR detector at the PEP-II storage ring located at the Stanford Linear Accelerator Center. The data sample comprises 208.9 fb−1recorded near the peak of the Υ (4S) resonance, yielding (230.1 ± 2.5) × 106 BB decays, and an off-resonance
sample of 21.5 fb−1 which is used to study continuum background.
The BABARdetector is described in detail elsewhere [12]. Its most important capabilities for this study are charged-particle tracking and momentum measurement, charged π/K separation, and lep-ton identification. Charged particle tracking is provided by a five-layer silicon vertex tracker (SVT) and a 40-layer drift chamber (DCH). The DIRC, a Cherenkov ring-imaging particle-identification system, is used to identify charged kaons and pions. Electrons are identified using the electromag-netic calorimeter (EMC), which comprises 6580 thallium-doped CsI crystals. These systems are mounted inside a 1.5 T solenoidal superconducting magnet. Muons are identified in the instru-mented flux return (IFR), in which resistive plate chambers are interleaved with the iron plates of the magnet flux return.
3
Analysis Method
3.1 Event Selection
We select events that include two oppositely charged leptons (e+e−, µ+µ− and e±µ∓) as well as
a pion (either a π± track or a π0
meson decaying to γγ). The analysis faces the experimental challenge of isolating a very rare B-meson decay from background due to random combinations of particles in generic e+e− → Υ (4S) → BB and continuum e+e− → q¯q events (q ¯q being a pair of
u,d,s, or c quarks), and there is a great abundance of pions and leptons in all of these events. We use stringent particle identification and a multivariate algorithm to reduce this background. Another type of background comes from events that have signal-like features. The main contributions to such backgrounds are from B-mesons decaying to charmonium states (e.g. B → J/ψ π where the J/ψ decays to two leptons) or B-mesons decaying to three hadrons (e.g. B → Dπ with D → Kπ) where two of the hadrons pass the muon selection. In addition, there is background from the b → sℓ+ℓ− penguin decay B → K ℓ+ℓ−, which has a branching fraction about one order
of magnitude larger than expected for B → π ℓ+ℓ− [6, 10]. These events have a reconstructed B
energy lower than expected for signal events and are also very efficiently reduced by information from the DIRC subdetector.
Electrons are required to have a momentum p > 0.3 GeV/c and are identified combining infor-mation from the EMC, DIRC, and DCH. Photons with E > 30 MeV that lie within an angular region of 50 mrad in the azimuth angle φ and 35 mrad in the polar angle θ of the initial electron track direction are combined with electron candidates in order to recover energy lost by bremsstrahlung. We suppress backgrounds due to photon conversions in the B → π e+e− channels by removing
e+e− pairs with invariant mass less than 30 MeV/c2. Muons with momentum p > 0.7 GeV/c are
identified with a neural network algorithm using information from the IFR and the EMC.
The lepton pairs are combined with a charged or neutral pion candidate to reconstruct a B meson. Charged pion candidates are tracks with specific ionization (dE/dx) and Cherenkov angle consistent with a pion. A likelihood algorithm based on this information reduces fake rates from kaons down to about 1 − 5% depending on the track momentum. Neutral pion candidates are identified as pairs of neutral-energy deposits in the EMC, each with an energy greater than 50 MeV in the laboratory frame. The invariant mass of the pair is calculated under the assumption
that the photons originate from the ℓ+ℓ− vertex, and is required to satisfy 115 < m
γγ < 150
MeV/c2.
Correctly reconstructed B signal decays produce narrow peaks in the distributions of two kine-matic variables, which can be used to extract the signal and background yields. For a candidate system of B daughter particles with masses mi and three-momenta p∗i in the Υ (4S) center-of-mass
(CM) frame, we define mES = q E∗2 b − | P ip∗i|2 and ∆E = P i q m2 i + p∗2i − Eb∗, where Eb∗ is the
beam energy in the CM frame. For signal events, the mES distribution peaks at the B meson mass
and has a width σmES ≈ 2.5 MeV/c
2, and the ∆E distribution peaks near zero, with a typical width
σ∆E ≈ 20 MeV. The mean and width of the mES and ∆E distributions are determined separately
for e+e−and µ+
µ−modes using data control samples. For events reconstructed as e±µ∓we assume
the same width and mean as for the e+e− modes.
We define two kinematic regions in terms of mES and ∆E for signal extraction purposes. The
signal region is defined to be within 2σ of the expected mean of the peak in mES and ∆E. The
values are given in Table 1. A 2σ signal region width was found to be close to optimal for both the S/√S + B and S/√B figure of merit, where S and B are the number of signal and background events expected based on Monte Carlo simulations.
Table 1: Boundary values defining the signal region for each B → πℓ+ℓ− mode. The boundaries
used in the B+
→ π+eµ and B0
→ π0eµ modes are the same as for B+
→ π+e+e− and B0
→ π0e+e− modes, respectively.
mode mES low mES high ∆E low ∆E high
[GeV/c2] [GeV/c2] [MeV] [MeV]
B+→π+e+e− 5.2748 5.2847 -53.6 37.4
B0→π0e+e− 5.2767 5.2839 -115.0 82.5
B+→π+µ+µ− 5.2749 5.2847 -42.0 35.0
B0→π0µ+µ− 5.2764 5.2836 -87.4 68.0
We blind ourselves from inspecting the signal region, and also a broader region in the mES–∆E
plane, until all selection criteria are optimized and control samples are checked. The broader region is used to determine the number of background events from an unbinned maximum likelihood fit directly from the data. This fit region is defined as 5.2 GeV/c2 < m
ES and |∆E| < 0.25 GeV.
Backgrounds arise from three main sources: random combinations of particles from q ¯q and τ+τ− events produced in the continuum, random combinations of particles from Υ (4S) → BB
decays, and B decays to topologies similar to the signal modes. The first two, “combinatorial”, backgrounds typically arise from pairs of semileptonic decays and produce broad distributions in mESand ∆E compared to the signal. The third source arises from modes which have shapes similar
to the signal, such as B → J/ψπ, with J/ψ → ℓ+ℓ−, or B → Kππ, with kaons or pions misidentified
as muons. All selection criteria are optimized with GEANT4 [13] simulated data, independent data control samples or with data samples outside the full fit region.
We suppress combinatorial background from continuum processes by selecting events with high values in a Fisher discriminant [14] constructed as a linear combination of variables with coefficients optimized to distinguish between signal and background. The variables (defined in the CM frame) are (1) the ratio of second- to zeroth-order Fox-Wolfram moments [15] for the event, computed using all charged tracks and neutral energy clusters; (2) the absolute value of the angle between the thrust axis of the B candidate and that of the remaining particles in the event; (3) the production
angle θB of the B candidate with respect to the beam axis; and (4) the ratio of second- to
zeroth-order Legendre moments [16] for the event, computed using all charged tracks and neutral energy clusters. These variables exploit the difference between the relatively spherical track distribution in B ¯B events and the jet-like structure of continuum events.
We suppress combinatorial backgrounds from BB events by selecting events with high values in a likelihood function constructed from (1) the missing energy of the event, computed from all charged tracks and neutral energy clusters; (2) the vertex fit probability of all tracks from the B candidate; (3) the vertex fit probability of the two leptons; and (4) the angle θB of the B
candidate with respect to the beam axis in the direction of the negative electron beam. Missing energy provides the strongest suppression of combinatorial B ¯B background events, which typically contain energetic neutrinos from at least two semileptonic B or D meson decays.
Both the continuum and B ¯B suppression discriminants are constructed separately for each e+e−
and µ+µ−mode. Parameters of the Fisher discriminant have been determined from simulated
sig-nal events and a data control sample selected below the Υ (4S) energy. The likelihood function parameters have been determined from simulated signal events and simulated generic BB events to separate signal events from other types of BB backgrounds. For each reconstruction mode, the required minimum values of the Fisher and likelihood functions are optimized simultaneously by maximizing S/√S + B, where S is the expected signal yield in the signal region, and B is the expected background yield in the signal region based on a combination of generic BB and contin-uum Monte Carlo simulated events. The background yields are extracted from a two-dimensional, unbinned, maximum-likelihood fit to the simulated events in the fit region. A branching fraction of B(B → πℓℓ) of 3.3 × 10⁻⁸ [10] is assumed as the signal estimate. The optimal selection criteria
do not change significantly if we alternatively optimize for S/√B. For the πe±µ∓ sample we use
the same parameters and optimal selection points as found for the e+e− modes.
The most prominent backgrounds that peak in the signal region are B decays to charmonium: B → J/ψ π (with J/ψ → ℓ+ℓ−). The more abundant B → J/ψ K decay also contributes as
background to B → π ℓ+ℓ−. This latter background is strongly suppressed by particle
identi-fication requirements, and such events typically have a reconstructed B energy which is lower than expected for our signal mode, so that most of these events are outside the signal region for B → π ℓ+ℓ−. Similarly, B decays to ψ(2S)π(K) final states contribute with a peaking
back-ground component. We exclude dilepton pairs with dilepton invariant mass mℓ+ℓ− consistent with the J/ψ mass (2.90 < me+e− < 3.20 GeV/c
2 and 3.00 < m
µ+µ− < 3.20 GeV/c
2) or with the
ψ(2S) mass (3.60 < mℓ+ℓ− < 3.75 GeV/c
2). This veto is also applied to m
e+e− computed without bremsstrahlung photon recovery. When a lepton radiates or is mismeasured, mℓ+ℓ− can shift away from the charmonium mass, while ∆E shifts in a correlated manner. Therefore, we apply an ad-ditional veto with mℓ+ℓ− veto regions defined as a linear function of ∆E. By extending the veto region this way, we remove nearly all charmonium events from the fit region and simplify the shape of the background PDF in the fit region. For e±µ∓ the charmonium vetoes are defined to be the
same as for the e+e− modes.
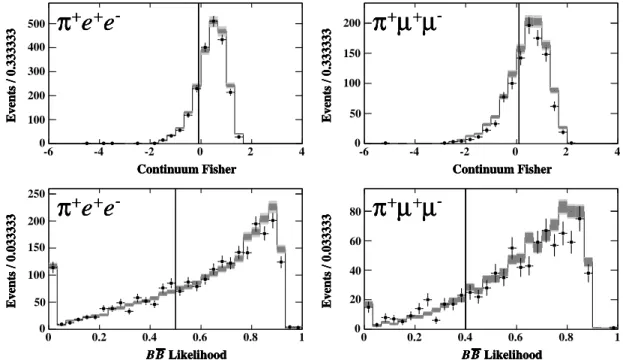
The charmonium events removed by these vetoes are otherwise kinematically similar to signal events. These events therefore serve as copious control samples for studying signal shapes, selec-tion efficiencies, and systematic errors. Figure 2 shows the distribuselec-tions of the two background rejection variables for the B+ → J/ψ K+ control sample. This sample is selected with identical requirements as our signal sample, except the J/ψ veto has been reversed and the hadron track passes kaon identification. The figure also shows the distributions for simulated B+
→ J/ψ; K+
and bound systematic uncertainties of lepton identification, Fisher discriminant, and B likelihood requirements.
In addition to studying the efficiencies using the charmonium control sample, we measure the branching fractions of B(B → J/ψ π) using B → πℓ+ℓ− candidates which fail the charmonium
veto. The measured branching fractions are consistent with the world averages for these modes [17].
-6 -4 -2 0 2 4 0 100 200 300 400 500 Continuum Fisher Events / 0.333333
-e
+e
+π
Continuum Fisher Events / 0.333333-e
+e
+π
Continuum Fisher Events / 0.333333-e
+e
+π
Continuum Fisher Events / 0.333333-e
+e
+π
-6 -4 -2 0 2 4 0 50 100 150 200 Continuum Fisher Events / 0.333333-µ
+µ
+π
Continuum Fisher Events / 0.333333-µ
+µ
+π
Continuum Fisher Events / 0.333333-µ
+µ
+π
Continuum Fisher Events / 0.333333-µ
+µ
+π
0 0.2 0.4 0.6 0.8 1 0 50 100 150 200 250 Likelihood B B Events / 0.033333-e
+e
+π
Likelihood B B Events / 0.033333-e
+e
+π
Likelihood B B Events / 0.033333-e
+e
+π
Likelihood B B Events / 0.033333-e
+e
+π
0 0.2 0.4 0.6 0.8 1 0 20 40 60 80 Likelihood B B Events / 0.033333-µ
+µ
+π
Likelihood B B Events / 0.033333-µ
+µ
+π
Likelihood B B Events / 0.033333-µ
+µ
+π
Likelihood B B Events / 0.033333-µ
+µ
+π
Figure 2: Distribution of the Fisher and likelihood variables in the J/ψK+ control sample. The
black points are BABAR data events and the histograms show comparison with simulated events, with statistical and systematic uncertainties shown in the dark and light gray bands, respectively. The vertical lines indicate the optimal cut values for each variable. Our event selection corresponds to events to the right of the vertical line.
In modes with two muons in the final state, where the probability for a hadron to be misidentified as a muon can be as high as a few percent, background from hadronic B-decays like B → Dπ with D → ππ or D → Kπ is significant. These events are suppressed by vetoing events where the B → π ℓ+ℓ− kinematics are consistent with those of a hadronic D decay. We evaluate the
mℓ+ℓ− and mπℓ invariant masses with π or K mass hypotheses on the tracks in all combinations corresponding to known D-meson decay modes; we veto those events which have two oppositely-charged tracks with an invariant mass within the range 1.84 − 1.89 GeV/c2, or events which have
a neutral pion and charged track combination with an invariant mass within the range 1.79 − 1.94 GeV/c2.
If more than one charged B-meson candidate remain after all selection requirements have been applied, we select the candidate for which the pion has the greatest number of hits in the SVT tracking detector. If more than one neutral B-meson candidate remain, we select the first one that appears in our data sample (i.e. a random candidate); the efficiency of this choice is nearly identical to choosing based on the reconstructed π0 mass. These criteria are chosen in favor of
extraction variables mES and ∆E. More than one B candidate per event occurs in about
13-15% of charged-B signal events and 35-60% of neutral-B signal events, and typically the multiple candidates are due to more than one possible π candidate. For the e±µ∓ modes more than one B
candidate occurs in about 5% of events.
3.2 Signal Extraction and Background Estimate
The signal is extracted by counting events in the signal region. An upper limit on the branching fraction B(B → π ℓ+ℓ−) is determined from the observed number of events and the expected
number of background events in this region. We determine the background expectation before inspecting the signal region.
The number of combinatorial background events is extracted by performing a two-dimensional unbinned maximum-likelihood fit to mESand ∆E in the region mES< 5.2724 GeV/c2 and |∆E| <
0.25 GeV. The background probability distribution function (PDF) is modeled as the product of an ARGUS function [18] for mES and an exponential function for ∆E. The slopes and normalization
of these functions are floating in the fit, while the endpoint of the ARGUS function is fixed to 5.290 GeV/c2. The PDF is extrapolated into the signal region (up to m
ES < 5.290 GeV/c2) and
the expected number of background events in the signal region is obtained from integrating the PDF over the signal region. The expected number of combinatorial background events is given in Table 2.
We estimate the remaining hadronic B background from a data control sample of mainly B → πππ and B → Kππ events. In the signal sample these events are highly suppressed by the lepton identification criteria. For the hadronic control sample we select events where the charged tracks fail electron and muon identification, except that for data reduction purposes we require that one track (and only one) pass a looser muon identification criteria which still has a high hadron fake rate. This selects a sample of predominantly hadronic events. These hadronic events are further weighted by their probability to pass the signal-selection muon identification, by weighting each track with a probability depending on its particle type hypothesis, momentum and direction. These track-by-track probabilities are determined from data control samples specifically selected to study particle identification efficiencies. Looking at events with a ∆E consistent with a correctly reconstructed B-meson, we fit the weighted mES distribution for these events to obtain the expected number of
hadronic peaking background events in the signal region. We estimate a background of 0.06 ± 0.05 events in the π+µ+µ−channel and 0.11 ± 0.04 events in the π0µ+µ− channel, where the dominant
uncertainty is the statistical uncertainty of the fit. We expect no such peaking background in the electron modes or in the eµ modes.
B-meson decays to K ℓ+ℓ− and ρ ℓ+ℓ− in the final state are the only other major peaking
background components expected. The former shift toward lower reconstructed B energy and are mostly outside the 2σ signal region. This is the sole largest peaking background component for the π+e+e− mode. The latter contribute even less, since the reconstructed B in these cases is missing
a pion. These estimates are based on high-statistics samples of simulated events. In total, we estimate the number of peaking background events from leptonic events to range from 0.07 ± 0.02 events for the π+e+e−mode down to 0.02 ± 0.01 events for the π0µ+µ−mode. No leptonic peaking
background is expected in the eµ modes.
After the vetoes of B → J/ψ π(K) and B → ψ(2S) π(K) decays, no remaining background from these are expected, as estimated from Monte Carlo simulations.
Table 2 summarizes the number of background events expected in the signal region and the systematic uncertainties associated with these estimates.
Table 2: Estimated number of background events and their associated systematic uncertainties. The mES-∆E fit uncertainties are evaluated by varying the parameters of the fit by ±1σ, and the
mES-∆E correlations and ∆E shape uncertainties are evaluated from using alternative probability
density functions. Estimates and systematics from the peaking background are based on Monte Carlo and control sample studies.
Systematic π+e+e− π0e+e− π+µ+µ− π0µ+µ− π+eµ π0eµ
mES-∆E fit 0.89 ± 0.31 0.43 ± 0.21 0.86 ± 0.24 0.22 ± 0.18 1.48 ± 0.33 1.13 ± 0.40 mES-∆E correlations ±0.02 ±0.03 ±0.06 ±0.03 ±0.17 ±0.05 ∆E shape ±0.03 ±0.03 ±0.15 ±0.02 ±0.31 ±0.24 Leptonic peaking bkg. 0.07 ± 0.02 0.03 ± 0.01 0.04 ± 0.01 0.02 ± 0.01 0.00 ± 0.00 0.00 ± 0.00 Hadronic peaking bkg. 0.00 ± 0.00 0.00 ± 0.00 0.06 ± 0.05 0.11 ± 0.04 0.00 ± 0.00 0.00 ± 0.00 Total 0.96 ± 0.32 0.46 ± 0.22 0.96 ± 0.30 0.35 ± 0.19 1.48 ± 0.48 1.13 ± 0.47
4
Systematic Uncertainties
In evaluating systematic uncertainties for the branching fractions, we consider both the uncer-tainties that affect the signal efficiency estimate, and unceruncer-tainties arising from the background estimate. Table 3 lists the systematic uncertainties considered for the signal efficiency. Sources of uncertainties that affect the efficiency are: charged-particle tracking efficiency (0.8% per lep-ton, 1.4% per charged hadron), charged-particle identification (0.7% per electron pair, 1.9% per muon pair, 0.5% per pion), the continuum background and BB suppression selection (1.4%–1.9% depending on the mode), and signal simulation statistics (0.1%). The estimated number of BB events in our data sample has an uncertainty of 1.1%. An additional systematic uncertainty for the efficiency results from the choice of form factor model, which alters the q2 distribution of the
signal. We take this uncertainty to be the same as found in [6], which uses the same signal model as this analysis.
Finally, the uncertainties due to the signal efficiency of the mESand ∆E selection requirements
are determined from the measured mean and width of these distributions in charmonium control samples. For B+
→ π+ℓ+ℓ−, we use samples of B → J/ψK+ events, in which the mean and width
are precisely bounded; for B0 → π0ℓ+ℓ−, we use samples of B → J/ψπ0
events, which have limited statistics and introduce a total systematic uncertainty of 7%. For the electron modes, we allow for a larger or smaller bremsstrahlung tail in the ∆E distribution, introducing a systematic uncertainty of 1-2%. The total systematic uncertainty of the signal efficiency is 5% for B+→ π+ℓ+ℓ− and 9%
for B0
→ π0ℓ+ℓ−.
Systematic uncertainties for the estimated backgrounds arise from two sources: uncertainties of the maximum likelihood fit which determines the combinatorial background, and uncertainties of the peaking background estimates. Table 2 summarizes the sources of background systematics. In the maximum likelihood fit to the region defined by 5.2 < mES < 5.2724 GeV/c2 and |∆E| <
0.25 GeV, the uncertainty of the extrapolated signal box yield is determined from the induced change due to ±1σ variations in the fit region yield, the slope parameter in the mESPDF, and the exponent
of the ∆E PDF. We also consider the effect of using different PDF parameterizations on the background estimates, and use the computed differences to bound a systematic uncertainty. We fit a PDF which is correlated in mESand ∆E via a linear ∆E dependence in mESslope parameter. We
also estimate background from fits for which the ∆E PDF is a linear or quadratic polynomial. These alternative fits result in differences in estimated background generally smaller than the uncertainties
Table 3: The sources of systematic uncertainty in signal efficiency (%) considered for π ℓ+ℓ−decays.
Systematic π+e+e− π0e+e− π+µ+µ− π0µ+µ− π+eµ π0eµ
Trk eff. ±3.0 ±1.6 ±3.0 ±1.6 ±3.0 ±1.6
Electron ID ±0.7 ±0.7 ±0.4 ±0.4
Muon ID ±1.9 ±1.9 ±1.0 ±1.0
Pion ID ±0.5 ±0.5 ±0.5
π0ID ±3.0 ±3.0 ±3.0
Fisher and B ¯B likelihood ±1.4 ±1.4 ±1.7 ±1.9 ±1.4 ±1.4
MC statistics ±0.1 ±0.1 ±0.1 ±0.1 ±0.1 ±0.1
B ¯B counting ±1.1 ±1.1 ±1.1 ±1.1 ±1.1 ±1.1
Model dep. ±3.0 ±3.0 ±3.0 ±3.0 ±3.0 ±3.0
signal mESmodel ±0.3 ±5.1 ±0.4 ±4.9 ±0.3 ±5.1
signal ∆E model ±0.6 ±5.1 ±0.5 ±5.4 ±0.5 ±5.2
signal ∆E radiative tail ±1.2 ±1.3 ±1.0 ±1.4
Total ±4.9 ±8.8 ±5.1 ±9.0 ±4.9 ±8.9
of the baseline fit. The uncertainty of the hadronic B decay peaking background is dominated by the control sample statistics from which it is derived; the leptonic peaking background uncertainties are dominated by the uncertainty of the assumed branching fractions for these processes, particularly B+
→ K+ℓ+ℓ−.
Figures 3 and 4 show projections onto mES and ∆E of a two-dimensional unbinned
maximum-likelihood fit to measure the number of background events. The best fit PDFs are consistent with the observed data. The fit region yields for each mode are also consistent with the simulated pre-dictions from which optimization of selection criteria were derived. We estimate the combinatorial background in the signal region from these PDFs and those estimates together with the peaking backgrounds result in about one event per decay mode expected in the signal region.
5
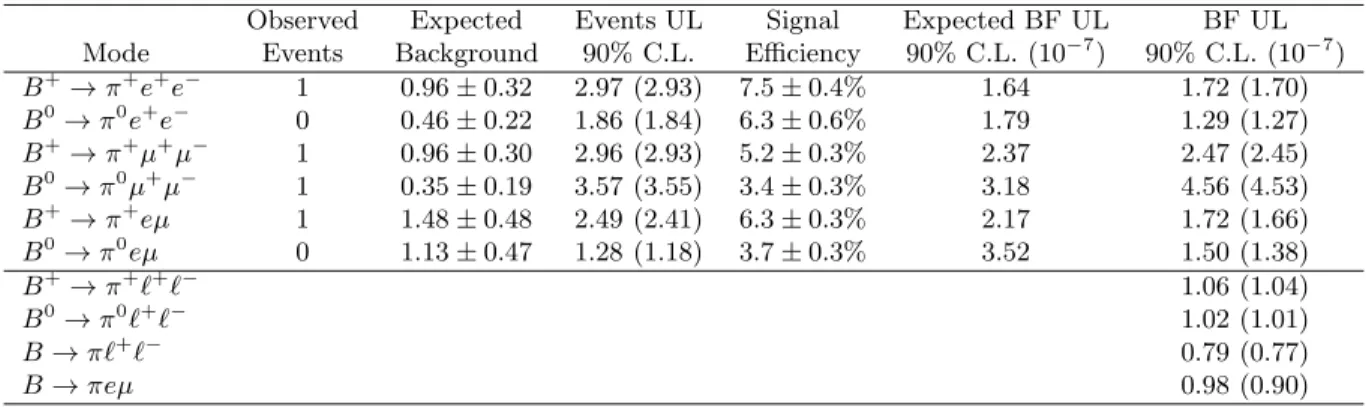
Results
Figure 5 shows a scatter plot of the fit region with events from the BABAR data that pass all our selection criteria. The signal events are expected to be found in the signal region marked by a box drawn in the plot. We observe a total of 3 B → πℓ+ℓ− candidates and 1 B → πeµ candidate in the
signal region. This is consistent with no significant signal above the expected backgrounds, so we calculate upper limits at 90% confidence level via a frequentist method which takes into account uncertainties both in the signal sensitivity and in the expected background [19]. The limits are presented in Table 4, along with all numbers necessary in this method to perform the calculation. The upper limits for the electron and electron-muon modes are in the range of 1−2×10⁻⁷; the muon
modes are somewhat less sensitive with limits in the range of 2 − 5 × 10⁻⁷. Assuming the partial
widths of B → πℓ+ℓ− to electrons and muons are equal, the limits for the two decay modes can
be simply combined to provide a combined limit of 1.06 × 10⁻⁷ for B+
→ π+ℓ+ℓ−and 1.02 × 10⁻⁷
for B0 → π0ℓ+ℓ−. Assuming further that there is isospin asymmetry in the partial widths of
B → πℓ+ℓ− to charged and neutral pions, the four B → πℓ+ℓ− modes can be combined with the
constraint B(B0
→ π0ℓ+ℓ−) = 1
2 × τB0/τB+ × B(B+ → π+ℓ+ℓ−) to compute a combined limit, expressed in terms of the B+
→ π+ℓ+ℓ− branching fraction, of 0.79 × 10⁻⁷. A similar combined
Table 4: Results for the B → πℓ+ℓ−analysis, including observed signal candidate events, expected
background, signal yield upper limit at 90% confidence level, signal efficiency, expected branching fraction upper limit at 90% confidence level, and the observed branching fraction upper limit at 90% confidence level. The numbers in parentheses are limits evaluated without the inclusion of systematic uncertainties. Combined limits at the bottom are derived from simultaneous limits calculated from the individual modes.
Observed Expected Events UL Signal Expected BF UL BF UL
Mode Events Background 90% C.L. Efficiency 90% C.L. (10−7) 90% C.L. (10−7)
B+→π+e+e− 1 0.96 ± 0.32 2.97 (2.93) 7.5 ± 0.4% 1.64 1.72 (1.70) B0→π0e+e− 0 0.46 ± 0.22 1.86 (1.84) 6.3 ± 0.6% 1.79 1.29 (1.27) B+→π+µ+µ− 1 0.96 ± 0.30 2.96 (2.93) 5.2 ± 0.3% 2.37 2.47 (2.45) B0→π0µ+µ− 1 0.35 ± 0.19 3.57 (3.55) 3.4 ± 0.3% 3.18 4.56 (4.53) B+→π+eµ 1 1.48 ± 0.48 2.49 (2.41) 6.3 ± 0.3% 2.17 1.72 (1.66) B0→π0eµ 0 1.13 ± 0.47 1.28 (1.18) 3.7 ± 0.3% 3.52 1.50 (1.38) B+→π+ℓ+ℓ− 1.06 (1.04) B0→π0ℓ+ℓ− 1.02 (1.01) B → πℓ+ℓ− 0.79 (0.77) B → πeµ 0.98 (0.90)
Table 4 also lists the mean expected upper limits, defined as a sum of upper limits obtained for n events observed (n = 0, 1, 2...), each weighted by the Poisson probability of observing n events when expecting background only.
6
Conclusion
We present a preliminary result of a search for B → πℓ+ℓ− using a sample of (230.1 ± 2.5) × 106
BB pairs produced at the Υ (4S) resonance. We do not see any excess of events in the signal region, and we measure the upper limit at 90% confidence level of the lepton-flavor–averaged branching fraction to be
B(B+ → π+ℓ+ℓ−) = 2 ×τB+ τB0B(B
0
→ π0ℓ+ℓ−) < 7.9 × 10⁻⁸,
consistent with the Standard Model prediction of 3.3×10⁻⁸. This is the first such search performed
by the B factory experiments; with anticipated final samples of order 1 ab−1, and with the small
backgrounds observed in this analysis, it may be possible in the future to achieve an experimental sensitivity comparable to the Standard Model prediction.
7
Acknowledgments
We are grateful for the extraordinary contributions of our PEP-II colleagues in achieving the excellent luminosity and machine conditions that have made this work possible. The success of this project also relies critically on the expertise and dedication of the computing organizations that support BABAR. The collaborating institutions wish to thank SLAC for its support and the kind hospitality extended to them. This work is supported by the US Department of Energy and National Science Foundation, the Natural Sciences and Engineering Research Council (Canada), Institute of High Energy Physics (China), the Commissariat `a l’Energie Atomique and Institut
National de Physique Nucl´eaire et de Physique des Particules (France), the Bundesministerium f¨ur Bildung und Forschung and Deutsche Forschungsgemeinschaft (Germany), the Istituto Nazionale di Fisica Nucleare (Italy), the Foundation for Fundamental Research on Matter (The Netherlands), the Research Council of Norway, the Ministry of Science and Technology of the Russian Federation, and the Particle Physics and Astronomy Research Council (United Kingdom). Individuals have received support from the Marie-Curie IEF program (European Union) and the A. P. Sloan Foundation.
References
[1] G. Burdman, Phys. Rev. D 52, 6400 (1995).
[2] J. L. Hewett and J. D. Wells, Phys. Rev. D 55, 5549 (1997). [3] A. Ali et al., Phys. Rev. D 66, 034002 (2002).
[4] G. Eilam, J. L. Hewett, and T. G. Rizzo, Phys. Rev. D 34, 2773 (1986); T. M. Aliev, A. Ozpineci, and M. Savci, Eur. Phys. J. C29, 265 (2003).
[5] S. Davidson, D. C. Bailey, and B. A. Campbell, Z. Phys. C 61, 613 (1994). [6] BABAR Collaboration, B. Aubert et al., Phys. Rev. D 73, 092001 (2006).
[7] Belle Collaboration, M. Iwasaki et al., Phys. Rev. D 72, 092005 (2005); BABARCollaboration, B. Aubert et al., Phys. Rev. Lett. 93, 081802 (2004); Belle Collaboration, A. Ishikawa et al., Phys. Rev. Lett. 91, 261601 (2003).
[8] Belle Collaboration, D. Mohapatra et al., Phys. Rev. Lett. 96, 221601 (2006); BABAR Collab-oration, B. Aubert et al., Phys. Rev. Lett. 94, 011801 (2005).
[9] Mark II Collaboration, A. J. Weir et al., Phys. Rev. D 41 1384 (1990). [10] T. M. Aliev and M. Savci, Phys. Rev. D 60, 014005 (1999).
[11] CLEO Collaboration, K. W. Edwards et al., Phys. Rev. D 65, 111102 (2002).
[12] BABAR Collaboration, B. Aubert et al., Nucl. Instrum. Methods A479, 1-116 (2002). [13] S. Agostinelli et al., Nucl. Instrum. Methods A 506, 250 (2003).
[14] R.A. Fisher, Ann. Eugenics 7, 179 (1936).
[15] G.C. Fox and S. Wolfram, Phys. Rev. Lett. 41, 1581 (1978).
[16] The i-th moment Li is defined by Li =Pj|pj∗|| cos(θ∗j)|i, where the p∗j are the CM momenta
of all particles not used in reconstructing the signal B candidate, and the angle θ∗
j is between
the particle’s momentum and the thrust axis of the signal B. [17] W.-M. Yao et al. (Particle Data Group), J. Phys. G 33, 1 (2006).
[18] The function is f (x) ∝ x√1 − x2exp [−ζ(1 − x2)], where the slope ζ is a fit parameter and
x = mES/Eb∗; ARGUS Collaboration, H. Albrecht et al., Z. Phys. C 48, 543 (1990).
5.2 5.22 5.24 5.26 5.28 0 5 10 15 20 25 5.2 5.22 5.24 5.26 5.28 0 5 10 15 20 25
-e
+e
+π
) 2 c (GeV/ ES m 2 c Events / 0.009 GeV/B
A
B
AR
preliminary -0.2 -0.1 0 0.1 0.2 0 5 10 15 20 25 -0.2 -0.1 0 0.1 0.2 0 5 10 15 20 25-e
+e
+π
(GeV) E ∆ Events / 0.050 GeV 5.2 5.22 5.24 5.26 5.28 0 2 4 6 8 10 12 14 16 5.2 5.22 5.24 5.26 5.28 0 2 4 6 8 10 12 14 16-e
+e
0π
) 2 c (GeV/ ES m 2c Events / 0.009 GeV/ -0.2 -0.1 0 0.1 0.2 0 2 4 6 8 10 12 -0.2 -0.1 0 0.1 0.2 0 2 4 6 8 10 12π
0e
+e
(GeV) E ∆ Events / 0.050 GeV 5.2 5.22 5.24 5.26 5.28 0 5 10 15 20 5.2 5.22 5.24 5.26 5.28 0 5 10 15 20π
+µ
+µ
-) 2 c (GeV/ ES m 2 c Events / 0.009 GeV/ -0.2 -0.1 0 0.1 0.2 0 5 10 15 20 25 -0.2 -0.1 0 0.1 0.2 0 5 10 15 20 25-µ
+µ
+π
(GeV) E ∆ Events / 0.050 GeV 5.2 5.22 5.24 5.26 5.28 0 2 4 6 8 10 12 5.2 5.22 5.24 5.26 5.28 0 2 4 6 8 10 12-µ
+µ
0π
) 2 c (GeV/ ES m 2c Events / 0.009 GeV/ -0.2 -0.1 0 0.1 0.2 0 2 4 6 8 10 -0.2 -0.1 0 0.1 0.2 0 2 4 6 8 10π
0µ
+µ
(GeV) E ∆ Events / 0.050 GeVFigure 3: Projections of mES and ∆E of B → πℓ+ℓ− events in the full fit region. Superimposed
is the PDF we use to model combinatorial background. The parameters were obtained from two-dimensional unbinned maximum-likelihood fits to events outside the signal region, with mES <
5.2 5.22 5.24 5.26 5.28 0 5 10 15 20 25 30 35 5.2 5.22 5.24 5.26 5.28 0 5 10 15 20 25 30 35
µ
e
+π
) 2 c (GeV/ ES m 2 c Events / 0.009 GeV/B
A
B
AR
preliminary -0.2 -0.1 0 0.1 0.2 0 10 20 30 40 -0.2 -0.1 0 0.1 0.2 0 10 20 30 40π
+e
µ
(GeV) E ∆ Events / 0.050 GeV 5.2 5.22 5.24 5.26 5.28 0 2 4 6 8 10 12 14 16 5.2 5.22 5.24 5.26 5.28 0 2 4 6 8 10 12 14 16µ
e
0π
) 2 c (GeV/ ES m 2 c Events / 0.009 GeV/ -0.2 -0.1 0 0.1 0.2 0 5 10 15 20 -0.2 -0.1 0 0.1 0.2 0 5 10 15 20π
0e
µ
(GeV) E ∆ Events / 0.050 GeVFigure 4: Projections of mES and ∆E of B → πeµ events in the full fit region. Superimposed
is the PDF we use to model combinatorial background. The parameters were obtained from two-dimensional unbinned maximum-likelihood fits to events outside the signal region with mES <
5.2 5.22 5.24 5.26 5.28 5.3 -0.2 -0.1 0 0.1 0.2 ) 2 c (GeV/ ES m (GeV) E ∆
-e
+
e
+
π
B
AB
AR preliminary 5.2 5.22 5.24 5.26 5.28 5.3 -0.2 -0.1 0 0.1 0.2 ) 2 c (GeV/ ES m (GeV) E ∆-µ
+
µ
+
π
5.2 5.22 5.24 5.26 5.28 5.3 -0.2 -0.1 0 0.1 0.2 ) 2 c (GeV/ ES m (GeV) E ∆-e
+
e
0
π
5.2 5.22 5.24 5.26 5.28 5.3 -0.2 -0.1 0 0.1 0.2 ) 2 c (GeV/ ES m (GeV) E ∆-µ
+
µ
0
π
5.2 5.22 5.24 5.26 5.28 5.3 -0.2 -0.1 0 0.1 0.2 ) 2 c (GeV/ ES m (GeV) E ∆µ
e
+
π
5.2 5.22 5.24 5.26 5.28 5.3 -0.2 -0.1 0 0.1 0.2 ) 2 c (GeV/ ES m (GeV) E ∆µ
e
0
π
Figure 5: Distribution in two dimensions (mES and ∆E) of events in the background fit region
passing the selection. The small box defines the signal region from which signal candidates are selected.