ORIGINAL ARTICLE
Distribution of artifactual gas on post-mortem multidetector
computed tomography (MDCT)
Coraline Egger&Pierre Bize&Paul Vaucher&Pascal Mosimann&
Benjamin Schneider&Alejandro Dominguez&Reto Meuli&Patrice Mangin& Silke Grabherr
Received: 19 August 2010 / Accepted: 20 December 2010 / Published online: 5 January 2011 # Springer-Verlag 2010
Abstract
Purpose We investigated the incidence and distribution of post-mortem gas detected with multidetector computed tomography (MDCT) to identify factors that could distin-guish artifactual gas from cardiac air embolism.
Material and methods MDCT data of 119 cadavers were retrospectively examined. Gas was semiquantitatively assessed in selected blood vessels, organs, and body spaces (82 total sites).
Results Seventy-four of the 119 cadavers displayed gas (62.2%; CI 95% 52.8–70.9), and 56 (75.7%) displayed gas in the heart. Most gas was detected in the hepatic parenchyma (40%), right heart (38% ventricle, 35% atrium), inferior vena cava (30% infrarenally, 26% supra-renally), hepatic veins (26% left, 29% middle, 22% right), and portal spaces (29%). Male cadavers displayed gas more
frequently than female cadavers. Gas was detected 5–84 hours after death; therefore, the post-mortem interval could not reliably predict gas distribution (rho=0.719, p<0.0001). We found that a large amount of putrefaction-generated gas in the right heart was associated with aggregated gas bubbles in the hepatic parenchyma (sensitivity =100%, specificity = 89.7%). In contrast, gas in the left heart (sensitivity =41.7%, specificity =100%) or in periumbilical subcutaneous tissues (sensitivity =50%, specificity=96.3%) could not predict gas due to putrefaction.
Conclusion This study is the first to show that the appearance of post-mortem gas follows a specific distribu-tion pattern. An associadistribu-tion between intracardiac gas and hepatic parenchymal gas could distinguish between post-mortem-generated gas and vital air embolism. We propose that this finding provides a key for diagnosing death due to cardiac air embolism.
Keywords Forensic medicine . Computed tomography . Post-mortem changes . Putrefaction . Gas embolism
Introduction
Preautopsy post-mortem imaging examinations are increas-ingly utilized in forensic medicine. Currently, few individ-uals have the knowledge required to interpret post-mortem images, particularly for distinguishing post-mortem artifacts due to gas. Forensic pathologists lack practitioner experi-ence in imaging analysis, and radiologists must be aware of the differences between post-mortem and clinical images [1,2].
In clinical radiology, it is often necessary to exclude air embolism, particularly after radiologic, cardiologic, or neurosurgical procedures that involve subatmospheric
Electronic supplementary material The online version of this article (doi:10.1007/s00414-010-0542-5) contains supplementary material, which is available to authorized users.
C. Egger (*)
:
P. Vaucher:
B. Schneider:
A. Dominguez:
P. Mangin:
S. GrabherrUniversity Center of Legal Medicine Lausanne-Geneva, University of Lausanne,
Rue du Bugnon 21,
Lausanne CH-1011, Switzerland e-mail: [email protected]
P. Bize
:
P. Mosimann:
B. Schneider:
R. Meuli Department of Diagnostic and Interventional Radiology, University Hospital of Lausanne,Rue du Bugnon 46,
Lausanne CH-1011, Switzerland A. Dominguez
School of Health Sciences, Radiologic Medical Imaging Technology, University of Applied Sciences,
Rue du Bugnon 19,
Lausanne CH-1011, Switzerland DOI 10.1007/s00414-010-0542-5
venous pressure at the site of intervention [3] or gas forced under pressure into a body cavity [4]. Air embolism can be confirmed in three different ways: precordial ultrasound Doppler, transesophageal echocardiography, and multide-tector computed tomography (MDCT). The two former are sensitive and practical methods for detecting intracardiac gas [5, 6], but MDCT is more useful when gas bubbles have spread throughout the body. The MDCT is performed with a contrast agent that is injected into the veins. A hypodense gap within the cardiovascular system (air–fluid level) is interpreted as an air embolism [7,8].
Among modern imaging technologies, MDCT is the most often used in forensic imaging [9]. One advantage of MDCT is that its spatial resolution permits gas detection in cadavers [2,9–17], which is useful for diagnosing gas collections that represent air embolisms [18]. The high sensitivity of MDCT enables the detection of very small amounts of gas that cannot be detected in an autopsy. Indeed, several studies have reported gas collections in post-mortem MDCT examinations, particularly in blood vessels [11,14]. On the other hand, this advantage also presents the problem of how to interpret the detected gas. Although it has high sensitivity, the MDCT lacks specificity; it detects any gas [16]. Thus, forensic pathologists are confronted with new findings, but no way to differentiate between the gas formed during post-mortem putrefaction [1, 11] and that due to vital air embolism.
In forensic medicine, the detection of air embolism is important for determining cause of death. According to Frey [19], air embolism is defined as the penetration of gas into the vascular system and its diversion due to blood flow. Most commonly, gas enters the venous system due to a lesion that exposes a vein. This venous air embolism is transported into the right cardiac atrium and ventricle, where it mixes with blood during cardiac contraction. The gas bubbles can then block blood circulation by filling pulmonary arteries and/or the right atrium and ventricle, which leads to heart failure [20]. In conventional autopsy, the diagnosis of air embolism requires a special examina-tion technique. The first method, described by Mercier [21] requires opening the thoracic cavity without damaging the thoracic veins. Then, the pericardium is opened and filled with water. Next, the right ventricle is punctured with a scalpel beneath the water surface. The emission of gas bubbles reveals the presence of air embolism. In order to distinguish between an intravital air embolism and post-mortem gas, the same procedure must be performed on the left ventricle. When the left ventricle also emits gas bubbles, the presence of gas cannot be interpreted. The second method, described by Dyrenfurth, used an aspir-ometer [22]. This tool enabled the aspiration of gas in order to measure gas volume and analyze gas composition. Gas composition is determined with gas chromatography, which
uses a thermoconducting detector to separate oxygen, nitrogen, carbon dioxide, methane, and hydrogen. Because the composition of gas in air embolism is different from that of post-mortem gas, this method clearly distinguishes between the two [20].
To achieve the distinction between vital air embolism and gas from putrefaction on a post-mortem MDCT, it is essential to study the relationships between the pattern of gas distribution [1,11], the post-mortem interval, and the position of the cadaver at death [16]. To our knowledge, no basic studies have systematically investigated the distribu-tion of post-mortem gas in the human body.
The aim of this study was to investigate the incidence and distribution of gas observed on post-mortem MDCT, and to determine factors that might enable the interpretation of the gas, particularly in the identification of vital air embolism.
Materials and methods Subjects
This retrospective, descriptive study included 119 cadavers that had been scanned prior to external examination, the standard practice in our institute. The subjects were deceased without trauma or any invasive medical interven-tion. No supplementary examination was required. Cases were excluded when they had bodily lesions that would allow contamination with external gas (gunshot injuries, knife wounds, open trauma, injection marks). The subjects comprised 84 men and 35 women, ranging in age from 20 to 101 years (mean age: 64.3). The causes of death included natural, suicide by hanging, and suicide by absorption of a lethal dose of sodium pentobarbital.
The post-mortem intervals between death and MDCT examinations ranged from approximately 3 h to 12 days. The times of death were documented on police reports or medical reports. In some cases, the exact time of death was unknown. It was then estimated according to information provided by witnesses (time last seen alive, date of mail in the mailbox, and calendar page in the house/apartment) and by the external examination protocol (rectal temperature, rigor mortis, and fixation of post-mortem lividity).
MDCT
The MDCT scans were performed with a LightSpeed Ultra 8 row MDCT from General Electric. Frontal and profile scouts of the entire body were first performed with a tube voltage of 120 kV and 10 mA. The scan was performed in two sets: the first set included the head and neck; the second set included the arms (down to the proximal half of
the arm), the thorax, the abdomen, and the legs (down to the proximal half of the thigh).
The first set used the following technical parameters: scan type, axial; slice thickness, 1.25 mm; reconstruction interval, 1.25 mm; detector configuration, 8×1.25 mm; beam collima-tion, 10 mm; tube voltage, 120 kV and 200 mA; rotation time, 2 s, with full length and 8 images per rotation; field of view, head scan (25 cm maximum). Reconstructions were created with standard and bone filters.
The second set used the following technical parame-ters: scan type, helical; slice thickness, 1.25 mm; reconstruction interval, 1 mm; detector configuration, 8 × 1.25 mm; beam collimation, 10 mm; tube voltage, 120 kV and 300 mA; rotation time, 0.8 s, with full length and 13.5 mm per rotation; field of view, large scan (50 cm maximum); pitch, 1.35:1. Reconstructions were created with standard bone and lung filters.
Quantification of gas
Two trained, board-certified radiologists semiquantitatively assessed the amount of gas. To promote consistent assess-ments between radiologists, three test cases were examined by both radiologists and results were recorded by a clerk (medical student). During the test cases, the investigators discussed observations to establish concordance. A table was created for
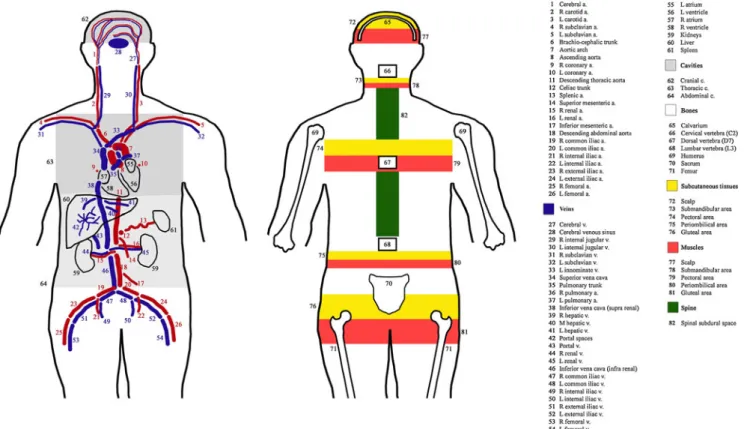
recording observations on 26 selected arteries, 28 selected veins, 4 selected organs (the 4 cavities of the heart were analyzed separately), 7 selected bones, 5 selected areas of subcutaneous tissues, 5 selected areas of muscles, the spinal subdural space, and the 3 body cavities (Fig.1). Each case was interpreted by one of the radiologists and all observa-tions were recorded in the table by the recording clerk.
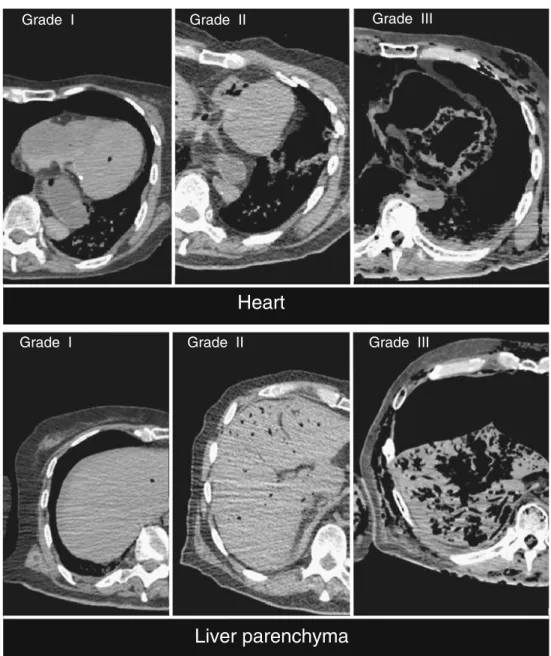
Four different gas grading systems were used, depending on the element of interest. The major vessels, the selected bones, and the spinal subdural space were graded on a scale of I (one to a few gas bubbles), II (partly filled with gas), and III (completely filled with gas). Vessels that could not be identified (N) or that had collapsed (C) were also noted. The cranial cavity was graded on a scale of I (<1 cm gas), II (1–3 cm gas), or III (>3 cm gas). The thoracic and abdominal cavities were graded on a scale of I (1–3 cm gas), II (3–5 cm gas), or III (>5 cm gas). The selected organs (parenchyma), subcutaneous tissues, and muscles were graded on a scale of I (one to a few gas bubbles), II (moderate emphysema), and III (extensive emphysema). For all sites, a grade 0 gas means no gas. Examples of grading are shown in Fig.2.
Data analysis
Sites that could not be identified (N) were assumed to have no gas. Our sample size (n=119) assured that when gas was
absent in a region, there was a 95% chance that the true prevalence was below 3.15%. To describe the putrefaction process in the cadaver, we classified all cases with gas in one or more sites (n=82). We then constructed an animated motion sequence that was illustrated from each case, starting with one that had gas in a single site, and continuing in increasing order to the ones with gas in all studied sites. The prevalence of cases with gas found in each site was measured. We then measured the correlation between the number of sites with gas and the mean grade of the gas. Finally, we studied the distribution of gas between arteries and veins, pairing the 16 sites where both veins and arteries were assessed. For each site, the observed grade of gas in the artery was subtracted from the grade observed in the corresponding vein. Then for each case, a summary measure was computed as the mean value among all 16 sites. Positive values from 0 to III corresponded to the mean
increase of putrefaction in veins compared to arteries. Negative values corresponded to the mean increase of putrefaction in arteries compared to veins.
To identify factors associated with the physiological post-mortem presence of grade III gas in the heart, we used five predefined models, three of which were described in the literature: (1) the extent of putrefaction, (2) the post-mortem interval, (3) the presence of grade II or III gas in the hepatic parenchyma, (4) the presence of periumbilical subcutaneous gas, and (5) the presence of grade III gas in the left ventricle. Sensitivity and specificity were calculated with a 95% CI. Cut-off points for quantitative measures were defined as the last point before sensitivity fell below 100%. The extent of putrefaction and the post-mortem interval were compared for their predictive potential by analyzing the area under the receiver operating curve (AUC). The best model for predicting the presence of
Grade I Grade II Grade III
Grade I Grade II Grade III
Heart
Liver parenchyma
Fig. 2 Example of grades of gas found in the heart and liver parenchyma
physiological post-mortem gas in the heart cavities was selected according to three criteria: (1) the absence of the factor had to be associated with the absence of grade III gas in any heart cavity (100% sensitivity), (2) the presence or absence of the factor had to be technically simple to verify, and (3) the presence of the factor had to be associated with a grade 0, I, or II gas in at least one of the heart cavities (optimal specificity for a specificity of 100%).
Results
Gas was observed in 74 of the 119 cadavers (62.2%; CI 95% 52.8–70.9). The characteristics of the studied cases with and without gas are given in Table1. Of the 119 cases, only 29 had one to a few gas bubbles in all sites (24.4%), 22 showed putrefaction processes in sites partly filled with gas (18.5%), and 23 had at least one site completely filled with gas (19.3%). The Pearson’s correlation coefficients showed that the extent of sites with gas was highly associated with both the grade of putrefaction (0.868; p< 0.0001) and the post-mortem interval (0.719; p<0.0001). However, we noted that, in some cases, gas was absent up to 84 h after death, and in other cases gas was present 5 h after death. Men were more likely to exhibit gas due to putrefaction than women (71.4% vs. 40%; p=0.001), and men had been examined after a longer post-mortem interval than women (mean interval 48 h vs. 25 h). Furthermore, nearly half (48.6%) of the studied women died due to assisted suicide, which is typically associated with a short post-mortem interval before the MDCT is performed.
Details of the distribution of gas due to putrefaction are reported in Fig.3. At an early stage of putrefaction, gas was mainly observed in the heart and liver. Of the 119 studied cases, 55 cases (47.1%) exhibited gas in the heart cavities, and 48 cases (40%) exhibited gas in the liver parenchyma. Therefore, these organs were affected in 13 cases out of 15 with signs of putrefaction. Furthermore, we observed an important correlation (p=0.756; p<0.0001) between the grade of gas in the right heart and that in the liver. In the heart, the gas appeared preferentially in the right cavities (n=53; 44.5%) compared to the left cavities (n=26; 21.8%). Four cases exhibited grade III gas in the right heart with only isolated bubbles in the left. The right heart was the overall earliest site of putrefaction, with an average progression of one grade higher than other sites. Deep abdominal vessels related to the digestive system appeared to be the second most common place for gas to form. In fact, 49 cases (41.2%) exhibited gas in the suprarenal inferior vena cava, hepatic veins, portal space, or portal vein.
However, 25 cases showed signs of putrefaction without any gas in these sites (1 case had gas in 13 other sites). This observation suggested that putrefaction did not necessarily start in the veins that drain the digestive tract. This was also supported by the fact that, out of 35 cases (29.4%) that exhibited gas in vessels connected to the right cavities of the heart (superior vena cava, pulmonary trunk), 6 did not have any gas in the veins that drained the digestive system. We also investigated whether gas appeared in veins before it appeared in arteries. We compared 16 paired arteries and veins in 69 cases that showed signs of
Characteristic Without gas n=45 With gas n=74 Grade III gas in heart n=12 Gender (male) 24 (53.3%) 60 (81.2%) 11 (91.7%) Age (years) 20–39 4 (8.8%) 7 (9.5%) 0 (0%) 40–64 16 (35.6%) 32 (43.2%) 7 (58.3%) 65–101 25 (55.6%) 35 (47.3%) 5 (41.7%) BMI (kg/m2) Underweight (<18.5) 6 (13.3%) 5 (6.8%) 1 (8.3%) Normal (18.5–24.9) 21 (46.7%) 30 (40.5%) 6 (50%) Overweight (25–30) 10 (22.2%) 23 (31.1%) 3 (25%) Obese (>30) 8 (17.8%) 16 (21.6%) 2 (16.7%) Post-mortem interval <24 h 24 (53.3%) 18 (24.3%) 1 (8.3%) 1–3 days 19 (42.2%) 37 (50%) 3 (25%) >3 days 2 (4.4%) 19 (25.7%) 8 (66.7%) Cause of death Assisted suicide 24 (53.3%) 4 (5.4%) 0 (0%) Hanging 5 (11.1%) 16 (21.6%) 0 (0%) Other 16 (35.6%) 54 (73%) 12 (100%) Table 1 Characteristics of the
studied population of cadavers with or without gas detected by MDCT
putrefaction with an assessable grade (data for 7 cases were missing due to unidentified vessels with advanced putre-faction). Veins and arteries were similarly affected by putrefaction. Moreover, veins did not exhibit a higher average grade compared to arteries (Δveins-arteries=0.024, CI 95%−0.03 to 0.08, p=0.406).
Finally, we investigated whether the presence of gas in vessels depended on the position of the cadaver at death. For each case, we measured the average grade of gas in the vessels below the diaphragm (33 veins and arteries) compared to that of the vessels above the diaphragm (21 veins and arteries). Cadavers with signs of putrefaction that had been in a standing position at death (n=16) had slightly more gas in the lower half of the body [Δinf-sup=0.11; Standard Deviation (SD =0.21)] compared to those that had been horizontal at death (n=39; Δinf-sup=0.003; SD= 0.40). This difference was not significant (p=0.302), but it was confounded by the post-mortem interval.
The presence of gas in deeper tissues and organs could not be assessed based on subcutaneous gas, as was proposed previously [23]. Over half of the cases that showed signs of putrefaction did not have any subcutane-ous gas. This suggested that gas only appeared under the skin at later stages. Moreover, one case that had gas in 55 different sites did not have any subcutaneous gas.
Our results showed that the appearance of gas in the right heart followed the same profile as the appearance of
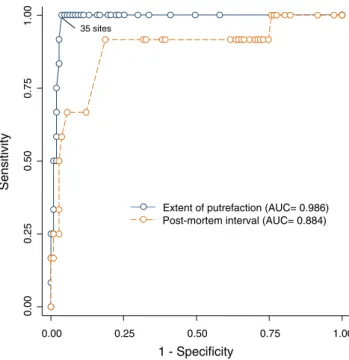
gas in the rest of the body (Fig. 4); thus, it was probably influenced by the same phenomena. However, grade III gas in the right heart appeared much later in the putrefaction process, and only occurred in cadavers with gas in more than 35 sites. Therefore, the presence of substantial quantities of gas in the right heart due to putrefaction could be predicted by the extent of putrefaction in the entire body. Compared to the post-mortem interval, the number of sites with gas revealed a clear cut-off point between those with and those without grade III gas in the right heart (Fig.5). Furthermore, the area under the curve showed that grade III gas in the right heart was more highly associated with the number of sites (AUC =0.986) than with the post-mortem interval (AUC =0.884). However, this study lacked suffi-cient power to determine whether this difference was significant (p=0.091). Nevertheless, the “above 35 affected sites” factor showed a sensitivity of 100% (CI 95% 69.9–100) and a specificity of 96.3% (90.1–98.8). Unfortunately, this method was not practical because it required investigating all 82 sites. Our results (Table2) showed that investigating the presence of grade II or III gas in the hepatic parenchyma was a good alternative for assessing the presence of grade III gas in the heart, with only a slight loss of specificity (89.7%). Compared to the post-mortem interval, the presence of gas in periumbilical subcutaneous tissues and the presence of grade III gas in the left ventricle, the hepatic parenchyma rule was the only method with a sufficiently high sensitivity to be used for ruling out gas due to putrefaction in the right heart.
Discussion
This study successfully established that post-mortem gas forms in a consistent distribution pattern. Knowledge of this pattern enables the interpretation of gas detected on the MDCT, particularly in distinguishing between a vital air embolism and post-mortem gas. At an early stage of putrefaction, gas was primarily observed in the deep organs, including the heart and liver. Furthermore, we found an important correlation between the grade of gas in the right heart and that in the liver. Gas in the heart appeared preferentially in the right cavities compared to the left cavities and followed the same pattern of appearance as that in the rest of the cadaver. However, gas appeared in the heart cavities before it appeared in the parenchyma; thus, it could be confused with an air embolism in the early stages of putrefaction. Deep abdominal vessels related to the digestive system were the second most likely site to contain gas due to putrefaction. Veins and arteries were similarly affected by putrefaction; either for the gas quantity or its location. The presence of gas in deeper tissues and organs was not related to the presence of subcutaneous gas, as
proposed previously [23], because gas only appeared in the latter sites in the later stages of putrefaction.
The appearance of gas during the putrefaction process is established [24]. After death, autolytic processes lead to a breakdown of local nonspecific and specific defense mechanisms that guard against the penetration of micro-organisms into the skin and mucosa. This leads to a change in the biotope: autolytic tissue is an ideal substrate for bacteria, the pH value changes, and the temperature declines. Additionally, metabolites are not removed, and cellular and immunologic defenses have ceased. All these elements promote the change from intravital macroflora into putrefaction flora. This specific bacterial flora leads to a substantial production of gas, known as putrefaction gas. However, this process does not explain why gas first appears in regions with no early autolysis, like the vascular system (e.g., the jugular vein is typically the first site). A possible explanation might be that gas bubbles may appear after death from dissolved gas that comes out of solution and reforms into gas in spaces with high compliance, like the right heart and large veins. This is also consistent with gas first appearing in the heart because the heart is filled with blood, and thus, contains large concentrations of dissolved gas.
It was not surprising that the appearance of post-mortem gas did not correspond to the post-mortem interval. Indeed, post-mortem changes are not solely time dependent, but depend on multiple factors, including temperature, aeration, surface underneath the cadaver, clothing, etc. Additionally, intrinsic factors can influence the appearance of post-mortem changes, including the duration of agony, glycemic
levels, blood loss, cachexia, adiposity, hypothermia, infec-tious disease, or fever [24].
The majority of the cases investigated in this study exhibited a first appearance of gas in the hepatic area, in the heart, or in both places. The fact that some cases did not follow the most common distribution pattern makes the
0.00 0.25 0.50 0.75 1.00 Sensitivity 0.00 0.25 0.50 0.75 1.00 1 - Specificity
Post-mortem interval (AUC= 0.884) Extent of putrefaction (AUC= 0.986)
35 sites
Fig. 5 Receiver operating curves compare the detection of grade III gas in the heart based on either the post-mortem interval or the number of sites with gas. AUC = Area under the curve. Dots represent corresponding values for specificity and sensitivity at increasing cut-off points ranging from 0 to 82 sites and from 3 to 216 h
0% 10% 20% 30% 40% 50% 60% 70% 80% 90% 100% 1 3 5 7 9 11 13 15 17 19 21 23 25 27 29 31 33 35 37 39 41 43 45 47 49 51 53 55 57 59 61 63 65 67 69 71 73 75 77 79 81 82 0
Gas in any location
Grade III gas in the heart Gas in the heart
Cumulative prevalence of cases with gas
Number of sites with gas
Fig. 4 Cumulative frequency of cases with gas in a given number of affected sites. This figure shows that gas in the heart appeared simultaneously with gas in other sites, but grade III gas only appeared in the later stages of putrefaction
distinction between vital and post-mortem gas less certain. We attempted to establish a rule that would ensure the correct interpretation. The rule is based on the presence of gas in the cardiac cavities relative to its presence elsewhere in the body. The first diagnostic rule (Fig. 6) states that, when grade III gas was found in the heart, but less than 35 other sites contained gas, the gas in the heart was not due to putrefaction. However, because the analysis of gas in 82 sites is not readily applicable in routine forensic pathology, we simplified this rule to a second observation. That is,
when grade III gas was found in the heart, but the hepatic parenchyma did not exhibit moderate emphysema (grade II), the gas in the heart was not due to putrefaction. Our observations led us to reason that the presence of large quantities of gas in the heart cavities (grade III) without gas grade II in the hepatic parenchyma indicated that this gas must have formed from a process different than putre-faction. We therefore, propose the following procedure: When grade III gas is present in the heart, the presence of gas in the hepatic parenchyma must be investigated.
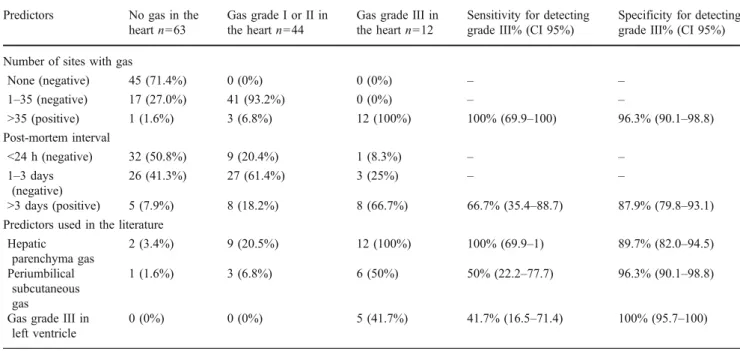
Table 2 Predictors of gas in the heart Predictors No gas in the
heart n=63
Gas grade I or II in the heart n=44
Gas grade III in the heart n=12
Sensitivity for detecting grade III% (CI 95%)
Specificity for detecting grade III% (CI 95%) Number of sites with gas
None (negative) 45 (71.4%) 0 (0%) 0 (0%) – – 1–35 (negative) 17 (27.0%) 41 (93.2%) 0 (0%) – – >35 (positive) 1 (1.6%) 3 (6.8%) 12 (100%) 100% (69.9–100) 96.3% (90.1–98.8) Post-mortem interval <24 h (negative) 32 (50.8%) 9 (20.4%) 1 (8.3%) – – 1–3 days (negative) 26 (41.3%) 27 (61.4%) 3 (25%) – – >3 days (positive) 5 (7.9%) 8 (18.2%) 8 (66.7%) 66.7% (35.4–88.7) 87.9% (79.8–93.1) Predictors used in the literature
Hepatic parenchyma gas 2 (3.4%) 9 (20.5%) 12 (100%) 100% (69.9–1) 89.7% (82.0–94.5) Periumbilical subcutaneous gas 1 (1.6%) 3 (6.8%) 6 (50%) 50% (22.2–77.7) 96.3% (90.1–98.8)
Gas grade III in left ventricle
0 (0%) 0 (0%) 5 (41.7%) 41.7% (16.5–71.4) 100% (95.7–100)
CI confidence interval
Investigate hepatic parenchyma
Gas in the right heart
(grade III)
Grade II or III gas (aggregated bubbles) Inconclusive Gas due to putrefaction Embolism hidden by putrefaction No gas or grade I
(no or isolated bubbles)
Suspected vital air embolism
Confirmed by aspirometer and gas chromatography Fig. 6 The diagnostic
procedure that permits the distinction between post-mortem gas and vital air embolism
When there is no gas in the hepatic parenchyma, the gas must have originated from a process other than putrefac-tion (Fig. 6).
Nevertheless, in some cases, gas may be present in the heart in small quantities before any other sites are affected. Thus, it is important to exercise caution in interpreting cases with gas that did not first appear in the liver; the diagnosis of vital air embolism should not rest solely on this finding, because there are other processes that might emit gas in the heart soon after death. In other studies, we noted some speculation concerning the causes that might lead to the presence of gas on a nontraumatic post-mortem MDCT. The primary causes included cardiopulmonary resuscitation (venous catheterization, gas coming out of solution in the blood, or pulmonary parenchymal injury) [16], hanging (pulmonary trauma caused by strong attempts at breathing, which facilitates alveolar wall ruptures) [23], and anaerobic heart metabo-lism (supravital glycolysis) [23]. These speculations do not compromise the rule we have proposed here, because those causes of gas production do not lead to grade II or III gas.
Air embolism is a rare cause of death that is very important to identify. Therefore, our rule must have high specificity in order to distinguish correctly between gas due to putrefaction or air embolism. High sensitivity is also required in order to prevent a false diagnosis of air embolism. The main advantage of the rule of the hepatic parenchyma is that it would be easy to apply routinely by forensic pathologists. The advantage of using the MDCT for an air embolism diagnosis is that the presence of air embolism can be determined before performing the autopsy and in cases that do not permit an autopsy in clinical pathology practice. In addition, a gas analysis could be performed in a MDCT-guided puncture in order to confirm the diagnosis with minimal invasiveness.
Our study is based on a standardized protocol for detecting the presence of gas at multiple sites in a cadaver. All the cases fulfilled the inclusion criteria of the study, and the sample size was sufficiently large to have a clear overview of the results. One major limitation is the difficulty in generalizing to all autopsy cases our rule for determining whether gas in the right heart was due to putrefaction. For example, putrefaction might occur in a different pattern in the presence of open wounds. Further studies are needed to understand the phenomena underlying putrefaction. In future studies, sequential imaging on cadavers at different intervals after death could reveal mechanisms of interindividual differ-ences. Moreover, a case–control diagnostic study with cases that died from vital air embolism could validate our rule.
Conclusion
This study was the first to investigate the appearance of post-mortem gas in detail. First, this study showed that the appearance of post-mortem gas follows a pattern of distribution according to clear biological processes that primarily begin in the hepatic area and the heart; the presence of gas in the heart in large quantities occurs when the vessels and the organs also contain a large amount of gas. Second, due to an association between the amount of gas present in the heart and that present in the hepatic parenchyma, it may be possible to identify post-mortem gas from a vital air embolism. The rule is applicable indepen-dent of external conditions that are known to influence the putrefaction process.
Acknowledgments The authors would like to thank Professor Richard Dirnhofer for his experienced assistance.
References
1. O’Donnell C, Woodford N (2008) Post-mortem radiology–a new sub-speciality? Clin Radiol 63(11):1189–1194
2. O’Donnell C, Rotman A, Collett S, Woodford N (2007) Current status of routine post-mortem CT in Melbourne, Australia. Forensic Sci Med Pathol 3(3):226–232
3. Losasso TJ, Muzzi DA, Dietz NM, Cucchiara RF (1992) Fifty percent nitrous oxide does not increase the risk of venous air embolism in neurosurgical patients operated upon in the sitting position. Anesthesiology 77(1):21–30
4. Papadopoulos G, Kuhly P, Brock M, Rudolph KH, Link J, Eyrich K (1994) Venous and paradoxical air embolism in the sitting position. a prospective study with transoesophageal echocardiog-raphy. Acta Neurochir 126(2–4):140–143
5. Palmon S, Moore L, Lundberg J, Toung T (1997) Venous air embolism: a review. J Clin Anesth 9(3):252–257
6. Muth C, Shank E (2000) Gas embolism. N Engl J Med 342 (7):476–482
7. Tan B, Saunier C, Cotton F, Gueugniaud P, Piriou V (2008) Thoracoabdominal CT scan: a useful tool for the diagnosis of air embolism during an endoscopic retrograde cholangiopancreatog-raphy. Ann Fr Anesth Rèanim 27(3):240–243
8. Helmberger TK, Roth U, Empen K (2002) Massive air embolism during interventional laser therapy of the liver: successful resuscitation without chest compression. Cardiovasc Interv Radiol 25(4):335–336
9. Grabherr S, Lesta MDM, Rizzo E, Mangin P, Bollmann M (2008) Forensic imaging. Rev Méd Suisse 4(164):1609–1614
10. Bolliger SA, Thali MJ, Ross S, Buck U, Naether S, Vock P (2008) Virtual autopsy using imaging: bridging radiologic and forensic sciences. a review of the Virtopsy and similar projects. Eur Radiol 18(2):273–282
11. Paperno S, Riepert T, Krug B, Rothschild MA, Schultes A, Staak M, Lackner L (2005) Value of postmortem computed tomography in comparison to autopsy. Rofo 177(1):130–136
12. Payne-James J (2003) Forensic medicine: clinical and patholog-ical aspects. Greenwich Medpatholog-ical Media, San Francisco
13. Aghayev E, Yen K, Sonnenschein M, Jackowski C, Thali M, Vock P, Dirnhofer R (2005) Pneumomediastinum and soft tissue
emphysema of the neck in postmortem CT and MRI; a new vital sign in hanging? Forensic Sci Int 153(2–3):181–188
14. Dirnhofer R, Jackowski C, Vock P, Potter K, Thali MJ (2006) VIRTOPSY: minimally invasive, imaging-guided virtual autopsy. Radiographics 26(5):1305–1333
15. Thali MJ, Jackowski C, Oesterhelweg L, Ross SG, Dirnhofer R (2007) VIRTOPSY–the Swiss virtual autopsy approach. Leg Med (Tokyo) 9(2):100–104
16. Jackowski C, Thali M, Sonnenschein M, Aghayev E, Yen K, Dirnhofer R, Vock P (2004) Visualization and quantification of air embolism structure by processing postmortem MSCT data. J Forensic Sci 49(6):1339–1342
17. Shiotani S, Kohno M, Ohashi N, Atake S, Yamazaki K, Nakayama H (2005) Cardiovascular gas on non-traumatic postmortem computed tomography (PMCT): the influence of cardiopulmonary resuscitation. Radiat Med 23(4):225–229
18. Kauczor HU, Riepert T, Wolcke B, Lasczkowski G, Mildenberger P (1995) Fatal venous air embolism: proof and volumetry by helical CT. Eur Radiol 21:155–157
19. Frey S (1929) Luftembolie. Ergeb Chir 22:95–161
20. Bajanowski B, West A, Brinkmann B (1998) Proof of fatal air embolism. Int J Leg Med 111(4):208–211
21. Mercier L (1837) Observation sur l'introduction de l'air dans les veines et sur la manière dont il produit la mort. Gaz Med 5:481– 487
22. Dyrenfurth F (1924) Zur Technik der Feststellung des Todes an Luftembolie. Dtsch Z Gerichtl Med 3:145–146
23. Jackowski C, Sonnenschein M, Thali MJ, Aghayev E, Yen K, Dirnhofer R, Vock P (2007) Intrahepatic gas at postmortem computed tomography: forensic experience as a potential guide for in vivo trauma imaging. J Trauma 62(4):979–988