Publisher’s version / Version de l'éditeur:
Vous avez des questions? Nous pouvons vous aider. Pour communiquer directement avec un auteur, consultez la première page de la revue dans laquelle son article a été publié afin de trouver ses coordonnées. Si vous n’arrivez pas à les repérer, communiquez avec nous à PublicationsArchive-ArchivesPublications@nrc-cnrc.gc.ca.
Questions? Contact the NRC Publications Archive team at
PublicationsArchive-ArchivesPublications@nrc-cnrc.gc.ca. If you wish to email the authors directly, please see the first page of the publication for their contact information.
https://publications-cnrc.canada.ca/fra/droits
L’accès à ce site Web et l’utilisation de son contenu sont assujettis aux conditions présentées dans le site
LISEZ CES CONDITIONS ATTENTIVEMENT AVANT D’UTILISER CE SITE WEB.
Internal Report (National Research Council of Canada. Institute for Research in Construction), 1991-12
READ THESE TERMS AND CONDITIONS CAREFULLY BEFORE USING THIS WEBSITE. https://nrc-publications.canada.ca/eng/copyright
NRC Publications Archive Record / Notice des Archives des publications du CNRC :
https://nrc-publications.canada.ca/eng/view/object/?id=6ac35fa8-c36d-4adb-9aee-d5c4d2a6f5d1 https://publications-cnrc.canada.ca/fra/voir/objet/?id=6ac35fa8-c36d-4adb-9aee-d5c4d2a6f5d1
NRC Publications Archive
Archives des publications du CNRC
For the publisher’s version, please access the DOI link below./ Pour consulter la version de l’éditeur, utilisez le lien DOI ci-dessous.
https://doi.org/10.4224/20374623
Access and use of this website and the material on it are subject to the Terms and Conditions set forth at
Fire resistance tests of exterior sheet steel walls with 152 mm thick, 96 kg/m3 density, mineral wool insulation
Internal Report No. 618
FIRE RESISTANCE TESTS OF EXTERIOR SHEET STEEL WALLS INSULATED WITH 152 mm THICK, 96 kgIm3 DENSITY, MINERAL
WOOL INSULATION
ABSTRACT
M. Chabot
Two fire resistance tests on non-loadbearing exterior sheet steel wall assemblies, conducted in accordance with test method CAN4-S101-M89, are described. The
assemblies were sandwich-type sheet steel wall panels with a 152 mm thick, 96 kg/m3 density, mineral wool insulating core. Two different sub-girt spacings were successively examined, namely 1525 mm and 2440 mm, and thefire resistance ratings achieved were 60 and 45 min respectively. The fire resistance ratings of the assemblies were governed by the unexposed surface temperature rise limitation of CAN4-S101-M89.
The equivalent opening factor (FEo) values of the wall assemblies, calculated for 1-and 2-hour fire resistance ratings, are also given. The FEO factor, as defined in the National Building Code of Canada, permits acceptance of exterior wall assemblies where they fail to provide the required fire resistance rating due to excessive temperature rise on their unexposed surface. The validity of this special provision for exterior walls is discussed.
Finally, a comparison between two different techniques for measuring the unexposed surface temperature of f i e resistance test specimens is also presented. It is shown that the present technique in CAN4-S101-M89 tends to overestimate the unexposed surface temperature.
INTRODUCTION
Insulated sheet steel walls are commonly used on the exterior of commercial and industrial steel-framed buildings. In many cases, the National Building Code of Canada (NBCC) [I] requires that the exterior walls of such buildings have a fire resistance rating of 45 min, 1 or 2 hours. Under a joint project between the Canadian Steel Construction Council and the National Research Council of Canada, a number of f i e tests have been conducted over the past few years with the aim of producing an economical fire-rated sheel steel wall assembly [2,3].
This report describes the results of two fire resistance tests conducted in June and September 1991 on sheet steel wall assemblies insulated with 152 mm thick mineral wool insulation of 96 kg/m3 density. The tests were performed in accordance with CAN4-S101- M89 [4] for a period of two hours for the purpose of assessing thefire resistance rating of the wall assemblies and evaluating the equivalent opening factor (FEo) values for fie- exposure periods greater than the fire resistance ratings of the assemblies. The equivalent opening factor provision in the NBCC permits acceptance of exterior walls which do not provide the required fire resistance rating based on failure by the unexposed surface temperature rise criterion, but which remained in place for the duration required by the NBCC.
This report also presents a comparison between two different techniques for
I
measuring the temperature on the unexposed surface of fire test specimens.Because of its importance for exterior sheet steel walls, the equivalent opening factor provision in the NBCC has been examined, as part of this project, raising some concerns regarding i k validity. These concerns or comments are discussed at the end of the report.
DESCRIPTION OF TEST SPECIMENS
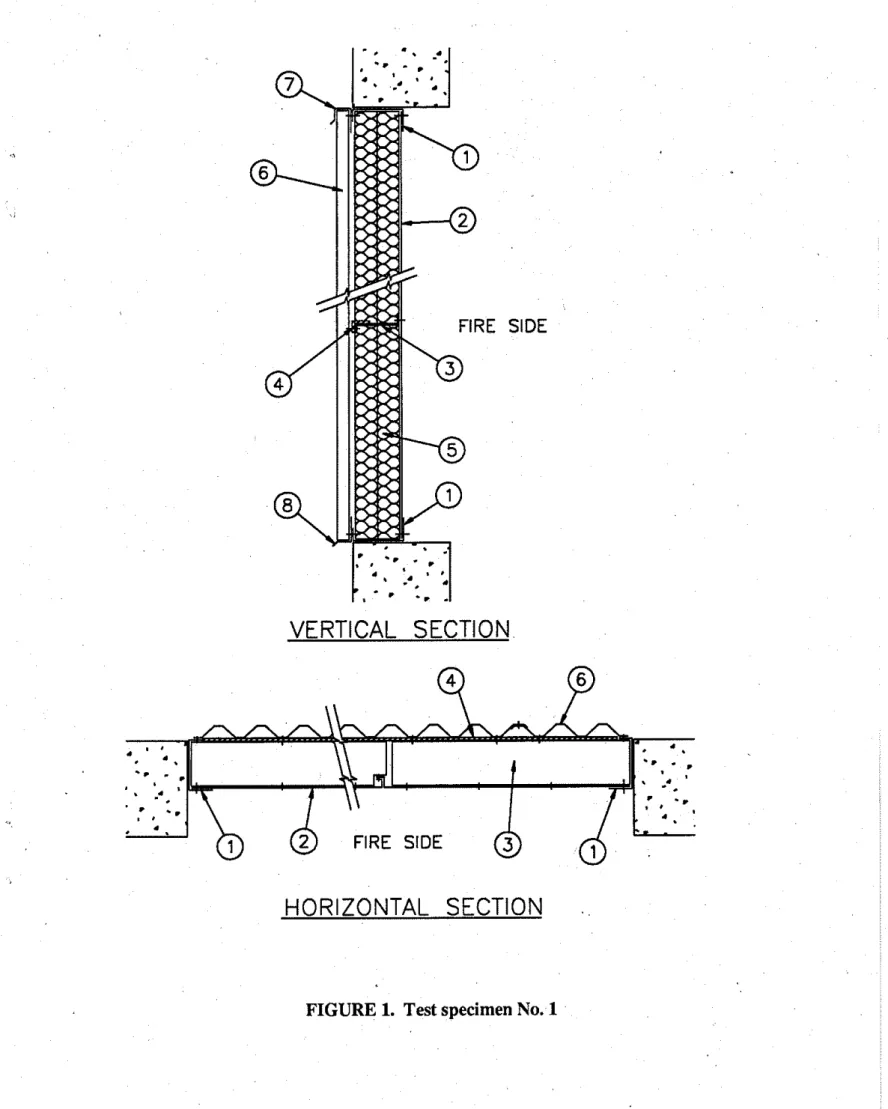
The specimens were sandwich-type wall panels, 3660 mm (12 ft) high by 3050 mm wide (10 ft), consisting of two sheets of galvanized steel encasing 152 mm (6 in.) of mineral wool batt insulation. The panels were supported by horizontal 2-bar sub-girts placed between the two sheets. In Test No. 1, the sub-girts were spaced
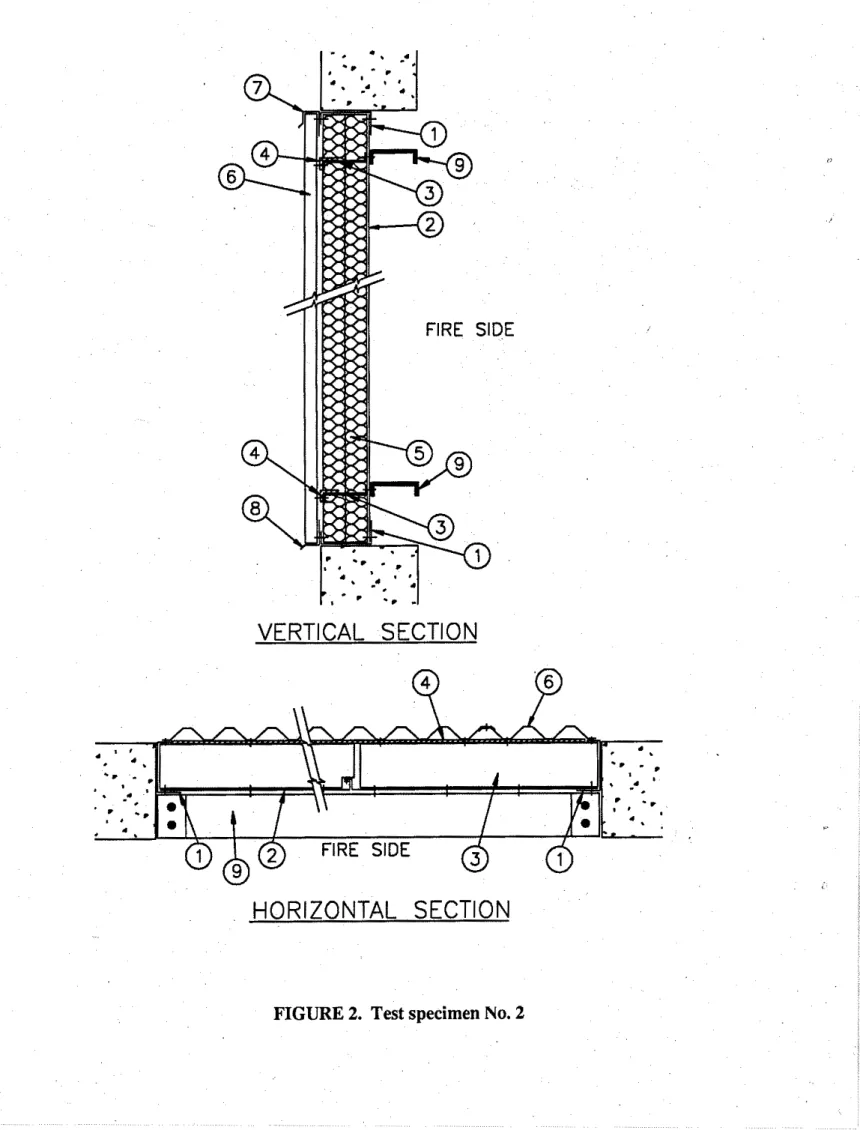
1525 mm (5 ft) OC. In Test No. 2, the sub-girt spacing was increased to 2440 mm (8 ft). As these wall assemblies are non loadbearing, they were built in a concrete frame so as to be restrained on all four edges. A detailed description of the specimens is given below, with item numbers referring to those in Figures 1 and 2. Product and supplier names are given between brackets
"[I",
where appropriate.1. Flashing channels [VicWest Steel]: 152 mm (6 in.) wide channels with 45 mm (1.75 in.) and 76 mm (3 in.) flanges, fabricated from 1.52 mm thick (16 Ga)
galvanized sheet steel. Fastened to concrete frame with 6.4 mm x 45 mm (0.25 in. x 1.75 in.) concrete anchors spaced 406 mm (16 in.) OC.
2. Steel liner sheets [L800
-
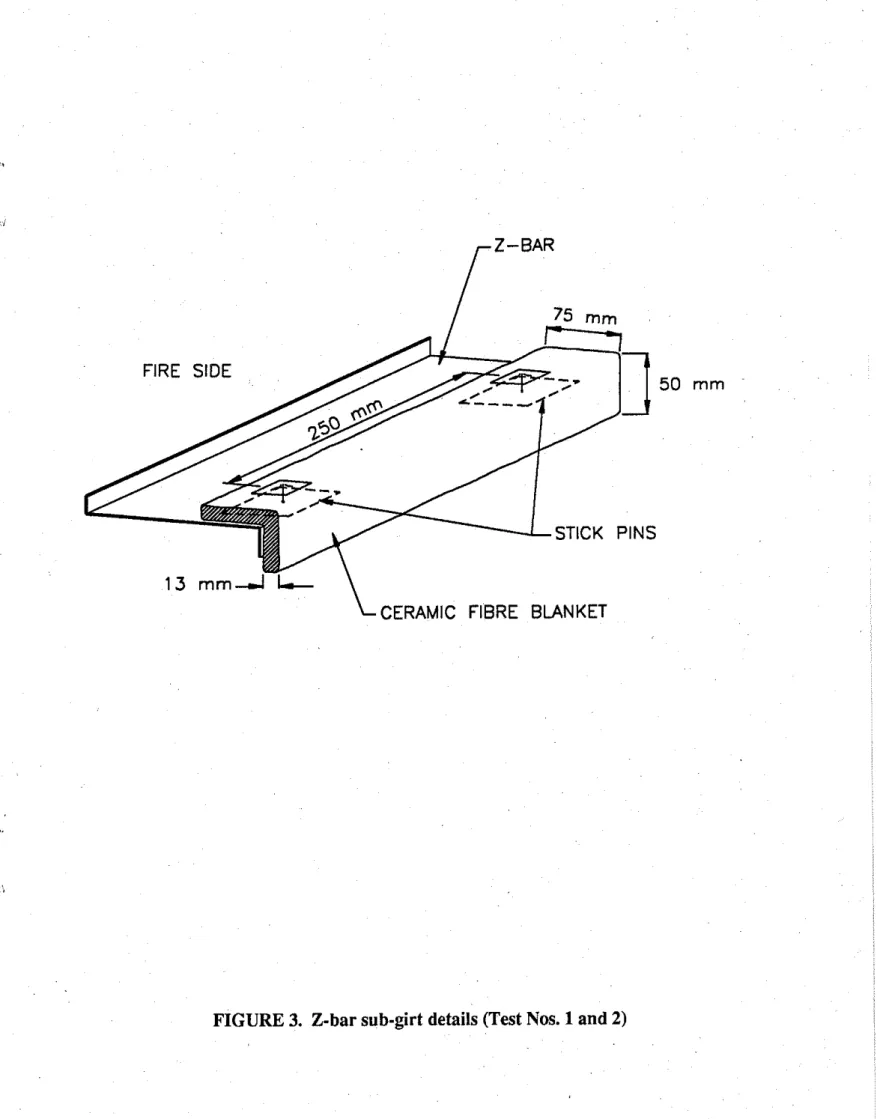
VicWest Steel]: 800 mm (31.5 in.) wide panels, fabricated from 0.61 mm thick (24 Ga) galvanized sheet steel. Fastened to flashing channels with sheet metal screws spaced 305 mm (12 in.) OC. Side lap joints (consisting of an interlocking lip and groove) sealed with factory-applied butyl caulking and secured with sheet metal screws spaced 305 mm (12 in,) OC. Butyl tape was applied between the liner sheets and the flashing channels to seal the perimeter of the specimen.3. Z-bar sub-girt [VicWest Steel]: 152 mm (6 in.) wide x 800 mm (31.5 in.) long notched Z-bars with 25 mm (1 in.) and 38 mm (1.5 in.) flanges, fabricated from
1.22 mm thick (18 Ga) galvanized sheet steel. Fastened to the liner sheets with sheet metal screws spaced not more than 250 mm (10 in.) OC.
Test No.
I:
One sub-girt at mid-height.Test No. 2: Two sub-girts, spaced 305 mm (12 in.) from top and bottom of specimen.
4. Ceramic fibre blanket [Fiberfray Durablarzket
-
Carborundum Carzada]:128 kg/m3 (8 lb/ft3) density, 13 mm (0.5 in.) thick, 125 mm (5 in.) wide, attached to the Z-bar sub-girts with stick pins spaced 250 mm (10 in.) OC (see Figure 3). 5. Mineral wool batts [Thermajiber - Canadian Gypsum Company]: 96 kgIm3
(6 lblft3) density, supplied in 76 mm (3 in.) thick sheets, 610 mm x 1220 mm
T
Batts held in place by friction only.Batts attached to liner sheets with stick pins spaced 305 mm (12 in.) OC horizontally and 610 mm (24 in.) OC vertically.
6. Exterior cladding [CU40
-
VicWest Steel]: Painted, corrugated sheet steel panels, 935 mm (36.8 in.) wide, 0.46 mm thick (26 Ga), with 40 mm (1.57 in.) deep ribs 134 mm (5.27 in.) OC. Fastened to flashing channels with sheet metal screws spaced 406 mm (16 in.) and to Zbar sub-girts with sheet metal screws every second rib. Lap joints of adjacent panels fastened with sheet metal screws spaced 406 mm (16 in.) OC.7. Cap flashing [VicWest Steel]: 0.46 mm thick (26 Ga), 3660 mm (12 ft) long, used to trim top of exterior cladding. Fastened to the top flashing channel and exterior cladding with sheet metal screws.
8. Drip flashing [VicWest Steel]: 0.46 mm thick (26 Ga), 3660 mm (12 ft) long, used to trim base of exterior cladding. Fastened to bottom flashing channels with sheet metal screws.
9. Structural girt: C150x16 steel channel, attached to 100 mm x 100 mm x 10 mm (3.94 in. x 3.94 in. x 0.394 in.) angles at both ends with two 19 mm x 38 mm
(0.75 in. x 1.5 in.) steel bolts. Angles attached to concrete frame with two 9.5 mm x 50 mm (0.375 in. x 2 in.) and two 8 mm x 38 mm (0.313 in. x 1.5 in.) sleeve anchors.
Test No. 1: No structural girt.
Test No. 2: One structural girt opposite each sub-girt, i.e., 305 mm (12 in.) from top and bottom of specimen.
The sheet metals screws were #14 screws, 19 mm (0.75 in.) long. Before the test, the edges of the exposed face of the specimens were sealed with ceramic fibre blankets. TEST PROCEDURE AND INSTRUMENTATION
The specimens were subjected to a rue endurance test in accordance with the standard test method CAN4-S101-M89 r41 for a ~ e r i o d of two hours. The tests were performed in the propane gas-fired wall iumace df the National Fire Laboratory of
the
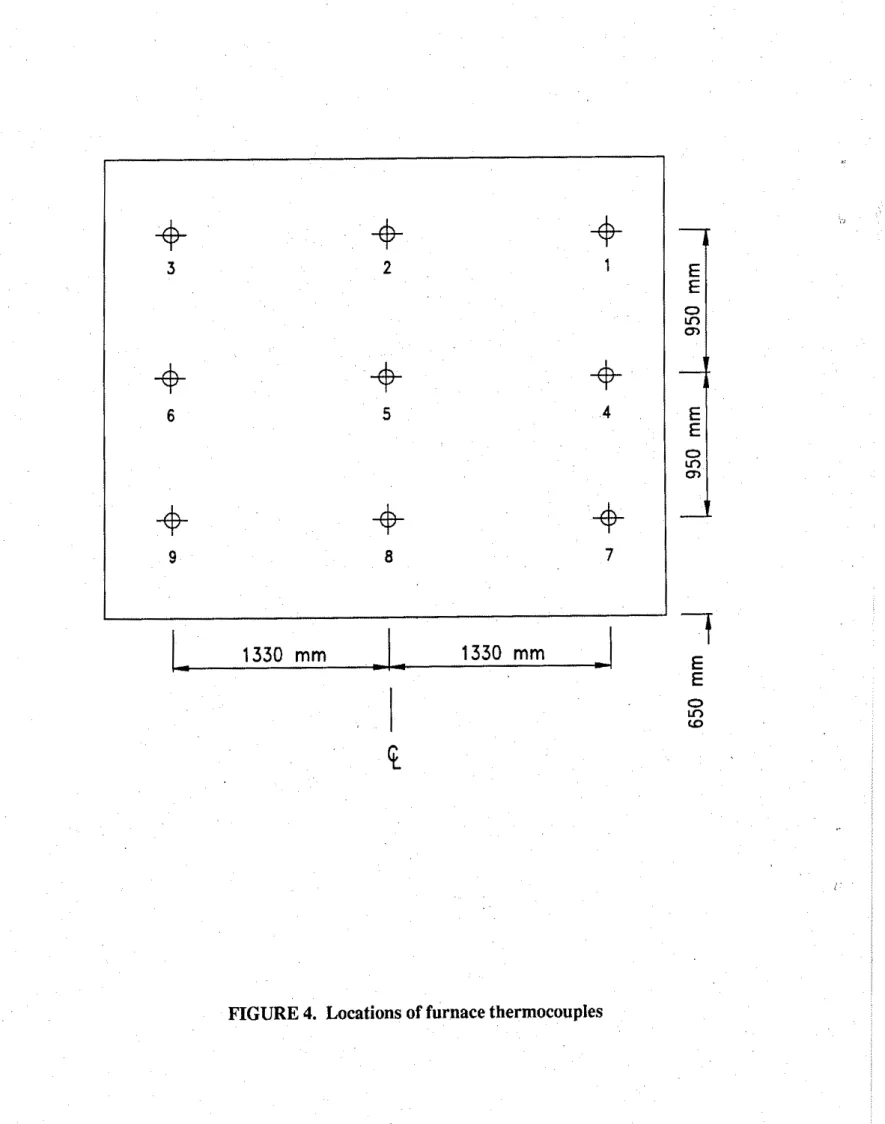
Institute for Rescarch in Construction. The specimens were exposed to fire on the liner side.The temperature in the furnace was measured by nine symmetrically distributed thermocouples as shown in Figure 4. The average temperature in the furnace was controlled so as to follow the standard time-temperature curve in CAN4-S101-M89.
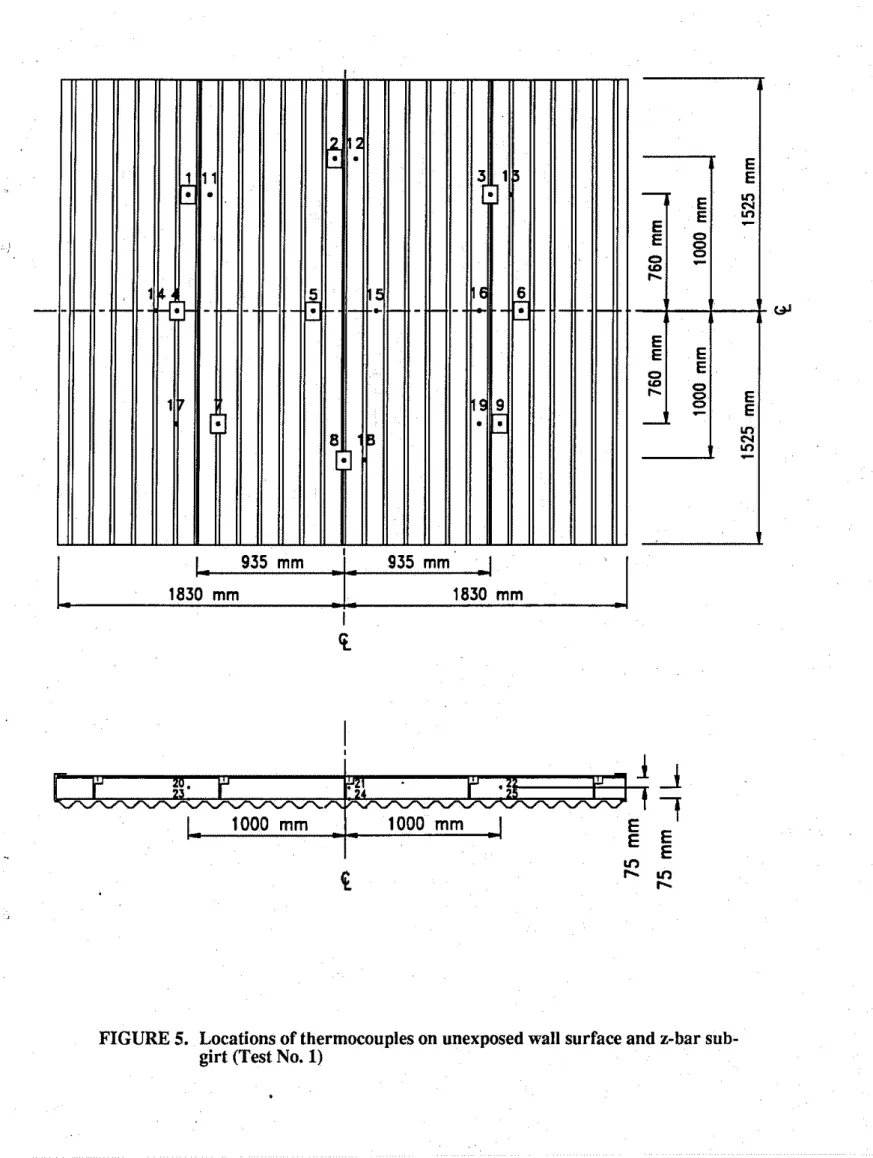
The temperature of the unexposed wall surface was measured by 18 thermocouples in Test No. 1 and 22 thermocouples in Test No. 2, as shown in Figures 5 and 6
respectively. In each test, the thermocouples were installed in pairs. One thermocouple in each pair was placed under standard 10 mm thick refractory fibre pads, as required by CAN4-S101-M89, while the other was simply fastened to the sheet steel surface with a short screw. The objective was to determine the influence of the thermocouple pads on surface temperature measurements. The thermocouples covered with pads (which are
indicated by square boxes in Figures 5 and 6) were used for assessing the fire resistance ratings and evaluating the equivalent opening factor values.
As illustrated in Figures 5 and 6, a number of thermocouples were also placed on the 2-bar sub-girts inside the specimens.
The lateral deflection of the specimen was measured in both tests with deflection gauges installed on the unexposed side of the specimen, opposite each sub-girt.
The intensity of radiation from the unexposed surface of the specimens was measured at three different heights during the tests using heat flux meters located 1.2 m from the unexposed surface. 6 n e heat flGx meter was piaced at mid-height and the other two were placed 760 mm above and below mid-height.
During the two-hour fire tests, the temperature, lateral deflection and radiation readings were taken at 2 min intervals.
CAN-S101-M89 normally requires that the specimens be subjected to a hose stream test immediately following the fue test. In the present case, however, the hose stream tests were not conducted to allow inspection of the mineral wool insulation after the fire test. It was believed that the hose stream could possibly have caused some sagging of the insulation. Previous tests on similar sheet steel wall assemblies showed that the specimens withstood the hose stream test without the passage of the hose stream [2,3].
RESULTS AND DISCUSSION Observations
Test No. 1
- Two min after the test was started, flames appeared at the liner joints, accompanied by light white smoke issuing from the top of the wall on the unexposed side, indicating combustion of the liner joint caulking. At 5 min, the butyl tape at the perimeter of the specimen started to bum. Flaming at the liner joints and perimeter of the specimen stopped by 10 and 20 min respectively. As the test progressed, the white smoke, which appeared like steam, reduced in density and continued to issue from the top of the wall for the duration of the test. This steam likely resulted from evaporation of the binder in the mineral wool batts.
- The liner sheets underwent significant deformation during the first 30 min, including warping and partial joint opening.
- The appearance of the unexposed surface did not change throughout the test, except that the paint turned brown around the screws opposite the Z-bar sub-girt and in a small area near the top of the specimen.
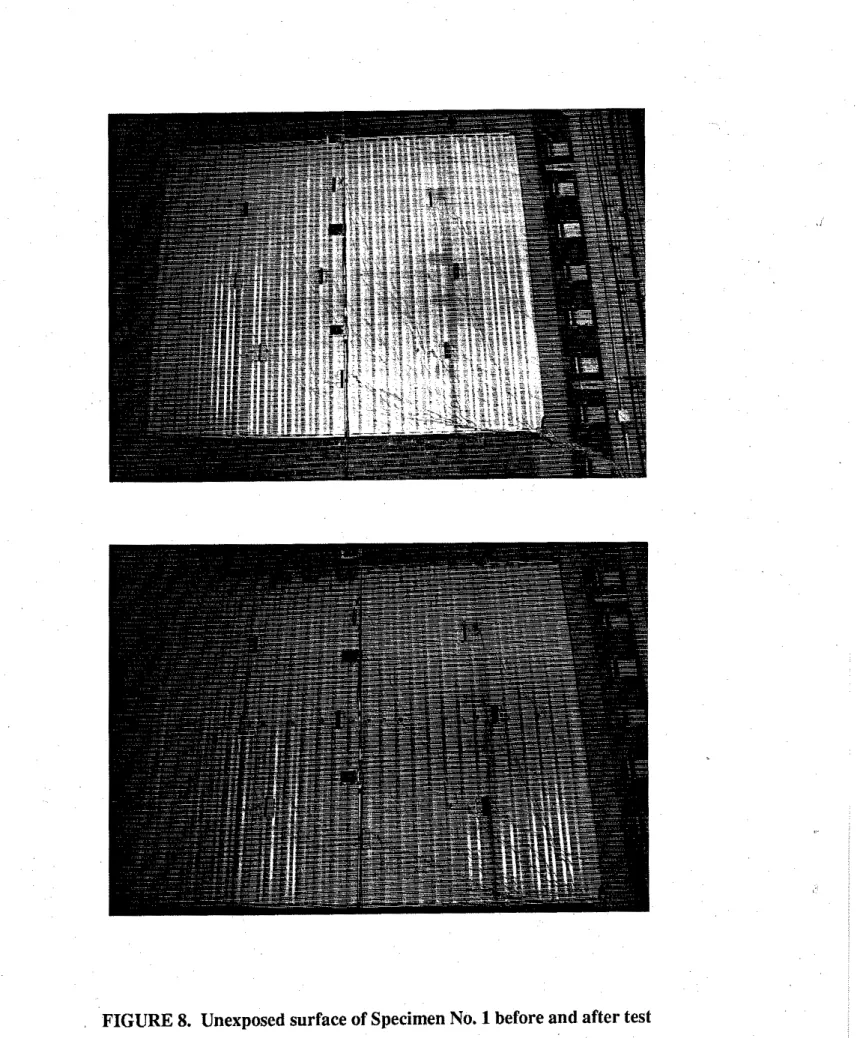
- The specimen withstood the two-hour fire resistance test without passage of flames or hot gases. Figures 7 and 8 show both faces of the specimen before and after the test.
-
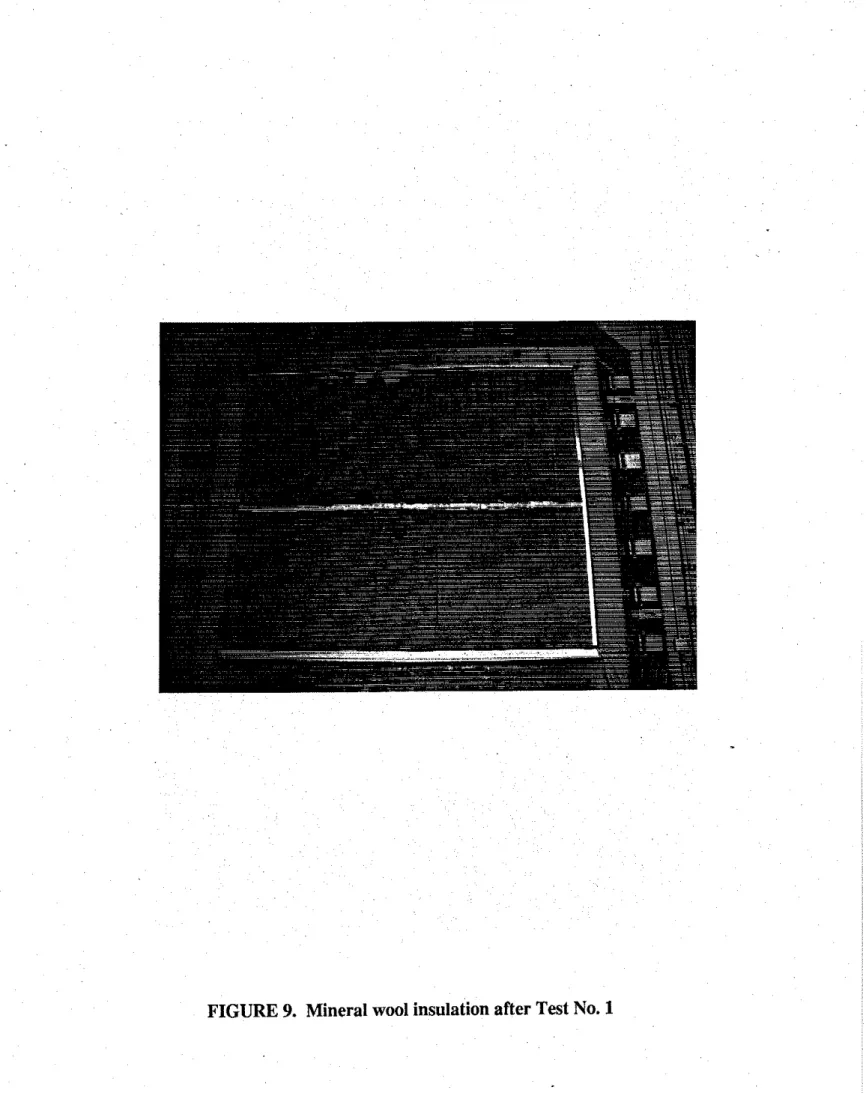
After the test was terminated and the wall cooled, the exterior cladding was removed to inspect the mineral wool batts (Figure 9). There was no deterioration of the mineral wool and ceramic fibre blanket near the unexposed surface. Theinner mineral wool batts were completely charred and had started to sag and shrink away from the Z-bar sub-girt. The outer batts were charred approximately 20 mm to 25 mm deep but did not show any sagging.
Test No. 2:
The specimen in Test No. 2 behaved essentially the same as the spechen in Test No. 1, with the following differences:
-
The liner sheets underwent larger deformation than observed in Test No. 1.- The structural girts buckled and warped during the test but remained fastened to the Z-bar sub-guts.
- The paint charred on the unexposed surface opposite the top 2-bar sub-girt, all across the width of the specimen. Figures 10 and 11 show the specimen before and after the fire test.
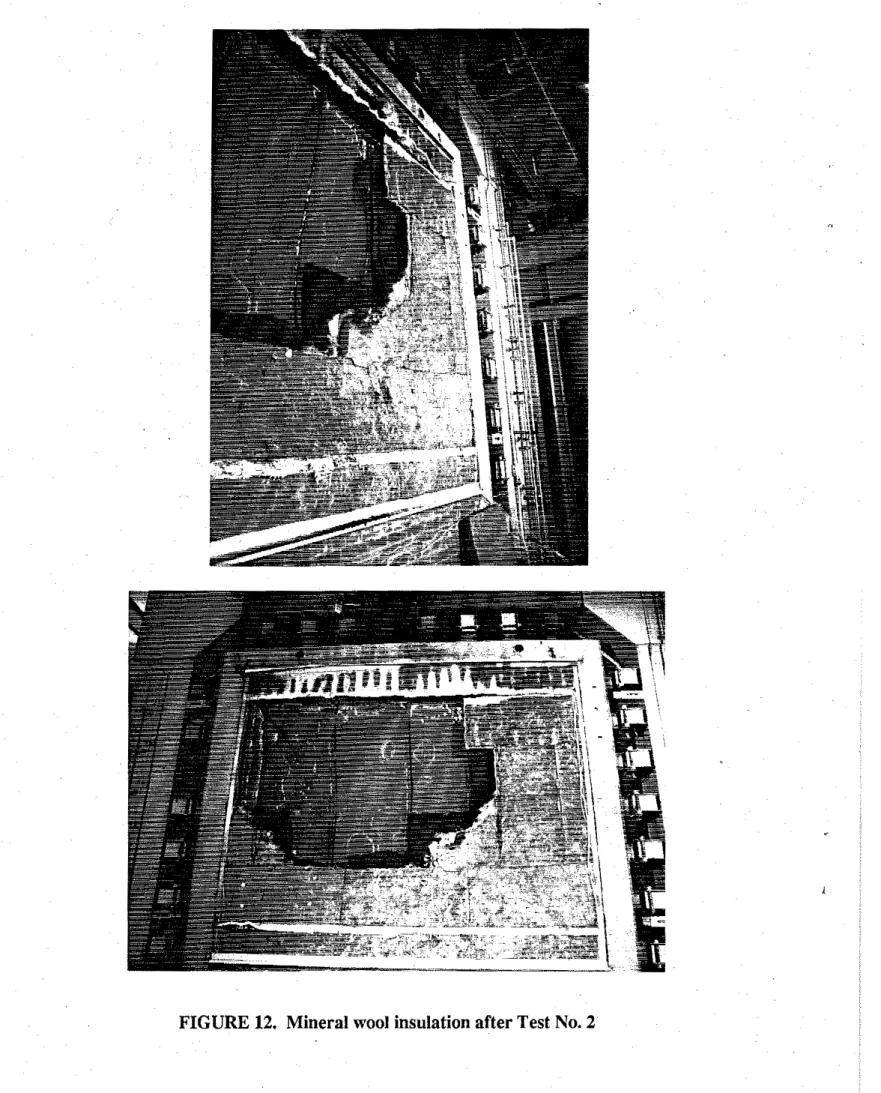
- A large section of insulation fell as the exterior cladding was being removed after the test (Figure 12). There was a visible gap under the Z-bar sub-girt, across the entire width of the specimen, caused by the sagging of the insulation. The gap was approximately 50 to 75 mm for the outer batts but considerably greater for the inner
.
batts. The inner batts were completely charred as in Test No. 1, while the outerbatts were charred up to approximately 40 mm deep at some locations.
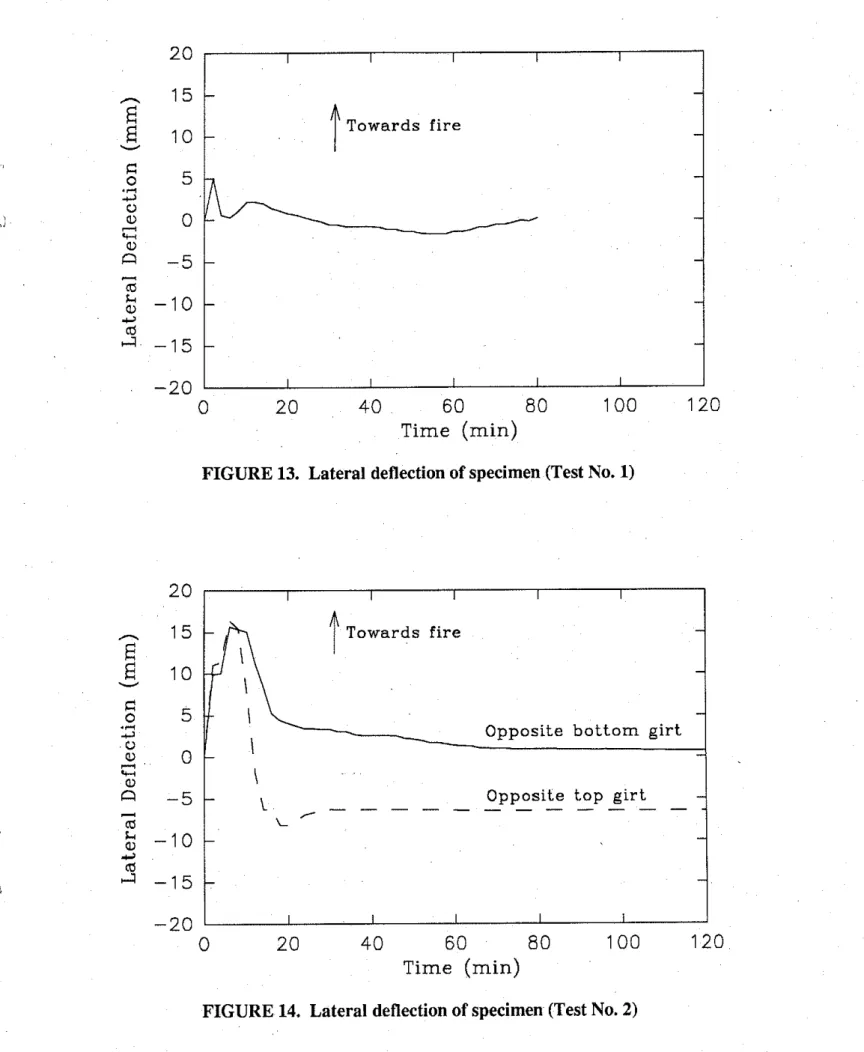
The lateral deflections measured in both tests are plotted in Figures 13 and 14. As expected, the specimen in Test No. 2 showed larger deflections than that in Test No. 1, due to the structural girts. In both cases, most of the deflections occurred during the f i s t 20 min.
Fire resistance ratings
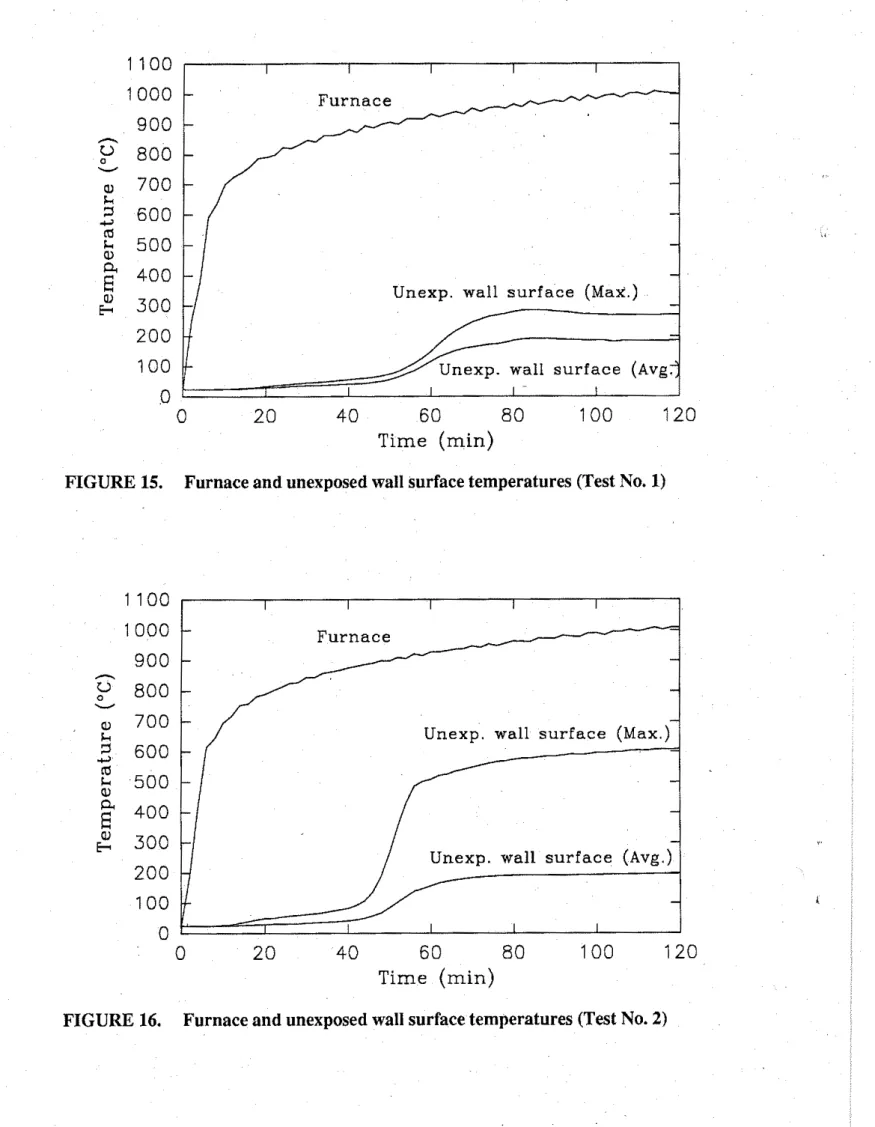
All the furnace, unexposed wall surface and Z-bar sub-girt temperature readings are given in Tables 1 to 8 for both tests. The average furnace temperature and the maximum and average temperatures on the unexposed surface of the specimens are shown in Figures 15 and 16.
The specimen in Test No. 1 failed at 65 rnin because its unexposed surface temperature, measured at Thermocouple No. 5, located opposite the Z-bar sub-girt, exceeded the individual temperature limit of 205OC (180°C temperature rise). The wall assembly thus achieved a 1-hour fue resistance rating.
The s~ecimen in Test No. 2 failed after 48 rnin because its unexuosed surface tempenlturi., m e w r e d at Thermocouple No. 2, locatcd opposite the to; 2-bar sub-girt, excccdcd the individusl temperature limit 0 i 2 0 5 ~ C (180°C tempcraturc rise). The wall
assembly thus failed the one-hour f i e resistance rating, but achieved a 45 rnin rating. Both tests failed opposite the Z-bar sub-girts. The difference in fire resistance between the two tests is likely due to the sagging of the mineral wool insulation in Test No. 2, which created a gap under the top Z-bar sub-girt. The sagging of the mineral wool insulation is the result of the larger spacing between the Z-bar sub-girts. The fact that the mineral wool batts were manipulated more than once during the construction of the
friable. The batts in Test No. 2 were first put in place without fasteners, as in Test No. I., but then removed to allow installation of stick pins to support them.
Except for the thermocouples located opposite the top Z-bar sub-girt, the
temperatures recorded in Test No. 2 are comparable to those obtained in Test No. 1. The presence of unprotected structural girts on the fire side had apparently no significant effect on the fire resistance rating of the waU assemblies.
These tests show that the Z-bar sub-girt spacing has an influence on the fire resistance rating of sheet steel wall assemblies insulated with 152 mm mineral wool
insulation of 96 kg/m3 density. Until further tests are conducted or unless the mineral wool batts are adequately supported to prevent sagging, it is suggested that the Z-bar sub-girt spacing be limited to 1525 mm for a 1-hour fire resistance rating.
Equivalent opening factors
The fire resistance ratings of the wall assemblies were limited to 60 rnin and 45 rnin as per CAN4-S101-M89 due to excessive unexposed surface temperature rise. The walls, however, met all the requirements of CAN4-S101-M89 for a 2-hour fire-exposure period, including prevention of the passage of flames and hot gases. The NBCC (Article 3.1.7.2) recognizes this situation and allows the unexposed surface temperature rise limitation in CAN4-S101-M89 to be waived, provided that a correction is made for radiation from the unexposed wall surface. This correction is achieved by translating the excessive
unexposed wall surface temperature into an equivalent area of unprotected openings, according to a formula given in Article 3.2.3.12. in the NBCC. This formula calculates an
eqziivalent opening factor, FEOI for the wall at the required f i e resistance period, as follows:
FEO = (T,
+
273)4 /(T,
+
273)4 whereT, = average temperature reached on unexposed wall surface at the time the required fire resistance rating is reached under test conditions;
T,
= 892OC for a fire resistance rating of 45 min 927OC for a fire resistance rating of 1 hour 10IO°C for a fire resistance rating of 2 hoursThe FEO factor expresses the equivalent area of unprotected openings as a fraction or percentage of the wall surface area
As a result of this correction, the limiting distance between the wall and the property line (NBCC Tables 3.2.3.A and B) is now governed by an increased area of unprotected openings which includes actual and equivalent unprotected openings.
With this special provision, the NBCC thus permits acceptance of an exterior wall which does not meet the required fire resistance rating due to excessive temperature rise on its unexposed surface, but which remains in place for the required fire resistance period.
The FEO values for the assemblies described in this report are given below for 1- and 2-hour fire exposure periods.
Average unexposed
surface temp.
T, PC)
FEO
I-h 2-h I-h 2-h
Specimen No. 1 - 185 1.6
(1-h FR rating)
Specimen No. 2 157 198 1.6 1.8
(45 min
FR
rating)Specimen No. 1, for example, which has a 1-hour fire resistance rating based on CAN4-S101-M89, can also be used where a 2-hour fire resistance rating is required if an additional area of unprotected openings, equivalent to 1.6% of the wall surface area, is assumed when determining the required limiting distance. Specimen No. 1 is thus equivalent to a 2-hour fue-rated wall with 1.6% unprotected openings.
Unprotected openings, whether actual or equivalent, are not allowed within a limiting distance of 1.2 m. Consequently, the acceptance of the wall assemblies beyond their fire resistance ratings is governed by a minimum 1.2 m set-back. The actual set-back will vary with the area of actual unprotected openings in the walls, the building occupancy, as well as the area and height to length ratio of the wall.
Influence of thermocouple pads on unexposed surface temperature measurements
Figures 17 and 18 compare, for both specimens, the average unexposed surface temperature measured by thermocouples covered with pads with that measured by exposed thermocouples. As expected, the covered thermocouples yielded temperatures higher than those measured by the exposed ones. The presence of the pads locally reduces heat loss from the wall surface and; therefore, the th6rmocouples indicate tempkratures in excess of those that would normally be expected on the surface. Exposed thermocouples are expected to better reflect the true temperature of the unexposed wall surface. The pads were adopted in CAN4-S101-M89 to simulate the contact of combustible materials, such as furniture, with the unexposed surface 161. While that may be possible for a partition inside a building, it is unlikely to occur with exterior walls.
As shown in Figures 17 and 18, the difference between covered and exposed thermocouples readings increased with the absolute temperature of the unexposed surface of the specimen. Thedifference was rather small until the temperature of the unexposed ' surface reached the limit allowed bv CAN4-S101-M89. It then increased substantiallv as the unexposed surface temperaturehcreased. The difference in the average unexposed surface temperature between the two methods was approximately 30 to 40°C (or 20 to 25% of the average surface temperature) after two hours of fire exposure.
Further data on the influence of thermocouple pads on the measurement of the unexposed surface temperatures is given in [3], where the exposed thermocouples were sihcr-soldered to the surface, instead of being fastened.
Radiation from unexposed wall surface
The heat flux measurements made at various heights during the tests, 1.2 m from the unexposed surface of the specimens, are shown in Figures 19 and 20 and compared
with the predicted radiation intensity at mid-height based on the average unexposed surface temperature of the specimens. Two predicted radiation intensity curves are shown, one calculated using covered thermocouple readings and the other using exposed thermocouple readings. A wall surface emissivity of one was assumed in the calculations.
For both tests, the calculated radiation intensity at mid-height is higher than that
measured (Curves A, B and D). As expected, the radiation intensity calculated using ?%
exposed thermocouple readings is in better agreement with the measured heat flux than that calculated using covered thermocouple readings. The difference between measured and
calcuIated heat fluxes can be explained by the non-uniform temperature distribution on the J
unexposed surface of the specimen and the emissivity of the unexposed surface.
As mentioned earlier, unprotected openings, whether actual or equivalent, are not allowed within a limiting distance of 1.2 m. As a result, the sheet stecl walls must have a minimum limiting distance of 1.2 m or more when the equivalent opening factor provision is anolied. i.e. when their f i e resistance rating is less than that reauired. In such
. .
situB'tions, no adjacent structure would be locited closer than 1.2 to the wall. The maximum heat fluxes measured at 1.2 m during the 2-hour fire tests were 0.6 kW/m2 in Test No. 1 and 1.1 kWIm2 in Test No. 2. ~ h e k values are considerably lower than the critical heat flux of 12 kW/mz for piloted ignition of combustible materials [5], which was
assumed when deriving the limiting distance requirements in the NBCC. Even the predicted radiant heat flux is significantly lower than the critical heat flux. The minimum
1.2 m limiting distance thus appears conservative in this case.
Comments on the equivalent opening factor provision in the NBCC There is very little information of how the equivalent opening factor formula in Article 3.2.3.12. was derived. This factor was introduced in 1970 to permit acceptance of an exterior wall assembly which fails to provide the required fue resistance rating due to excessive heat transmission (surface temperature rise criteria), but remains in place for the required period. The formula converts the heat loss from the entire wall into an equivalent area of unprotected openings. The radiation from the entire wall is thus assumed equivalent to that emitted by the unprotected openings. The equivalent area of unprotected openings is then used to determine the minimum limiting distance which will prevent fire spread to adjacent buildings, according to Tables 3.2.3.A and B.
This approach, however, presents several inconsistencies, which may lead to conservative limiting distances, as discussed below:
-
The limiting distance values given in Tables 3.2.3.A and B in the NBCC account for the horizontal projection of flames from unprotected openings, whereas the equivalent opening factor provision requires that the wall prevent passage of flames. The minimum 1.2 m limiting distance within which unprotected openings are not permitted is based on the maximum flame projection observed during the series of full-scale experiments from which Tables 3.2.3.A and B were derived.-
It is also questionable to sum directly equivalent with actual unprotectedopenings because the radiation intensity from these openings is different. Actual openings assume a real fire in the building where the peak is attained
approximately 10 to 30 min after the outbreak of the f i e (see A-3 in the Appendix to the NBCC, Fire fighting assumptions), whereas equivalent
openings are based on radiation from standard 45 min, 1 or 2 hour standard fires which have no decay period.
-
The equivalent opening factor provision uses the wall surface temperatures measured in the fire test with thermocouples covered with pads. As discussed earlier, this technique proved to yield temperatures higher than the true surface temperatures.-
It is also known that the temperature rise criteria of the standard test, namely 140°C maximum average temperature rise and 180°C maximum local temperature rise, are overly conservative [6,7]. Based on ignition tests of combustible materials, Schwartz and Lie [7] suggested that the criteria be changed to 222°C average and 250°C local temperature rises. Therefore, an exterior wall whose surface temperature exceeds the current criteria by a few degrees certainly does not present the same hazard for fire spread as an unprotected opening.It thus appears evident that a revision Of the equivalent opening factor provision is needed to give better recognition to exterior walls that fail to provide the required fire resistance ratings based on failure by the current CAN4-S 101-M89 unexposed surface temperature rise criterion.
CONCLUSION
A new fire-rated exterior sheet steel wall assembly has been produced. The assembly is a sandwich-type sheet steel wall panel insulated with 152 mm mineral wool insulation of 96 kg/m3 density. The fire resistanee rating of the assembly varies from 45 to 60 min depending on the vertical spacing between Z-bar sub-girts. At the moment, it is recommended that the Z-bar sub-girt spacing be limited to 1525 mm for a 1-hour fire resistance rating.
The exterior wall assembly also qualifies where a 2-hour fire-rated wall is required, if the limiting distance is increased according to the equivalent opening factor provision in the NBCC. The equivalent opening factor of the wall assembly is less than 2% for a 2-hour fire resistance rating. This special provision in the NBCC, however, proved conservative and needs to be revised.
REFERENCES
1. National Building Code of Canada 1990, National Research Council of Canada, NRCC 30619, 1990.
2. Bardell, K.H., Fire tests on insulated sheet steel walls, Building Research Note No. 219, Institute for Research in Construction, National Research Council of Canada, 1984.
3. Chabot, M., Fire resistance tests of exterior sheet steel walls insulated with 152 mm thick, 64 kg/m3 density, mineral wool insulation, Internal Report No. 617, Institute for Research in Construction, National Research Council of Canada, 1991.
4. Standard Methods of Fire Endurance Tests of Building Construction and Materials
-
CAN4-SIOI-M89, Underwriters' Laboratories of Canada, 1989.5. McGuire J.H., Fire and Spatial Separation of Buildings, Fire Technology, Vol. 1, NO. 4, 1965, pp. 278-287.
6. Harmathy, T.Z., Temperature of the unexposed surface of f i e resistance test specimens, Journal of Testing and Evaluation, ASTM, Vol. 13, No. 2, 1985, pp. 127-131.
7. Schwartz, K.J. and Lie, T.T., Investigating the Unexposed Surface Temperature Criteria of Standard ASTM E119, F i e Technology, Vol. 21, No. 3, 1985, pp. 169-180.
ACKNOWLEDGEMENTS
The author wishes to thank R.C. Monette, D.W. Monvick and J.W. MacLaurin from the National Fire Laboratory of the Institute for Research in Construction for performing the tests and assisting in the preparation of this report.
The Canadian Sheet Steel Building Institute, VicWest Steel and Canadian Gypsum Company have also contributed to this project
SIDE
VERTICAL SECTION
HORIZONTAL SECTION
VERTICAL SECTION
@
HORIZONTAL SECTION
FIRE SIDE
50 rnrn
FIGURE
4. Locations of furnace thermocouplesL
935 rnrn-
935 rnrnII
1830 rnrn - 1830 mrn
I
L
1000 rnrn 1e n
FIGURE 5. Locations of thermocouples on unexposed wall surface and z-bar sub-
TOP Z-BAR SUB-GIRT
1
7
L
FIGURE 6, Locations of thermocouples on unexposed wall surface and z-bar sub- girt (Test No. 2)
.-
E
10 Towards fire V-20
1
I I 1 I I I0 2 0 40 6 0 80 100 120
Time (min)
FIGURE 13. Lateral deflection of specimen (Test No. 1)
I-
I/\ Towards fire-I
-
- Opposite b o t t o m g i r t -201
I I I I II
0 2 0 4 0 6 0 80 100 120 Time (min)- -
- -
Unexp. wall surface (Max.) -
-
all surface (~vg:I
0 2 0 40 6 0 8 0 100 120
Time (min)
FIGURE 15. Furnace and unexposed wall surface temperatures (Test No. 1)
Furnace
Time (min)
FIGURE 17. Comparison between average unexposed wall surface temperatures measured by covered and exposed thermocouples (Test No. 1)
300 I I I I I 250
-
Ue
200 0 1 I I I I II
0 2 0 40 6 0 80 100 120 Time (min)-
-
- -
- Covered thermocouples Exposed thermocouples --
-
250 200 150 100 50FIGURE 18. Comparison between average unexposed wall surface temperatures measured by covered and exposed thermocouples (Test No. 2)
w
-
- - - - _ _ _ _ : k w - - 0 I I I I I 0 2 0 40 6 0 8 0 100 120 Time (min) --
Covered thermocouples - - - - Exposed thermocouples-
3 r _ _ _ - _ - - --
- - - - - -B: exposed thermocouples Measured radiation
0 2 0 40 60 80 100 120
Time (min)
FIGURE 19. Radiation intensity at 1.2 m from unexposed wall surface (Test No. 1)
I I
Calculated radiation based on surface temp. A: covered thermocouples B: exposed thermocouples A Measured radiation
,
- - -
n
,
/ / Time (min)TABLE 1. Furnace temperatures (Test No. 1) Time (min) 0 2 4 6 8 10 12 14 16 18 20 22 24 26 28 30 32 34 36 38 40 42 44 46 48 50 52 54 56 58 60 62 64 66 68 70 72 74 76 78 80 82 84 86 88 90 92 94 96 98 100 102 104 106 108 110 112 114 116 118 120 Std. furn. temp. ( O C ) 20 704 795 843 878 905 927 946 963 978 991 1001 1010 Avg. 24 252 380 592 638 701 726 741 761 788 792 801 824 821 835 850 843 864 864 869 885 876 897 890 901 909 902 920 919 920 936 927" 936 943 935 954 944 956 959 954 970 959 978 968 975 981 976 991 979 997 985 996 1001 989 1004 1005 998 1011 1007 1004 1003 Furnace temperatures ("C) #1 #2 #3 #4 #5 #6 #7 #8 #9 24 26 24 24 22 24 24 24 24 291 407 205 221 250 318 174 179 220 376 447 396 347 378 427 329 346 374 578 644 609 558 590 635 548 570 597 627 681 653 613 636 683 603 619 631 709 743 742 667 699 755 654 666 678 739 773 779 698 723 785 664 673 697 751 782 792 731 739 805 675 679 717 759 791 800 745 759 811 711 717 758 784 813 810 772 786 827 756 760 785 786 811 808 777 789 828 765 768 792 792 818 817 785 799 828 781 790 802 815 842 835 808 822 856 805 816 820 811 836 832 806 817 849 804 813 818 823 850 846 819 831 859 821 831 833 840 865 858 836 846 880 833 845 845 833 857 854 829 841 869 830 839 840 852 879 873 850 861 890 850 862 861 854 878 873 852 862 892 849 860 859 857 883 880 856 865 893 857 868 867 874 901 893 873 883 912 869 881 879 865 889 886 864 874 900 863 874 871 886 913 905 886 895 922 883 895 892 880 905 899 880 888 914 876 888 884 890 916 911 890 899 923 888 900 897 899 925 918 898 907 934 894 906 904 891 915 912 891 900 923 890 901 897 907 935 928 908 917 940 907 920 916 908 934 927 908 917 941 904 917 914 907 934 930 908 918 939 907 920 917 925 953 944 925 934 956 921 936 932 916 941 936 916 925 947 913 926 922 924 950 945 925 934 954 924 938 933 933 959 951 932 937 963 929 943 940 924 949 944 925 933 952 924 936 932 942 970 962 942 952 972 940 956 951 934 959 952 934 941 962 931 945 941 944 970 965 944 951 972 943 959 954 949 975 967 948 957 978 944 959 956 942 967 963 942 951 969 941 957 952 959 986 978 959 967 989 955 971 967 948 972 967 947 956 975 946 962 957 966 995 986 967 976 996 964 980 975 957 982 976 957 965 986 953 969 965 962 989 984 963 972 991 962 978 974 970 997 989 969 978 1000 966 982 977 963 988 985 964 973 991 963 979 974 980 1007 999 979 989 1010 976 993 988 967 992 987 967 976 996 966 981 976 985 1012 1005 985 994 1015 983 1000 994 974 998 993 974 982 1003 972 987 982 983 1009 1004 983 993 1012 983 999 994 991 1016 1008 989 998 1022 986 1002 997 978 1001 998 978 987 1006 978 993 987 992 1018 1013 992 1001 1021 991 1008 1002 994 1020 1012 993 1002 1026 990 1006 1002 986 1010 1006 986 995 1013 986 1001 995 999 1025 1019 998 1009 1029 998 1014 1009 997 1022 1015 996 999 1028 993 1009 1004 992 1017 1013 993 1001 1020 993 1008 1002 994 1014 1010 994 1003 1015 991 1006 1000
TABLE 2. Unexposed wall surface temperatures measured by covered thermocouples (Test No. 1)
I I I I 1
-
Measurements not reliable * Failure by maximum unexposed surface temperature rise criterion Unexposed wall surface temperatures ("C)Avg.
I
#1 #2 #3 #4 #5 #6 #7 #8 #9Time (min)
Furnace temp. (OC)
TABLE 3. Unexposed wall surface temperatures measured by exposed thermocouples (Test No. 1)
I I I I I
-
Measurements not reliable Time(min)
I I I
Furnace temp.(%)
Unexposed wall surface temperatures (C)
TABLE 4. Z-bar sub-girt temperatures (Test No. 1) Time (min) 0 2 4 6 8 10 12 14 16 18 20 22 24 26 28 30 32 34 36 38 40 42 44 46 48 50 52 54 56 58 60 62 64 66 68 70 72 74 76 78 80 82 84 86 88 90 92 94 96 98 100 102 1 04 106 108 110 112 114 116 118 1 20 Furnace temp. ( O C ) 24 251 380 592 638 701 725 741 760 787 791 801 824 820 834 849 843 863 864 869 884 875 897 890 901 909 901 919 91 8 919 935 926 935 942 934 953 943 955 958 953 969 958 977 967 974 980 975 990 978 996 984 995 1000 988 1003 1004 997 1010 1006 1003 1001
2-bar sub-girt temperatures ( O C )
#20 #21 #22 #23 #24 #25 24 24 24 24 24 24 28 24 29 24 24 24 59 37 62 29 25 28 90 62 99 40 31 39 1 24 1 08 142 55 43 55 161 160 188 72 61 74 200 201 231 91 83 96 234 234 271 1 1 1 1 04 118 264 261 308 130 1 24 1 39 290 284 340 1 47 1 42 1 59 312 301 369 163 177 333 312 398 1 78 1 73 352 324 428 1 92 185 158 210 194 370 339 454 205 197 225 388 356 484 218 209 239 405 375 51 5 228 221 249 421 393 541 240 228 261 445 41 1 574 252 236 274 493 434 598 266 247 285 555 460 622 283 258 293 607 489 648 306 272 303 655 520 664 332 288 313 700 557 692 363 306 324 728 602 707 402 324 337 753 652 729 450 345 350 765 693 748 504 367 364 772 723 759 574 390 378 784 752 780 650 414 394 790 773 792 716 441 410 802 794 807 765 473 429 813 807 826 793 512 449 819 802 832 803 562 469 829 802 851 816 618 489 831 802 866 822 695 509 835 81 4 870 832 774 527 847 830 890 851 813 544 851 838 892 859 828 561 863 849 905 874 837 588 867 851 909 878 833 619 875 855 909 884 837 643 882 863 918 887 846 662 883 872 909 885 853 677 890 890 921 890 859 690 892 898 916 889 850 697 902 902 923 897 804 704 904 898 925 895 688 706 906 897 922 893 680 709 91 1 901 930 893 680 71 1 91 1 896 922 886 679 71 1 928 902 932 884 680 713 938 897 923 839 678 712 947 902 928 777 679 714 952 903 926 780 678 71 4 944 900 918 780 678 714 954 906 927 786 678 71 5 956 905 926 786 677 714 951 905 924 787 677 715 961 909 931 792 678 716 959 908 929 792 677 714 956 908 929 794 677 71 5 955 908 930 795 677 71 5
TABLE 5. Furnace temperatures (Test No. 2) Time (min) 0 2 4 6 8 10 12 14 16 18 20 22 24 26 28 30 32 34 36 38 40 42 44 46 48 50 52 54 56 58 60 62 64 66 68 70 72 74 76 78 80 82 84 86 88 90 92 94 96 98 100 102 1 04 106 108 110 112 114 116 118 120 Std. furn. temp. PC) 20 704 795 843 878 905 927 946 963 978 991 1001 1010 Avg. 25 190 417 613 645 696 719 754 759 783 790 803 814 827 829 845 845 859 863 868 876 882 888 892 899 899 91 1 908 922 916 928 928 932 937 938 948 944 955 950 957 965 963 963 974 971 973 983 980 978 989 991 985 995 994 1002 996 1002 1009 1001 1009 1009 Furnace temperatures ("C) #I #2 #3 #4 #5 #6 #7 #8 #9 26 25 25 26 24 25 25 25 25 241 314 235 181 189 188 129 126 109 417 483 458 393 416 475 356 370 384 616 683 658 597 612 680 543 560 572 645 694 673 641 643 697 594 611 604 708 755 745 699 695 764 622 641 637 723 767 772 721 717 794 636 652 687 756 794 791 753 752 811 693 708 725 756 787 785 752 758 801 723 734 736 777 807 802 776 782 820 758 766 758 782 810 807 782 789 824 770 779 770 795 822 819 795 802 836 783 793 781 803 831 830 804 812 845 795 807 794 817 844 842 819 825 858 807 821 806 818 845 845 820 827 858 812 825 810 835 861 861 836 843 874 826 841 826 834 861 861 836 844 872 829 842 827 848 874 874 850 857 886 841 857 840 852 878 879 854 862 890 847 862 847 858 883 884 859 867 895 851 867 851 864 890 892 866 875 902 860 876 860 871 896 897 872 880 907 865 882 865 876 901 903 878 886 912 872 888 872 882 906 908 883 888 916 876 893 876 888 913 915 889 898 923 883 900 885 889 913 915 690 898 922 883 900 884 899 925 927 901 910 934 895 913 897 897 921 923 898 906 930 892 909 893 910 937 938 912 919 945 906 925 907 905 929 931 906 914 936 901 917 901 917 943 944 918 927 950 911 931 914 917 941 943 918 926 948 912 931 914 923 946 948 922 931 952 916 936 918 927 950 953 927 936 957 922 941 924 929 952 954 928 937 958 921 942 925 938 962 962 938 946 967 932 953 936 934 957 957 934 942 961 928 948 932 945 969 968 945 954 973 938 960 943 939 962 963 939 949 967 936 956 940 946 970 971 946 950 975 942 964 948 953 978 979 954 956 983 950 972 957 951 975 977 951 962 981 948 970 955 951 975
gn
951 954 981 949 970 955 962 987 988 962 968 992 959 980 966 959 984 985 960 963 990 957 979 965 961 985 986 961 966 991 958 980 965 971 997 997 972 975 1002 968 990 978 968 992 994 968 971 998 966 987 975 966 990 992 966 970 996 964 985 972 977 1003 1003 978 980 1009 974 996 984 978 1002 1004 978 989 1009 976 997 986 974 997 999 973 978 1003 971 992 980 983 1008 1009 983 983 1014 981 1002 991 982 1006 1007 981 992 1012 979 1000 988 990 1016 1016 991 989 1021 988 1009 998 984 1007 1009 983 995 1013 982 1002 991 989 1014 1015 989 1000 1019 986 1008 996 995 1020 1021 996 1007 1026 993 1015 1004 989 1012 1014 988 1000 1018 987 1007 997 996 1020 1021 996 1007 1026 993 1015 1004 996 1021 1022 997 1000 1026 995 1016 1005TABLE 6. Unexposed wall surface temperatures measured by covered thermocouples (Test No.2)
I
I
I
' Failure by maximum unexposed surface temperature rise criterion
Unexposed wall surface temperatures ("C)
Avg.1 #I #2 #3 #4 #5 #6 #7 #8
Time' (min)
Furnace temp.(%)
TABLE 7. Unexposed wall surface temperatures measured by exposed thermocouples (Test No. 2) Time (min) 0 2 4 6 8 10 12 14 16 18 20 22 24 26 28 30 32 34 36 38 Furnace temp. ( C ) 25 190 41 7 613 645 696 719 754 759 783 790 803 814 827 829 845 845 859 863 868 AvQ. 24 24 24 24 24 25 26 28 30 31 32 33 34 36 37 38 40 41 43 46
Unexposed wall surface temperatures ("C)
#I2 #I3 #14 #15 #16 #17 #18 #19 #20 #21 #22 24 24 24 24 24 24 24 24 24 24 24 24 24 24 24 24 24 24 24 24 24 24 24 24 24 24 24 24 24 24 24 24 24 24 25 24 24 24 24 24 23 24 24 23 25 26 26 24 24 24 24 24 24 25 23 26 30 27 24 24 24 24 24 24 24 24 27 39 29 24 25 24 24 24 24 25 24 30 48 31 25 26 25 24 24 24 25 24 34 54 34 27 26 25 24 24 24 27 25 37 57 36 29 26 26 24 24 24 28 26 38 63 38 31 25 27 24 24 24 30 27 39 68 39 35 24 25 25 24 24 33 27 39 74 40 38 24 25 25 24 24 35 29 40 80 40 40 24 26 25 24 24 39 30 42 86 39 41 24 25 25 24 24 43 31 44 93 39 41 25 25 25 24 24 46 33 46 102 38 40 25 26 26 25 24 50 34 50 110 38 38 26 27 26 25 25 53 35 54 118 39 35 27 29 28 25 25 56 36 58 I 41 35 29 32 29 26 25 60 38
I
TABLE 8. Z-bar sub-girt temperatures (Test No. 2)
2-bar sub-girt temperatures ("C)
#23 #24 #25 #26 #27 #28 #29 #30 #31 #32 #33 #34 24 24 24 24 24 24 24 24 24 24 24 24 26 26 25 24 24 24 25 24 25 24 24 24 46 43 37 33 26 26 39 30 36 25 24 25 75 69 57 48 33 31 57 38 49 30 27 30 1 1 1 88 83 61 44 40 78 49 67 37 31 37 152 115 112 101 58 53 104 62 87 46 36 46 195 137 145 131 75 68 133 78 110 58 43 58 236 163 180 170 94 84 164 97 133 71 51 70 273 196 217 203 114 102 199 126 157 85 61 84 307 226 257 225 134 122 232 156 184 101 74 99 339 254 297 197 155 144 265 186 211 117 88 115 368 282 333 212 177 165 297 214 238 133 103 131 393 312 366 232 199 186 327 242 264 149 118 148 418 354 395 252 221 206 354 269 289 166 133 164 442 425 421 271 241 225 379 297 313 181 148 180 464 504 448 288 260 240 403 323 338 196 162 196 484 543 477 305 278 258 424 349 361 210 176 212 502 545 507 321 305 274 446 374 384 223 190 227 519 628 539 337 325 296 466 400 405 235 205 242 536 676 574 354 351 317 485 426 424 247 220 257 553 714 613 371 382 339 502 448 443 259 234 271 569 743 656 388 433 363 519 470 461 272 248 285 586 778 695 405 505 390 535 491 478 284 262 299 603 805 729 423 578 420 551 512 493 297 276 312 624 711 766 440 634 462 568 533 509 310 289 325 659 609 798 454 640 521 584 552 524 323 303 339 719 617 828 489 721 591 602 569 540 338 317 353 766 626 844 551 746 645 621 584 556 353 330 368 805 662 860 607 780 688 638 598 572 370 343 384 828 875 866 651 802 722 654 613 590 387 357 400 835 877 877 680 814 752 670 627 610 403 371 419 837 876 881 695 819 777 684 640 640 414 384 441 832 871 887 698 797 794 698 652 668 422 397 461 825 705 892 696 667 809 711 663 683 427 408 473 816 755 896 690 729 813 722 672 694 430 415 480 807 795 901 684 760 821 731 680 704 433 420 484 799 772 900 678 753 828 743 687 713 434 423 487 791 768 904 672 825 833 752 692 720 436 426 490 785 861 902 667 827 835 761 697 728 437 427 492 779 872 905 663 828 837 769 701 736 439 429 494 775 876 910 659 832 844 776 706 743 441 429 496 771 876 909 655 833 846 784 710 750 443 430 498 767 875 909 650 834 846 790 714 756 445 431 499 764 878 916 646 836 853 795 718 761 447 431 501 761 879 916 642 838 856 800 722 766 449 432 503 758 879 916 639 838 857 804 725 770 451 433 505 756 882 923 636 842 862 809 728 774 454 434 507 755 883 923 634 844 861 813 731 779 456 434 509 753 882 921 632 843 860 816 734 782 459 435 510 750 885 929 629 846 866 819 736 785 461 436 512 750 888 931 628 850 869 824 739 789 464 437 514 749 886 928 628 849 866 827 742 792 466 438 516 748 191 935 627 853 874 830 744 795 469 439 518 748 890 934 626 853 873 832 747 797 470 440 519 747 893 941 625 857 880 836 749 800 472 441 520 746 892 938 624 857 878 839 752 803 474 443 522 745 893 940 623 856 880 840 753 805 476 444 523 745 897 946 624 861 886 843 756 808 478 444 525 746 896 943 625 860 884 846 758 812 480 445 526 745 897 946 625 861 886 847 760 814 482 446 528 745 899 948 626 864 890 850 762 817 484 447 530 Time (min) 0 2 4 6 8 10 12 14 16 18 20 22 24 26 28 30 32 34 36 38 40 42 44 46 48 50 52 54 56 58 60 62 64 66 68 70 72 74 76 78 80 82 84 86 88 90 92 94 96 98 100 102 104 106 108 110 112 114 116 118 120 - Furnace temp.(OC) 25 190 41 7 613 645 696 719 754 759 783 790 803 814 827 829 845 845 859 863 868 876 882 888 892 899 899 91 1 908 922 916 928 928 932 937 938 948 944 955 950 957 965 963 963 974 971 973 983 980 978 989 991 985 995 994 1002 996 1002 1009 1001 1009 1009