Cal-Adapt and the Usability of Climate Adaptation Tools
By
Melissa Deas
BA in Sociology
Harvard University
Cambridge, MA (2010)
ARCHNES
MASSACHUSETTS INSTITIITE OF TECHNOLOLGYJUN 29 2015
LIBRARIES
Submitted to the Department of Urban Studies and Planning in
partial fulfillment of the requirements for the degree of
Master in City Planning
at the
MASSACHUSETTS INSTITUTE OF TECHNOLOGY
June 2015
0 2015 Melissa Deas. All Rights Reserved
The author hereby grants to MIT the permission to reproduce and to distribute
publicly paper and electronic copies of the thesis document in whole or in part in
any medium now known or hereafter created.
Author
Signature
redacted
Certified
bySignature
redacted
Accepted by
Department of Urban Studies and Planning
(May 21, 2015)
Professor Frank Ackerman
Department of Urban Studies and Planning
Thesis Supervisor
Signature redacted
Pio'fessor Dennis Frenchman
Chair, MCP Committee
Department of Urban Studies and Planning
Cal-Adapt and the Usability of Climate Adaptation Tools
AbstractCommunities around the globe have already begun to feel the impacts of climate change. Looking forward, the impact will only become more pronounced. As such, an increasing number of municipalities, counties, and states are asking how they can prepare. Various non-profits, public entities, and even the private sector are trying to facilitate smart preparedness policies by providing tools that forecast expected changes and provide guidance for vulnerability assessments. Many of these tools take the form of map-based visualizations showing downscaled climate data. This thesis explores whether communities are actually able to use this downscaled data to inform decisions and consider policy options that will increase their resilience.
I specifically focus on a tool produced by the State of California called Cal-Adapt. Based on interviews with local officials and climate professionals across California, I find that climate tools like Cal-Adapt do provide value. They deliver information needed by local officials to think through future conditions and lobby for the resources they need. Despite this, Cal-Adapt is not reaching its full potential. Local action is impaired by an ambiguous policy objective at the state level regarding what local officials ought to be doing to respond to climate change. This lack of guidance is reflected in Cal-Adapt, which fails to support specific decisions. As a contrast to Cal-Adapt, I look at two other web-based tools, and one case study of a county that applied climate data quite heavily in its vulnerability assessment. In all three examples, the data developers employed a collaborative approach that brought decision-makers, stakeholders, and scientists together. All three tools gained power through this collaborative process, making their data more usable when compared to Cal-Adapt. However, even in places with access to collaboratively built tools, the state's failure to
Acknowledgments
This thesis would not have been possible without the team of people who supported me. My thesis advisor, Frank Ackerman worked with me every step of the way, providing thoughtful
feedback and reading drafts, no matter how rough they were. His feedback allowed me to improve the depth of my analysis and final written product. Additionally, I would like to thank my reader Larry Susskind who constantly pushed me to be more assertive in my findings and pointing out gaps and questions I had not thought of.
I would also like to thank Susan Wilhelm and Guido Franco at the Energy Commission. When I came to the Energy Commission I never imagined that it would be such an empowering work environment. They supported all of my research, did not shy away from critical feedback, and embraced opportunities to improve Cal-Adapt. Susan and Guido give me confidence that California is in good hands.
Additionally, I need to thank the many people who spoke with me during my research. This thesis is built on their feedback and I would like to thank everyone who took time to speak with me despite their busy schedules. It was great to learn about the work happening throughout California and meet so many passionate people working on this important topic.
I must also thank the many students within my department that spent long hours in coffee shops and libraries writing by my side, reflecting when necessary, and reminding me that we were all working on this together. Finally, I want to thank my parents Bruce Deas and Suzel Bozada-Deas and my fiance Jep Johnson. They listened to my moments of exasperation and celebrated my
Table of Contents
C hapter 1: Introduction ...
5
W hat is Cal-A dapt?...8
The Q uestion...13
M ethods...14
Q uestions beyond the scope of this thesis:... 18
Sum m ary of M ain Findings:...19
A W ord of T hanks to the California E nergy Com m ission ... 20
C hapter 2: T he Literature ... 22
W hat is Clim ate A daptation?...23
M aking G ood D ecisions, G enerally...25
Clim ate A daptation and Scale...28
Inform ation Barriers to A daptation Planning ... 29
H ow This T hesis A dds to the Literature ... 36
C hapter 3: T he U sability O f C al-A dapt ... 37
A Story... 37
T he H istory of Cal-A dapt...41
M y Feedback...45
The Five Com ponents of U sability in Cal-A dapt... 46
H ow Can Cal-A dapt Im prove?...63
Chapter 4: Other Approaches to Developing and Using Climate Adaptation Tools... 66
W eb-Based Tools...67
O ur Coast, O ur Future ... 68
Coastal Resilience T ool...76
Climate Adaptation in Sonoma County - A Collaborative Approach... 83
A dditional Lessons from These A lternative A pproaches ... 92
C hapter 5: C onclusion ... 98
Sum m ary of M ain Findings... 101
A dditional Findings W orth Further Investigation... 104
Final Thoughts ... 109
W orks C ited ... 111
Chapter 1: Introduction
Resilience, climate adaptation, climate preparedness-these words are becoming
increasingly common in urban and regional planning dialogues. More and more, communities are recognizing that climate change is real and is already having a tangible impact on the built environment, natural systems, and the socio-cultural relationships to the spaces in which we live (Bierbaum et al., 2012; Flood and Schechtman, 2014; Rickards, et. al, 2014). In August 2014, I was one of 800 attendees at the first California Adaptation Forum. Here, elected officials, researchers, non-profits, and public and private sector representatives came together to discuss how to better prepare California for the real impacts of climate change. All of us were concerned with how changing climatic conditions would impact important systems in California including water, energy, public health, biodiversity, agriculture, public safety, and vulnerable populations.
At this time, I was wrapping up a ten weeks summer internship with the California Energy Commission (CEC). During this, I collected end-user feedback on the CEC's web-based climate adaptation resource: Cal-Adapt.' Cal-Adapt is an online tool that features climate projections on: temperature and extreme heat, precipitation forecasts, wildfire risk, sea level rise, and snowpack melt, downscaled to a 12 by 12 kilometer grid for the entire state of California. Over the summer, I interviewed city planners, county officials, consultants, and academics across California regarding their experience using Cal-Adapt and their progress on climate adaptation. These interviews left me surprised at how behind many of these Californians felt. Despite California's reputation for being progressive on climate issues, many leaders commented that they were still trying to figure out where to start. Even those who had made significant progress, and were described by their
colleagues as success stories, spoke of their accomplishments humbly. They noted how much more remained to be done. Most reported continued frustrations including limited capacity, a lack of adequate funding, and uncertainty about what to do next. Many of these same people attended the California Adaptation Forum to figure out how to move forward in their own sectors and communities. Did they need more information and better online resources like Cal-Adapt? How should they conduct a vulnerability assessment? How should they move from simply talking about risks to addressing them? How should they measure progress?
This problem is not unique to California. Recently, a group of graduate students at the University of Michigan tried to untangle what support climate adaptation planners needed and if resources existed to fulfill their needs. They surveyed 89 organizations nationwide that are working on climate adaptation to assess the current state of adaptation resources. They found a vast number of resources already in existence. These 89 organizations relied on over 3,400 distinct climate adaptation resources or services (websites, guidebooks, maps, etc). Describing this research in a webinar, Melissa Stults (2014) stated, "Many of you have probably heard before that the landscape feels overwhelming, and perhaps a little muddled. I can tell you as someone who works in this space, and has for the last decade, 50% of the resources that we came across and were coding were things I had never even heard of before. So the landscape is enormous. And again this is only 89 organizations." Many of those I interviewed explained that there were too many resources out there, leaving them confused on how to evaluate which were most relevant or correct. Even more, many of the resources do not address their primary questions and hurdles. Clearly, these 3,400 resources (including Cal-Adapt) need to be assessed critically.
In part, my interviewee's confusion relates to the complexity of climate adaptation and the number of other challenges faced by decision makers; tools and resources cannot solve many of the problems these practitioners face. If city officials are overworked and stretched too thin to
even think about climate adaptation, then websites, guidebooks, and tools like Cal-Adapt will fall on deaf ears. Perhaps more tools, or even better tools, are not the ultimate solution. Rather, the state should be providing assistance or increased funding to build local capacity.
However, what currently exists in Cal-Adapt, a state sanctioned, readily available, downscaled set of climate data, is certainly worth evaluating. It takes time and political will to build capacity and create more funding sources. In contrast there is already a team of developers working on Cal-Adapt. Additionally, the CEC spent two full years developing the tool using public funding (Koy et. al, 2011). Any investment such as this must be tested and evaluated. Even more, during my conversations with adaptation specialists I learned that Cal-Adapt is a tool that some see as a potential model for new adaptation resources. For example, I spoke with one member of a White House Task Force on Climate Preparedness and Resilience who had visions of integrating aspects of Cal-Adapt into the U.S. Climate Resilience Toolkit. He wanted similar downscaled information available nationwide (McCormick, 2014). Another individual at the Urban Sustainability Directors Network explained that other states envy resources like Cal-Adapt:
Cal-Adapt is something that other people really wish they had outside of California.... They see a lot of value in someone externally providing a really sleek visual interface that anyone could access that brings together information about what is projected to happen. They value that it has credibility behind it; the state government's role is a really big deal.. .They are hungry for stuff that they can use (Fitzgerald, 2014).
Finally, one of the original tool developers within the state commented that California has received international recognition for this tool. Officials in Korea, Australia, and some island nations have reached out to learn what it took to make the tool, to see if they could replicate it domestically
(Malchow, 2015).
Despite these successes, the website has significant limitations, which I quickly uncovered through conversations with California decision makers. Many recognized the tool's potential, but
felt that it needed additional work to be fully successful. While some adaptation practitioners had applied Cal-Adapt to their work, many did not seem to understand what to do with the information within the tool (Deas, 2014)2. A look inside Cal-Adapt shows that it contains interesting local information, but little or no guidance regarding how to use it.
What is Cal-Adapt?
Cal-Adapt.org is a website developed by UC Berkeley's Geospatial Innovation Facility (GIF) and the CEC. The primary feature of the website are maps showing downscaled climate data. Additionally, the website also features publications from California researchers on climate change, short articles on climate change impacts, and background information on climate scenarios and modeling. Figure 1 shows the homepage for Cal-Adapt, which directs users through
the content of the site.
Figure 1.1: Cal-Adapt's home page. Screenshot from Nov. 11, 2014 2
0n August 27, 2014, 1 published an informal internal memorandum outlining potential updates on Cal-Adapt to the
CEC based on my interviews. This paper includes some of the same suggestions and builds off of these ideas within a
The easiest way to understand what Cal-Adapt does is to go on the website and explore the maps themselves. Many of them are dynamic and include visual animations that cannot be captured through static pictures. Figures 1.2-1.6 show a select number of screenshots, which give a sense of the website's content. Cal-Adapt's maps show climate change projections for temperature, wildfire risk, snowpack, precipitation, and sea level rise under high emissions (A2) and low emissions (B2) scenarios. The charts show changing conditions over time through the end
of the century. Information is presented on the website at either the county-level or at a 12
kilometer by 12 kilometer grid. This downscaling of information to the local level allows users to explore data tailored to where they live or work.
TEMPERATURE: DECADAL AVERAGES MAP
~~~
Sjay Park Area 0, *.
*t AVO
A"d Chast
Figure 1.2: Projected average temperature by decade from 1950 through the end of the century under a high emission scenario for the Bay Park Area of San Diego County. Screenshot from Nov. 11. 2014.
PRECIPITATION: DECADAL AVERAGES MAP
S.
~
el
San Diego County'*mod-I
Add Cha
Figure 1. 3: Projected average precipitation by decade from 1950 through the end of the century for San Diego County under a high-emission scenario. Screenshot from Nov. 11, 2014.
SEA LEVEL RISE: THREATENED AREAS MAP
p
San Mateo County
Meric 18.139.4 2,800 23.193 3.470.3 +19%
I
Figure 1.4: Projected areas threatened by sea level rise and storm surge risk for San Mateo County. Screenshot from Dec. 8, 2014.
OA7A SOUPCES 0 51,A0 W
WiLDFIRE: FIRE RISK MAP
LO H U
~
c-i AFigure 1.5: Projected wild fire risk for Sierra scenario. Screenshot from Nov. 11. 2014
SNOWPACK: DECADAL AVERAGES MAP
3
I"Al
County under a low emission
Sierra County *M 1~~c AJ41Ad
Ut
ock I o OW ;M.4x" .eV LOW ttIWio
Add Chart
Figure 1.6: Projected decadal average snowpack at the end of the century for
Sierra County
Loci, to o o~r
Add Chat
-The information provided around temperature is the most detailed. For each grid cell, Cal-Adapt shows the expected changes to the average, low, and high temperatures annually or by month. Cal-Adapt also provides detailed information regarding extreme heat, including projections on number of extreme heat days by year, timing of extreme heat days, duration of heat waves, and number of warm nights. Figures 1.7-1.8 show a selection of these temperature maps.
TEMPERATURE: EXTREME HEAT TOOL
QW OSIG MOfTl ThE 10. OMIc DISCLMAI
777, 77 7
*C4,WT*q*M T0q*M 0<
Figure 1.7: Number of extreme heat days by years for San Diego Region under a high emission scenario. Screenshot from Nov. 11, 2014.
TEMPERATURE: EXTREME HEAT TOOL
LOW HIGH
I
T r0F~' .4 ~ot~jOOFo H~cr ~ABOUT THE TOOL CHART DISCLAIMER
- 'i OPTIONS wow0c AA009 JuI' June F F~ F19O 1~ 497 190 1990 000 24010 2000O 2030 20404 200 2060 j070 2000 209
Hiti,tFca; Av. # Extreme Heal4 (ays 4 0 ExtremF Heat 0Oa T0000fitcl 4'
Figure 1.8: Timing of extreme heat days by year for Midpines Area under a high emission scenario. Screenshot from Dec. 8, 2014.
The Question
This thesis asks what can tool-developers and the state of California learn from Cal-Adapt
about the usability of downscaled climate projections presented on a web-based mapping platform
for local decision-making? This question is answered by: 1) analyzing end-user feedback on
Cal-Adapt, and 2) comparing Cal-Adapt to other tools and efforts to help communities use
downscaled climate forecasts.
Cal-Adapt was chosen because I have extensive experience with it through an opportunity
over the past summer to collect end-user feedback to share with the CEC. The purpose of this
research is to build on the academic literature regarding climate tools, drawing on information
from Cal-Adapt and the other tools I reviewed. However, I also aim to provide the CEC and other
state agencies with practical suggestions about how to better serve Californians as they work to
Methods
I conducted over 50 semi-structured interviews with a diverse set of actors across the state of California. This research was supported by MIT, and was approved by MIT's Committee on the Use of Humans as Experimental Subjects. The interviews were conducted in two phases. The first phase took place primarily in the summer of 2014 and focused on the end-user experience with Cal-Adapt. The second phase, conducted between October 2014 and February 2015, sought to fill in gaps and build on the data collected during the first phase. I aimed to better understand the history of Cal-Adapt in order to more accurately assess the success of the tool vis-a-vis its original intent. I also explored two similar tools and one case study. These were used to better understand Cal-Adapt's strengths and weaknesses by comparing it to other climate adaptation resources.
Selecting A Scope and Population:
During the first phase, I worked directly with the CEC. At this point they were preparing to do a series of updates on Cal-Adapt that would be released in the spring of 2015.' As such, the CEC team behind Cal-Adapt actively sought end-user feedback that could inform revisions to the tool. Given this practical need, I worked closely with the CEC to identify a series of questions that they wanted answered, including: Who is using Cal-Adapt? What are they using Cal-Adapt for? What issues or problems have users encountered? If people are not using Cal-Adapt, why not?
Potential users of Cal-Adapt include individual residents, farmers, business owners, researchers, land developers, utility providers, and a diverse set of public officials. The CEC recognized that it would be overly ambitious to try to speak with all of these potential users during one summer, and expressed interest in my focusing on local level public officials and staff engaged
in climate change planning. Even with this narrower population, the potential pOOi remained quite
3 As I am writing this thesis many of these updates are going into effect. Unfortunately, the timing of the updates was too late for me to explore whether the changes have improved the usability of the tool.
large. Scholars and practitioners alike argue that for adaptation work to be successful it must break down traditional silos between governmental agencies and departments because climate change's impacts will be felt across jurisdictional lines. Therefore, efforts should include contacts with officials from public health, emergency services, economic development, land use planning, and other departments (Archie, et. al., 2014; Brunner and Nordgren, 2012; Moser and Ekstrom, 2010).
Some communities were taking an integrative approach. For example, adaptation work in the County of San Diego involves officials from the Port of San Diego, each of the city governments in the county, emergency services, the Airport Authority, the Tijuana River National
Estuarine Research Reserve, ICLEI Local Governments for Sustainability, and various
foundations and university research centers (Hedge, 2014; Climate Collaborative, 2014). In other cities, adaptation is being addressed most proactively by a smaller subset of officials. For example, in Benicia, climate adaptation falls primarily on the shoulders of one specific climate action coordinator (Porteshawver, 2014). I found that the person or people most active in thinking about climate adaption varied significantly city to city, making systematic sampling incredibly difficult. I used a snowball sampling technique, finding most of my sample through other interviewees or contacts. During this process I also found that much of the actual technical work of adaptation planning remains in the hands of academics, consultants, and non-profits. Even though these are not public officials, I realized that any feedback on Cal-Adapt would be thin unless I contacted technical experts.
In the second phase of my research I was interested in addressing the questions that were not well answered by my first round of research. First, what is the history of Cal-Adapt and the state's intentions for this tool? To answer this I conducted a series of interviews with state officials and developers who were involved in the original design of the tool.
Second, if local adaptation planners did not find Cal-Adapt to be as useful as they hoped, are there other tools and resources that are helping communities be successful? How are these resources different from Cal-Adapt? To answer this question I interviewed developers involved in making other spatial analysis tools. Specifically, I spoke with tool designers behind Coastal Resilience Tool produced by the Nature Conservancy; Our Coast, Our Future produced through a partnership of various scientific organizations focusing on sea level rise risk in the Bay Area; and the data produced by the Terrestrial Biodiversity and Climate Change Collaborative (TBC3) in Sonoma County.
The Population
During the first phase, I conducted 40 interviews. Many of these interviewees could not be easily categorized into one group (for example non-profits that function in the public interest or academics working as consultants). However, as an over-simplification I categorized each to the best of my abilities based on the perspective most prevalent in the feedback I heard from them (See full list in Appendix, Table A.1). 10 participants represent the municipal level, 10 represent the county level, 6 represent regional bodies or organizations, 3 are state organizations, and 15 are technical experts from non-profits, academia, and private consultant firms active in climate change related work. Importantly, this sample is highly biased towards those already active in climate change related work because I was specifically looking for people who likely had some experience using Cal-Adapt and might have feedback to offer. I did try to include a diverse geographic range of places, including coastal and non-coastal communities, as well as rural, suburban, and urban communities. To fill geographic gaps, I did my own Internet research to identify additional people to contact.
Out of the 44 people I spoke with for phase I, 10 had never heard of Cal-Adapt prior to my contacting them, 9 had heard of it but never tried using it, 8 had visited the website but had not used it for official business, 4 had used it for basic tasks such as finding a graphic to insert into presentations they were preparing, and 13 had used it more extensively, often citing it directly in reports or materials they were preparing. Of the people who had used Cal-Adapt the most extensively, 6 were technical experts such as academics or consultants and 7 were local officials working at the city or county level.
Table 1.1: Summary of Phase 1 Interviews
Number of Interviewees by Category and Experience with Cal-Adapt
4 6 0 0 10 22.73% 2 2 4 1 9 20.45% 0 3 3 2 8 18.18% 1 1 2 0 4 9.09% 3 4 6 0 13 29.55% 10 16 15 3 44 100.00%
During the second phase, I interviewed another dozen people (see Appendix, Table A.2). This batch of interviews was much more focused on technical developers and included 1 county employee, 2 county level natural resources experts, 4 state employees, 6 tool developers and 3 consultants or technical experts (some overlap between the groups).
This research was combined with a review of key adaptation documents produced by the state, including support documents for local officials, regulatory documents from various agencies, and strategy documents that explain the states overall adaptation mission.
Questions beyond the scope of this thesis:
This thesis does not focus on what makes one climate model, scenario, or projection scientifically more accurate than another. There is a strong argument that downscaled climate data are inherently problematic, meaning that users must be careful when using such forecasts. This is part of an important debate, just not a concern in this thesis. For my purposes, I will consider the underlying information in all of the tools I review to be reasonably "correct." The only challenges I will put to these data are the ones expressed by the potential users I interviewed.
Additionally, I do not answer the questions of what climate science should be used to do or what successful climate adaptation looks like. Instead, I consider any "use" to be a sign of progress. I was originally tempted to define use as "actively considering future climate risks when making typical planning decisions such as where to allow future development, how much water to keep in reserve, and where to invest in flood protection efforts." However, given that most of the users I spoke with were in early stages of considering climate change risks and were not yet at the stage of proposing risk management strategies, if I were to define "use" this way no one would be succeeding. Instead, I consider "use" to be any attempt by decision makers to actively engage with
climate projections and assess their community's risk with the intention of considering policy changes.
Summary of Main Findings:
Cal-Adapt provides interesting information, but falls short of being a useful decision support tool. This is largely because decision support is not what the website was designed to do. Cal-Adapt remains too broadly focused to guide specific risk management decisions. As such, it is currently only used as a basic "information source" by highly motivated local officials who often have access to experts (such as academics, scientists, or climate consultants) that can help them apply the data within Cal-Adapt. Even so, these users are only using Cal-Adapt for basic vulnerability studies that fall short of informing on-the-ground-decisions. I find that local actors do not necessarily need more information, but rather action-oriented information and more prescription from the state. Once the state knows what decisions local actors should be making they should build a new version of Cal-Adapt that specifically aims to provide the information local officials need to fulfill state mandates.
In Chapter 2, I review prior scholarly work on the subject of downscaled climate forecasts. This chapter grounds my discussions of Cal-Adapt and climate science tools within the context of adaptation planning in general and current understandings regarding best practices. I will introduce a framework that I subsequently apply to assess the usability of climate forecasting tools. Finally, this chapter introduces the idea that the process by which tools are built has a large impact on their ultimate usability.
In Chapter 3, I argue that that many of Cal-Adapt's flaws are rooted in the fact that California's state government failed to formulate an adaptation strategy that envisions the types of decisions local actors should be making with climate projections in mind. This ambivalence and
lack of leadership is ultimately reflected in a tool that does not provide direction to users. Without more clarity regarding what the state expects localities to do about managing climate risks, Cal-Adapt will never be a true decision support tool.
In Chapter 4, I present three alternatives to Cal-Adapt. In each situation, decision makers and scientists worked together to figure out what information they needed and how best to collect and communicate it. This may be difficult for the producers of Cal-Adapt to do in a consistent fashion for the entire state. Regardless, these alternative efforts provide important insights into how communities actually come to understand climate information.
In Chapter 5, I review the key lessons from my research and make recommendations for addition research. Overall, I find that tools gain usability from either a clear mandate from above dictating their use, or from a collaborative process that allows end-users to determine how they intend to use the tool. Without one or the other, tools are likely to sit on a shelf.
A Word of Thanks to the California Energy Commission
Although this thesis discusses a number of shortcomings of Cal-Adapt, I don't mean to be overly critical of the CEC or GIF. In fact, I am in awe of what the fantastic team behind Cal-Adapt accomplished with very limited resources. The California Energy Commission realized that one of their key information gaps was their inability to assess how and whether people were using Cal-Adapt. This is the very reason they hired me. Throughout my work over the summer, the team did not shy away from frank discussions of the tool's limitations. They were incredibly receptive to suggestions about how the tool could be improved.
Based on my initial findings they are already pursuing some important changes. In March 2015 they added a new section to the website that provides more examples of successful climate change work, links to other decision support resources, and updates on recent news regarding
climate change. They are also in the process of incorporating improved data layers for sea level rise so that the website reflects the more dynamic and downscaled modeling. They are working with the Office of Planning and Research to allow Cal-Adapt to be used in an online planning guidance portal. All of this goes a long way toward responding to the feedback from users I collected over the summer of 2014. Despite this progress, if California decides that Cal-Adapt should be a true decision support tool, the website will likely need to be completely rethought and rebuilt to serve that purpose.
Chapter 2: The Literature
Climate change is already affecting California. Sea levels have risen by as much as seven inches along the California coast over the last century, increasing erosion and pressure on the state's infrastructure, water supplies, and natural resources. The state has also seen increased average temperatures, more extreme hot days, fewer cold nights, a lengthening of the growing season, shifts in the water cycle with less winter precipitation falling as snow, and both snowmelt and rainwater running off sooner in the year... If the state were to take no action to reduce or minimize expected impacts from future climate change, the costs could be severe. (California Natural Resources Agency, 2009, p. 3)
This statement opens the 2009 Calfornia Climate Adaptation Strateg. The report calculates that trillions of dollars worth of assets are at risk to sea level rise, wildfire, and extreme weather. Even without considering the less tangible costs (health, social, environmental, and indirect economic impacts), the situation is frightening. California must take concrete steps to adapt to changing circumstances and protect itself against these risks. Cal-Adapt is a tool that aims to locate and measure the severity of these risks so that California can more intelligently respond. How can climate adaptation tools like Cal-Adapt be useful to planners and decision makers in responding to climate change? What does successful adaptation planning even look like? How can a tool possibly improve planning without a clear image of how the tool should be used? These turns out to be an incredibly difficult question to answer.
Before delving into how Cal-Adapt performs these functions and how well it communicates critical information to potential users, this chapter takes a few steps back. I present an analysis of scholarly work that contextualizes Cal-Adapt within a general understanding of climate adaptation processes and best practices. This foundation allows me to better assess Cal-Adapt's role in helping decision makers protect California against climate risks and to identify how this research contributes to the previous scholarly work on climate adaptation.
What is Climate Adaptation?
The basic premise behind adaptation planning is that, even if the world cuts back on greenhouse gas emissions significantly today, it will be impossible to completely avoid the impacts of climate change. In fact, many places around the world are already experiencing climate related risks. Given this, communities should think critically and take actions that will either protect current systems against changing risks or adapt them to be more resilient under new climatic conditions. This might involve raising buildings to protect against sea level rise, improving insulation to adapt to higher temperatures, or building in better drainage to account for increased precipitation (Berkhout et al., 2006; Bierbaum et al., 2012; Palutikof ct al., 2013).
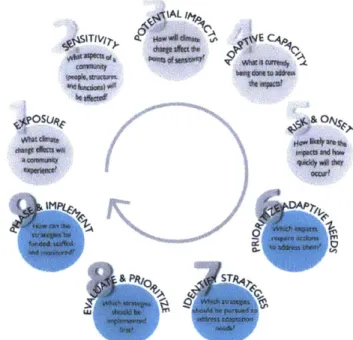
While there is no one methodology for climate adaptation planning, most scholars agree on a basic cycle for decision-making This cycle involving understanding risks and vulnerabilities, assessing options, implementing those options, monitoring the policies effectiveness, and revising strategies as needed (Baker, et al, 2012; Bierbaum et al., 2012; Carmin et al. 2012; Moser and Ekstrom, 2010a; Tribbia and Moser, 2008). This is a fairly open ended process and leaves much of the details to be figured out by the individual practitioners. Many state governments and non-profits have tried to provide more direction, publishing guidelines suggesting best practices. In California, the Natural Resources Agency, in partnership with California Polytechnic State University, and California Emergency Management Agency (now the Office of Emergency Services) published an Adaptation Planning Guide in 2012. It outlines a 9-step process that follows the understanding-assessing-implementing-evaluating process (see figure 1). The 68-page guide provides a detailed description of the types of actions that local planners could take within each step. However, even this long document remains at a relatively high level. For example, the guide suggests that decision makers first assess their exposure to climate change by using "the best available" data for their region. It points users to Cal-Adapt, but otherwise
provides little direction on where practitioners can locate the "best available" data or how they can evaluate climate data resources. Many of those I interviewed explained that it was difficult for them, as novices, to determine which resources would best serve their region or sector, suggesting that more guidance is needed at this step.
Using this information, a city or region can move on to step two: systematically brainstorming what "community structures, functions, and populations" (20) will be affected. The guide provides a checklist of potential systems to consider. This is useful for guiding decision makers into thinking about an expansive set of systems. Next, the guide recommends that the planning team conceptualize the impact climate change will have on those systems. Here the guide remains vague, recognizing that experts within particular sectors will have a better sense of how to evaluate specific systems. This makes sense, but means that success hinges on the ability of these experts to fashion a functional methodology for identifying potential impacts and assessing the likelihood of these impacts. Here, there is a real risk that communities may not pay enough attention to less obvious risks or
may not weigh risks in a way that is
_IE Cp
sensitive to vulnerable populations. .s
Overall, these guides provide a starting point. They do not,
however, describe a well-paved or owe
easily followed roadmap. Even
more, so few communities have
made progress on climate
adaptation, that is it hard to evaluate
Figure 2.1.California Adaptation Planning Guide (2012) nine-step how well this process actually works. process for adaptation decision-making. Page ii.
Bierbaum et al. (2012) in a comprehensive review of adaptation efforts surveyed 298 municipalities throughout the United States. Of these, only 13% had done a vulnerability assessment. Only a handful had begun assessing or choosing responses. Without on the ground action or response, there is only so much researchers can do to evaluate success.
Making Good Decisions, Generally
Stepping back from adaptation, one could make an argument that good adaptation planning simply looks like good planning. In fact, the framework for making adaptation decisions could be applied to most any decision. Identifying risks or needs, selecting options, implementation, monitoring, and revising based on feedback is generally good policy advice. Climate change seems like a particularly daunting challenge because one cannot rely on historic information to inform future decisions. Climate science and modeling is complicated and hard for novices to fully understand. Even more, people have a tendency to be reactive rather than proactive when pursuing risk related policy, which is especially dangerous with a slow moving crisis like climate change (Pearce, 2003). On the other hand, planners have been dealing with uncertainty for as long as the profession has existed. It is hard to predict how much a city will grow or shrink in fifty years, what technology will arise, or how the economy will change. El Nifio systems, earthquakes, hurricanes, and other natural disasters bring many unknowns regarding timing, severity, and degree of impact. Planners already have strategies for planning for all of these events.
The Successive Limited Comparison Approach
If adaptation planning is simply good planning, what does a good policy framework look like? It would be impossible and impractical to cover the full history of this debate. As a starting point, Lindblom (1959) famously argued that complex problem solving is less about making one
single good evidence-based decision, but rather is a process of "muddling through." He argues that rational policy analysis is impossible because policymakers lack the capacity, time, or information to know all the potential impacts of a policy or to consider all the possible alternatives to that policy. Instead, rational policy formulation should be discarded for a more practical methodology. He calls this the "successive limited comparison" approach in which policy-makers look at a small set of options that differ only slightly from current policies. This makes the scope more manageable for analysis. It also narrows the field to what is politically feasible. Change is achieved over time by making incremental tweaks to existing policies, mirroring evolution rather than transformational policy revolution.
Perhaps, when it comes to climate change, however, transformational policy revolutions are necessary. If the future will see drastic changes, must we respond with drastic policies? When it comes to mitigation, there is a strong argument for large-scale and radical change. Without severe reductions in greenhouse gas emissions, the global implications are quite possibly catastrophic. When it comes to adaptation, radical policy may not always be the best option. Kates et al. (2012) argue that transformational change (defined as either novel changes, changes that involve rethinking settlement patterns, or large-scale interventions) may be needed in extraordinarily vulnerable regions such as islands. Dramatic policy change may also be called for where incremental safety measures encourage people to build and settle in ultimately dangerous locations. Additionally, if climate change becomes more severe than projected, or mitigation efforts fail, then transformative change might become necessary. Despite this, for many adaptation projects incremental change may be sufficient, efficient, and more politically feasible. For example, flood protection barriers can be built to be intentionally flexible and robust. Engineers can build temporary structures that are cheap to replace when more information becomes available. They can also build in mechanisms to tweak, expand, or reduce the barrier as researchers and planners
learn more about the severity and likelihood of flood risk. This flexibility also allows policy makers to respond to previously unrealized externalities associated with the chosen barrier method such as its impact on neighboring communities or ecosystems. This " fail-cheap" method may ultimately be more effective than pursuing expensive and drastic projects to protect against a large, but uncertain risk.
Technical and Local Knowledge
Good decision-making is obviously more complicated than simply determining the degree of change needed. Reflecting the planning ethos of his time, Lindblom operates under the assumption that policy is made by professionals using rational thought. Today, much of the planning literature criticizes this reliance on professional and scientific approaches in favor of local and community knowledge (Forester, 1988; Innes and Booher, 2004; Sandercock and Forsyth, 1992). Corburn (2003) finds that planners must negotiate demands from policy makers above them, technical experts, and a vocal public. While negotiation can be difficult, he argues, it is actually beneficial compared to a top-down approach. Specifically, local knowledge brings four distinct values: 1) it can provide key information expanding the overall knowledge base; 2) it creates more democratic decision-making systems and adds legitimacy to decisions; 3) it can improve effectiveness by helping to identify low-cost solutions and spreading the burden of implementation to involved community members; and 4) when done well, local involvement can identify distributive justice and social equity concerns. Despite this increasing acceptance of local knowledge, Krizek et al. (2009) point out that rational models continue to be favored when decisions are viewed as highly technical such as those regarding hydrology and transportation.
This debate about how to balance technical information with local knowledge to create informed evidence based decisions plays out heavily in climate adaption. The combination of
novelty, scientific complexity of projecting climate change, and the technical nature of the many systems that are vulnerable (power, transit, water), often creates a natural impulse to rely on more technical approaches. The guidelines around adaptation describe the adaptation process as based on "a rational decision-making" framework (Moser and Eckstrom, 2010, 22027). This rational process, however, does not preclude widespread and diverse community involvement. Rather, celebrated adaptation efforts acknowledge that information must both be bottom-up and top-down (Mastrandrea et al., 2010).
Climate Adaptation and Scale
With adaptation, an important policy question is what level of government should be responsible for which decisions. Adaptation planning looks different depending on the scale at which it is happening. Within the United States, federal and state governments have primarily facilitated, supported, and assisted with adaptation efforts. Most innovation and actual work has happened at the local level (Bierbaum et al., 2012; Rickards, et al., 2014). This is based on an argument that local governments know their community best and control many of the local resources that are at risk.
Recently many scholars are pushing back against the assumption that adaptation is a local issue. Rickards et al. (2014), argue that the decentralization of adaptation planning to the smallest scales necessitates a huge amount of learning by a large number of people, which may be inefficient. Even more, local level adaptation is not required by higher levels of government forcing local decision makers to prioritize it against a number of other pressing local concerns that can easily overshadow it. Baker, et al., (2012) argue that it is quite possible that the demands of adaptation planning exceed the capabilities of local governments. They point out that this lack of capacity extends beyond financial, information, political, and technical capacity, but has more to
do with a lack of clear responsibility or statutory obligation to address change. They argue that state and federal governments must clarify what adaptation looks like and create regulations that mandate which actors should be involved and how. Without this direction, only places with political will or champions for change will opt to participate. Additionally, state governments and federal governments own and control large tracts of land and therefore must also be involved in the application of adaptation efforts. Without all levels of government (and the private sector) working towards adaptation, each individual branch can only influence what is within their own jurisdiction (Bierbaum et al., 2012).
Information Barriers to Adaptation Planning
In California, I found that even those local planners widely regarded as leaders felt that they still had a long road ahead of them. They knew they were just scratching the surface of a complicated problem that would take a coordinated and expensive response. Scholarly works similarly describe the vast difficulties these individuals face. Moser and Ekstrom (2010) found that in every stage of adaptation efforts (spanning understanding risks, planning for risks, and implementation of potential solutions), many barriers exist. They categorized these barriers into three categories: 1) Leadership, finding that without top-down mandates for adaptation planning, "leaders are required to initiate the process" and may "vary in quality of guidance, motivation, and vision they provide" (22029); 2) Resources, finding that communities lack both financial means to support adaptation and technical/informational means to understand the risk; and 3) Values and beliefs, finding that people's belief in climate change or willingness to discount future risks in favor of current needs can be a significant barrier to progress. More recently, Bierbaum et al., (2012) conducted a comprehensive review of climate adaptation efforts by federal, tribal, state, local governments and the private sector and found that "barriers to implementation still impede
action in all sectors and across scales. The most significant barriers include lack of funding, policy and institutional constraints, and difficulty in anticipating climate change given the current state of information on change" (362).
Climate adaptation tools aim to break down the barriers that decision makers face. Cal-Adapt primarily speaks to the information barrier. It provides highly accessible and minimally technical downscaled climate data that aims to allow decision makers to better understand the likely changes their communities will face. It also seeks to help with funding gaps by providing this information free of charge. Tf used as part of a public education or public outreach process, Adapt may even help create the political will for climate adaptation. Despite these values, Cal-Adapt can only do so much. The tool is limited. It cannot fill in for overworked staff. It cannot make up for overstretched budgets. It certainly cannot overcome institutional constraints regarding who has jurisdiction to affect what change.
Barriers to Using Climate Projection Tools
As mentioned earlier, nearly all climate adaptation guidelines recommend beginning with an analysis of how the climate is expected to change and what that means for the community or system (Filssel and Klein, 2006; Kelly and Adger, 2000; Weaver et al., 2013). Without educated forecasts about what the future risks are, planning for risks is impossible. Rickards et al., (2014) point out that national and state level governments see it as their role to provide information regarding climate risks in order to address the gap between what municipal governments are expected to do and their limited resources. Cal-Adapt is an example of this drive to provide information.
Recently, scholars have begun to look critically at the "usability" of these future climate projections. Weaver et al., (2013) found that, despite their importance, there is "a severe
underutilization of climate models as tools to support decision-making" (40). From the literature, it is clear that there are two main reasons why this might be the case: 1) Substantive issues in which the projections are inherently fraught with uncertainty or cannot provide the specificity necessary for robust decision-making; and 2) usability issues in which decision makers lack the capacity or knowledge to put the projections to productive use.
Substantive Issues
Unfortunately, the substantive issues are numerous and unlikely to be resolved by the time action must be taken (Stainforth et. al, 2007). Inherent in current climate data is significant uncertainty about what to expect in the future due to the high numbers of assumptions that feed into projections and models (Hayhoe et al., 2013). Moreover, there are many unknowns about how society will react in coming years (Weaver et al., 2013). Additionally, the scale at which information is produced often does not match the scale at which decision makers must operate. For example, in a study on climate adaptation and water utility planning Barsugli et al. (2012) writes:
One of the major concerns water utilities have had with climate model output is the coarse resolution from the models. Climate models typically divide the world into grid cells or grid boxes that are 100 to 200 kilometers wide; this resolution is too coarse to account for local climate conditions. This necessitates the use of a downscaling method to translate the GCM output to a finer scale. Downscaling introduces additional complexity and uncertainty to the process, and the implications of the choice of downscaling method-the use of various statistical methods or the choice of a regional climate model (RCM)-are not always clear. (390)
This huge level of uncertainty should leave any well-versed decision maker questioning how much they can rely on these models to inform the choices they make. Cal-Adapt is a model that downscales climate information to a 12 by 12 kilometer grid. Downscaling to a higher resolution may make data appear more usable to planners working on a similarly small scale, but it also introduces more uncertainty. Even though the developers of the site at Cal-Adapt are proud of the
scientific rigor that went into their downscaling method, they will readily admit that the data are surrounded by uncertainty (Guido, 2014).
To make matters more complicated, Enserink et al. (2013) find that policy advocates and scientists have different perceptions of both uncertainty and the goals of climate scenarios that complicate how the two groups react to data. As they write, decision makers' "perception of uncertainty is often static and rather crude. Uncertainty is something that makes decision-making difficult, and therefore it is in their interest to see it reduced to probabilities and cost benefit ratios" (10). In contrast, scientists are not driven by the same policy pressures and often have a deeper understanding of uncertainty. Additionally, scientists producing "scenarios value them primarily as learning processes" (9) that can show how systems respond to various inputs. In other words, while decision makers typically rely on the outputs of models to form policy objectives, data-producers use the inputs to determine what might be driving changes. Therefore, the applicability of the data to each of these tasks may be very different.
Usability Issues
The substantive issues with climate data cannot all be solved. Uncertainty will continue to exist in efforts to forecast the future in complex systems. Encouragingly, researchers are finding that there are clear ways to move forward with adaptation models that factor in uncertainty. For example, Hallegatte (2009) argues that in the face of uncertainty, decisions should not be based on optimizing climate models, but by simply making decisions more "robust" to changing climatic conditions given the existing information In other words, projections such as Cal-Adapt should not be used to determine thresholds such as the exact temperature or precipitation that a building should withstand. Instead, the models yield important information about the potential range of
likely conditions. A building should be designed to succeed at all points within that range or across the various scenarios regarding future conditions.
If climate adaptation is possible using uncertain models, what does it take to get decision makers to actually make the hard decisions? Scholars increasingly recognize that the barriers preventing the applicability of climate data go beyond these issues of uncertainty. Weaver et al. (2013) point out that this takes knowing how much information decision makers need and how to package it in a way they can digest; not an easy task. Moser and Luers (2008) found that unless climate information fits seamlessly into existing procedures, planners are reluctant to use it. This is especially true if there is no mandate to do this extra work.
Cash et al. (2006), analyzing El Nino/Southern Oscillation forecasting, note that science and technology will only be used by stakeholders if it seen as "not only scientifically credible, but also salient and legitimate" (468). By this they mean that decision makers will only use data if they believe that it is relevant to the problem they are trying to solve and if they can defend their choice to use the information.
While salience and legitimacy are clearly important, usability is more complex. Users must also know how to access the data and have the capacity to use it. Likewise, local planners must feel that climate adaptation is worth their time. In Chapter 3 I will look at Cal-Adapt using a more nuanced framework that will touch on each of these issues.
Co-Production of Climate Science
A number of scholars contend that the key to delivering "usable" scientific information that is meaningful to decision makers is the process by which it is produced. (Cash et al., 2006; Dilling and Lemos, 2011; Jasanoff, 2004; Tribbia and Moser, 2008). If decision makers work with scientists to determine which scenarios to use to project future risks, which variables to downscale,
and how to present that information, the final result will be more effective. It certainly seems that if climate modelers and decision makers worked more closely together, then misunderstandings of what data is needed, and the potential misuses of uncertain data could be avoided.
While this deep understanding of knowledge is certainly desirable, it is not a quick or easy process. Specifically, Dilling and Lemos (2011) recommend that it involve a series of iterations to truly lead to robust decision-making processes and added value:
First, iteration allows for better customization of knowledge to meet specific needs. Second, through iteration producers and users may uncover new uses for climate knowledge that might not have been identified before. And while many constraints and opportunities for knowledge use may be beyond the control of the science production enterprise, a better understanding of users' decision context may critically influence the ability of producers to meet users' expectation of climate knowledge as decision support information." (684)
In other words, co-produced information that is generated iteratively will not only better align research to what is needed by users, but can also push the field forward in potentially innovative ways. Importantly, participatory scenario planning for climate adaptation achieves more than improvement in the quality and resonance of the final product; it allows for participants, who are often novices in climate science, to gain expertise through the exercise of thinking through the various scenarios and data. This gradual learning process is particularly important given the complexities and potential misapplication of modeled data. (Chermack, 2004; Rickards et al., 2014; Van Drunen et al., 2011).
However, not every decision maker has access to scientists with the skillsets to create customizable climate data for their needs (Dilling and Lemos, 2011). Even more, scientists are often driven by the need to get published in peer-reviewed journals that have little use to decision makers and may not see value in entering drawn-out participatory processes (Archie et al., 2014). Finally, Aron et al. (2001) point out that the co-production of science for policy runs the risk of choosing inputs for pragmatic reasons or to create consensus, rather than more scientifically
defensible reasons. Given this, how can sustained, productive, and academically rigorous relationships between users and producers be created?
Clark et al. (2010) suggest that the solution lies in facilitating this interaction through a third party. This will prevent the boundary between scientists and policymakers from being dissolved completely and reduce the risk that science will be overly politicized or that policy makers will over-rationalize decisions. They label this third-party facilitation "boundary-work." Tribbia and Moser (2008) also call for third party "boundary organizations" that can enable "scientists and decision makers to increase mutual understanding of capacities and needs while remaining within their professional boundaries" (317). Dilling and Lemos echo this conclusion, writing that "information brokers" who are literate in both science and policy are key. Yet identifying information brokers may not always be easy. They write, "one of the key challenges to producing usable science may therefore be to determine who or what organization needs to take on the process of connecting science to decision-making" (685). Practically speaking this void continues to be pervasive in many local decision-making contexts. Sometimes consultants or university connections can fill this gap by serving as technical mediators between the decision makers and the data producers.
In my interviews I found that locations that have successfully integrated Cal-Adapt into their adaptation planning, for example Santa Cruz and Santa Barbara, drew on local experts through the university system. However, not every town has the capacity to form these necessary partnerships. If information brokers who are fluent in both science and policy are necessary, what can California do to fill this void?
How This Thesis Adds to the Literature
In their comprehensive review of adaptation, Bierbaum et al. (2012) specifically comment that more research needs to be done on delivering usable climate change information. They write 'research should address the types of information that need to be made available, as well as the methods for transmitting such information in a way that can best support understanding of climate change risks and opportunities and facilitate decision-making" (394). This thesis cannot break down all of the barriers that local governments face. It cannot answer who should be doing climate change work or how they should be doing it. However, it can discuss issues and best practices for transmitting climate information. Cal-Adapt was expensive to build and will be costly to maintain if the state continues to utilize and update it. Looking at it critically will allow the state to better understand what is working well about the tool and what is not working. Additionally, by comparing it to similar tools, I can assess if it is following best practices in tool development as they emerge.
Chapter 3: The Usability Of Cal-Adapt
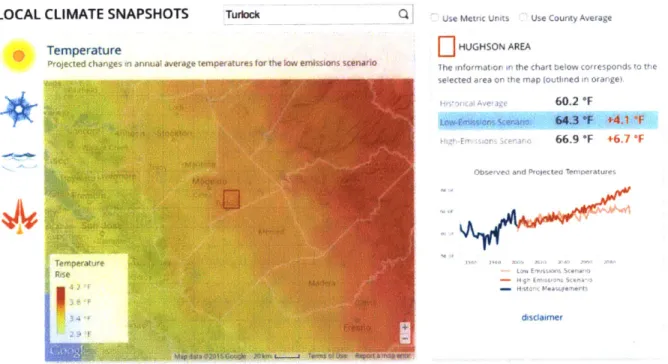
A StoryOn February 14, 2014 President Obama landed in Fresno, California and pledged $183 million in federal funds for drought relief efforts in California. Karla4, a volunteer city planner in a smaller city in the Central Valley had seen the impacts of the drought-fallow fields, signs along the highway warning residents to save water, cracked earth. Raised by conservative parents in a conservative town, Karla knew that climate change policy would be an uphill battle. Despite this, she watched the President's press conference because it was a rare occurrence for the Central Valley to have such important visitors. She heard the President not only promise drought support, but also argue that the drought is a reflection of climate change. He said:
We have to be clear: A changing climate means that weather-related disasters like droughts, wildfires, storms, floods are potentially going to be costlier and they're going to be harsher. Droughts have obviously been a part of life out here in the West since before any of us were around and water politics in California have always been complicated, but scientific evidence shows that a changing climate is going to make them more intense. Scientists will debate whether a particular storm or drought reflects patterns of climate change. But one thing that is undeniable is that changing temperatures influence drought. (Obama, 2014) Many of Karla's friends and neighbors were skeptical of climate change and she knew they would easily dismiss the President's claims. But more recently, Karla was starting to agree with arguments that climate change is a real concern. On some level, the President's words made sense. That night, she got on the Internet to better understand what climate change would mean for her family and hometown of Turlock.