Publisher’s version / Version de l'éditeur:
Vous avez des questions? Nous pouvons vous aider. Pour communiquer directement avec un auteur, consultez la première page de la revue dans laquelle son article a été publié afin de trouver ses coordonnées. Si vous n’arrivez pas à les repérer, communiquez avec nous à PublicationsArchive-ArchivesPublications@nrc-cnrc.gc.ca.
Questions? Contact the NRC Publications Archive team at
PublicationsArchive-ArchivesPublications@nrc-cnrc.gc.ca. If you wish to email the authors directly, please see the first page of the publication for their contact information.
https://publications-cnrc.canada.ca/fra/droits
L’accès à ce site Web et l’utilisation de son contenu sont assujettis aux conditions présentées dans le site LISEZ CES CONDITIONS ATTENTIVEMENT AVANT D’UTILISER CE SITE WEB.
Laboratory Memorandum (National Research Council of Canada. Institute for
Marine Dynamics); no. LM-1991-27, 1991
READ THESE TERMS AND CONDITIONS CAREFULLY BEFORE USING THIS WEBSITE.
https://nrc-publications.canada.ca/eng/copyright
NRC Publications Archive Record / Notice des Archives des publications du CNRC :
https://nrc-publications.canada.ca/eng/view/object/?id=6ccbe1a0-7ac4-4a67-bd9d-e1d88ac9b11f
https://publications-cnrc.canada.ca/fra/voir/objet/?id=6ccbe1a0-7ac4-4a67-bd9d-e1d88ac9b11f
NRC Publications Archive
Archives des publications du CNRC
For the publisher’s version, please access the DOI link below./ Pour consulter la version de l’éditeur, utilisez le lien DOI ci-dessous.
https://doi.org/10.4224/8896037
Access and use of this website and the material on it are subject to the Terms and Conditions set forth at
A continued study of the frictional and cohesive-like behavior of
floating model ice rubble
National Research Council Canada Institute for Ocean Technology Conseil national de recherches Canada Institut des technologies oc ´eaniques
Laboratory Memorandum
LM-1991-27
A Continued Study of the Frictional and Cohesive-Like
Behavior of Floating Model Ice Rubble
P. C. Case
December 1991
Case, P. C., 1991. A Continued Study of the Frictional and Cohesive-Like Behavior
of Floating Model Ice Rubble. St. John's, NL : NRC Institute for Marine Dynamics,
LM-1991-27.
u
i j
u
A Continued Study of the Frictional and Cohesive-Like
Behaviour of
Floating Model Ice Rubble
U
LM-1991-27
I 1 Peter C. Case
DOCUMENTATION PAGE
REPORT NUMBERLM-1991-27 NRC REPORT NUMBER DATEDecember 1991
REPORT SECURITY CLASSIFICATION Unclassified
DISTRIBUTION Unlimited TITLE
A CONTINUED STUDY OF THE FRICTIONAL AND COHESIVE-LIKE BEHAVIOUR OF
FLOATING MODEL ICE RUBBER AUTHOR(S)
P.C. Case
CORPORATE AUTHOR(S)/PERFORMING AGENCY(S) Institute for Marine Dynamics
National Research Council Canada PUBLICATION
SPONSORING AGENCY(S) Institute for Marine Dynamics National Research Council Canada IMD PROJECT NUMBER
292 NRC FILE NUMBER
KEY WORDS:
ice rubble, shear test, angle of internal friction, cohesive bonding, Mohr-Coulomb Law
PAGES vii, 25, Apps. A-l FIGS. 6 TABLES SUMMARY:
Ice rubble is treated as a Mohr-Coulomb material and tested with a direct shear test apparatus to determine its strength parameters and behaviour.
ADDRESS: National Research Council Institute for Marine Dynamics P. O. Box 12093, Station'A' St. John's, NF
A1B3T5
I j LM-1991-27 iii
w
SUMMARY
J
An apparatus developed in March 1991 was altered and improved upon
^
in order to test floating model ice rubble by the direct shear
method. This apparatus enabled the strength parameters of model | ice rubble to be determined by treating it as a Mohr-Coulomb W material described by:
I | Tf = c + atan 0
Previous studies have been performed with results for cohesion (c)
of 0 to 4.1 kPa and for the internal angle of friction (0) ranging from 11° to 65°. It is here suggested that freeze-bonding and ice
W
piece breaking contribute solely to cohesive-like behaviour, while
interlocking and friction are major determinants of the friction
; angle.
The shear box is capable of handling a 700 x 600 x 500mm sample of
\j
ice rubble. The control and service carriages linked together were
utilized to shear the samples at lmm/sec.
i (
y The rubble samples were formed from a 30mm ice sheet and averaged field depths of 40cm. The results show that ice rubble does behave i | according to the Mohr-Coulomb criterion at low normal pressures.
The strength of the parental ice sheets decrease with increasing
j [.
warm-up hours.
Ice rubble behaviour was shown to behave similarly.
W
As such c and 0 were determined for four definite warm-up hour
divisions. This showed cohesive bonding to increase with warm-up | ; hours while the friction angle decreased. Values ranged from 0.52
U
to 0.82 kPa for cohesive bonding and from 48.9° down to 27.2° for
the angle of internal friction. This range over time also represents the dependence of rubble behaviour on temperature. The load exerted on the walls of the shear box increased with confining pressure. As well, the amount of strain to failure increased with the confining pressure.
I j LM-1991-27 iv
Aeknovledgeaients
|
I would like to extend thanks to the following people for their
^ suggestions and comments in altering, adjusting, and implementing the ice rubble shear box, as well as any assistance, directly or indirectly, with the compilation of this report:
w
John Bell
I Spence Butt
<■ Brian Hill F. M. Williams
1 !
All help and assistance were greatly appreciated.
j
j I
U
) I
j j LM-1991-27 V Table of Contentsjj
SUMMARY
iii
Acknowledgements iv w Table of Contents v| List of Figures vii
1.0 Introduction 1
!
2.0 Purpose
2
3.0 Previous Studies 3
^ 4.0 Understanding Ioe Rubble Behaviour 4
4.1 Angle of Internal Friction 4
4.1.1 Angle of Friction and Previous Studies ... 8
U
4.2 Cohesion .
8
^ 4.3 Mohr Failure Envelope and Mohr-Coulomb Failure Law . 10 j
j 5.0 Ice Rubble Shear Apparatus 11
- 5.1 Alterations and Additions 11
5.2 Performance of Apparatus 13
jj
6.0 Procedure •
13
7.0 Test Conditions and Description 14
1 ;
- 8.0 Parental Ice Sheet Properties 15
U
9.0 Discussion
16
9.1 Results 16 9.2 Observations 19 i !v
10.0 Conclusions
21
j I
11.0 Recommendations
22
7 REFERENCES 23J
APPENDICES
25
Appendix A Summary of reported c and 0 values
w
Appendix B
Original Apparatus—Photographs
! !
Appendix C
Altered and Improved Shear Apparatus
u
Appendix D Testing Procedure for Floating Ice Rubble i r
LM-1991-27 vi
Appendix f Parental Ice Sheet Properties Appendix E Ice Sheet Summaries
Appendix f Parental Ice Sheet I
Appendix G Sample Graphical and Statistical Output Vv
Appendix H Tabulated Results and Sample Calculation
U
Appendix I
Graphical Results (5 Graphs)
U
u
W \rJLJ
<J
LM-1991-27 vii List of FiguresFigure 4.1 Degrees of interlocking for different shaped
particles 5
w
Figure 4.2 Interlocking of ice pieces subject to a confining
j / pressure 6
Figure 4.3 Effect of particle size on interlocking 7
i
Figure 4.4
Mohr's failure envelope and Mohr-Coulomb failure
^
law
9
j Figure 4.5 Extended Mohrfs failure envelope with Mohr-Coulomb
iji
approximations
10
I Figure 9.1 Developing gap in ice rubble 20
^ LM-1991-27 1 1.0 Introduction
j
Ice rubble can take the form of pressure ridges, ice pile-ups, ice jams, and rubble fields. Rubble fields are large accumulations of
w
fractured ice that form from ice sheets or floes moving around
; I structures, islands or other obstructions.
Ice rubble fields can exist as a floating or a grounded mass.
^ Grounded rubble, once formed, can exist for months. Floating
rubble normally does not stay together for more than a week, being susceptible to currents, wave motion, and changing wind conditions.
I | Ice rubble behaviour is largely unknown. Its properties vary
- depending on ice piece thickness, shearing rate, temperature, confining pressure, as well as the properties of the parental ice \J sheet. It is generally accepted, at present, that ice rubble
behaves as a Mohr-Coulomb material, obeying the equation:
\ i
w
Tf = c + a tan <p — (1) where, c = cohesion
<f> = angle of internal friction
^
rf = shear stress at failure
a = normal stress at failure
i f. w
Determining the behaviour of ice rubble is important for i understanding its interaction with manmade structures and islands.
Ice rubble can have damaging effects on structures ranging from
I ride up to overtopping, and from structural failure to pushing a
X^
structure from its foundations. Failure of the seabed can occur in
: x> situations where the ice rubble becomes grounded.
\J
This report will focus on interpreting the results of floating ^j model ice rubble shear tests performed in the refrigeration basin at the Institute for Marine Dynamics. The properties of parental
! /
ice sheets will be provided and related to the rubble properties
where possible.
] ;
u
} j LM-1991-27 2
2.0 Purpose
| |
w
The three main objectives of this report are as follows:
w - To discuss ice rubble as a Mohr-Coulomb material and address its geometry and the strength parameters, namely angle of
ij,
internal friction and cohesive bonding, and relate them to
ice rubble.
•W
■
'
■
'
■
' ■
- To discuss parental ice sheet properties and attempt to | ! relate them to ice rubble properties.
w
i - To further verify if floating ice rubble behaves as a
Mohr-U
Coulomb material.
If so, the angle of internal friction and
cohesive bonding effect will be determined.
w
j j
LM-1991-27 3
3.0 Previous Studies
Appendix A summarizes the results of several studies on modelled
ice rubble. Values for cohesion ranged from 0 kPa to 45 kPa and
W values for the internal angle of friction varied between 11° and
65°. These studies have been performed under a variety of
\Jj
conditions resulting in highly scattered results.
Ice rubble was
tested as either a floating or grounded mass. The ice itself was either fresh, saline, modelled as plastic blocks, or other form of
^
model ice (EG/AD/S, Urea).
Some experiments involved using
I preshaped ice pieces, while others used randomly broken ice pieces.
^
The apparatuses varied in design and testing procedures. With this
I variety of conditions, the large ranges in values can be expected. Although testing procedures and set-ups were varied, most results ^ are indicative of ice rubble behaving as a Mohr-Coulomb material.
The reader is invited to review an earlier report by the author
! (Case, 1991) . In it the concept of a Mohr-Coulomb material is
discussed, and the findings agree that ice rubble does behave in this fashion. Appendix A does not contain reported values for <f>
^
and c for the set of experiments.
Case reports values
non-{ dimensionalized against the shear strength of the parental ice W sheet. These indexed values cannot be compared to values of <p and
c obtained from earlier experiments. j ; •
Observations have been made during earlier studies that are worth noting. It was Prodanovic (1978) who did the first comprehensive study into the properties of rubble ice. Weiss, Prodanovic, and
| j Wood (1981) continued the study and noted that the apparent
^
cohesion is proportional to the ice rubble piece thickness.
A
study by Hellman (1984) identified three phases in the shearing w process. The first phase is associated with a sharp load increase due to the denser packing of ice particles. In the second phase
-J the normal force increases with the shear force until both reach a peak. This rise is not as rapid as in the first phase. The final
u
\ f\ LM-1991-27 4
W
phase represents continuous shearing of the rubble sample after the
I !
peak shear force is attained.
Urroz and Ettema (1987) concluded that shear strength of failure W increased with ice rubble thickness. Later, Ettema and
Urroz-Aguirre (1991) suggested that a Mohr-Coulomb failure criterion may
[Jj
not be adequate to describe the behaviour of ice rubble.
They
believed it did not take into account the effects of shear strength ij of either deformation and breaking of ice pieces or freeze bonding
between ice pieces. \ I
w
4.0 Understanding Ice Rubble Behaviour
There are many factors which determine how ice rubble behaves when
y acted upon by shearing forces. Ice piece size and shape, ice
rubble porosity, confining pressure, shear rates, particle
I
roughness, and presence of water are all believed to effect the
strength parameters of ice rubble. This section discusses the angle of friction and cohesive bonding and how they are affected by
^
these and other factors.
U 4.1 Angle of Internal Friction
The shearing force required to overcome the effect of the internal angle of friction can be expressed as:
■ I
S^ = Shearing force related to angle of friction
li = FN + Ffr + F*
where, FN = force necessary to induce sliding = /x^W Ffr = force necessary to overcome friction =
w
Ffo = force required to overcome interlocking
/xf = static coefficient of friction U pk = kinetic coefficient of friction
N = normal/confining pressure \ j
LM-1991-27 5 The first term, FN, is related to the force required to induce or impart motion between contacting ice pieces. This can be considered as a static friction component. The second term, Ffr, is another friction term related to the force required to maintain motion between ice pieces. This is the kinetic friction component. Both these terms are primarily dependent on the surface geometry of pieces and the confining pressure.
Subrounded/SubonguIQr
Figure 4.1
particles.
Degrees of interlocking for different shaped
\J The final term, F^, is related to the interlocking of ice pieces.
The shape of the ice pieces is of major consequence within this term. Angular ice shapes interlock with each other better than rounded pieces as can be visualized in figure 4.1. Rounded pieces introduce an additional rolling effect.
u
The ability of an ice piece to overcome interlocking is dependent on the confining pressure, N. As can be seen in figure 4.2 the piece fAf or fBf has to shift the distance fh' vertically. At low confining pressures the ice pieces have the ability to do this quite easily. As the confining pressure increases, the effort required to displace the ice pieces this distance is also
11.
u \ f w w w y LM-1991-27 w1
h
t
mfiNBG max. n
Ijllllllll
4i
\ >^^ >^^ f.^^i
[MMMMt
COMBINING PRESSLRE, N
//
/
^ShEARFCRCE
^— SHEAR PLANE
Figure 4.2 Interlocking of ice pieces subject to a confining pressure.
U
xj
Locally, the interlocking is also dependent on ice piece size. Assume the two samples of figure 4.3 are confined by the same pressure. The sample in (a) has to overcome an interlock of hlr whereas the sample in (b) has to overcome an interlock h2/ which is considerably larger. A larger shearing force is thus required in
(b) to shift the ice piece the extra (h2 - hx) .
LM-1991-27
Figure 4.3
interlocking.
Effect of particle size on
u
It can be seen that larger ice pieces result in greater amounts of interlocking than for smaller ice pieces subject to equivalent confining pressures. This is only valid on the local scale. For two samples of the same dimension, more ice pieces and more interlocking occurs in one with smaller particle sizes. Overall, interlocking nor <f> are greatly affected by particle size.
Other factors which affect the angle of friction are void ratio/porosity, ice piece size distribution, and water. These factors are intrinsic in the previously discussed terms. To begin with, the greater the amount of packing a rubble sample is subjected to, the lower the void ratio and porosity. This causes increased amount of interlocking and ice piece contact (friction related), causing a larger angle of friction. Secondly, a good ice piece size distribution will ultimately increase 0. With a good distribution the voids between the larger ice pieces become filled with the smaller pieces. This reduces the void ratio and porosity. The presence of water has little affect on the angle of friction.
u
f
LM-1991-27
8
4.1.1 Angle of Friction and Previous Studies 1 i
Keinonen and Nyman (1978), Prodanovic (1979), Hellman (1984), and
\ \ Urroz and Ettema (1987) reported values of 0 exceeding 45°. Ettema
^
and Urroz-Aguirre (1991) suggested that such values are large as
compared to other geotechnical materials, such as sands and
\J! gravels. However, such values are not unrealistic. Holtz and
Kovacs (1981) report values for granular, well-graded crushed rock i f
of up to 60°. Bowles (1988) reports values of 55° for medium size
gravels. Therefore values up to 60° are not unlikely for ice
I rubble. On the contrary, low values for the angle of friction are less likely. Low values of <f> are normally related to fine grained materials which exhibit a large cohesive component, such as clays ^ and silts. Both Bowles (1988) and Holtz and Kovacs (1981) list
values not less than 25° for sands and gravels. 4.2 Cohesion
j i
w
Ettema and Urroz-Aguirre (1991) recommended that a term more ■ accurately describing freeze-bonding and ice piece deformation should replace the term cohesion when describing ice rubble. In agreement with this cohesive bonding will be assigned to the w variable c as it relates to ice rubble.
Lj
The shearing force required to overcome the effect of cohesive
bonding can be expressed as:
Sc = Shearing force related to cohesive-like behaviour
I - Ftt + Fb
u
' ju
where, Ff4, = force necessary to overcome freeze-bonding Fb = force necessary to bend, break, or shear
LM-1991-27 9 Both terms, FfJb and Fb, are related to forms of bonding. These bonds must be broken before failure can occur. The freeze-bonding component begins forming immediately upon rubble formation. The older the rubble field, the greater the degree of consolidation and freeze-bonding.
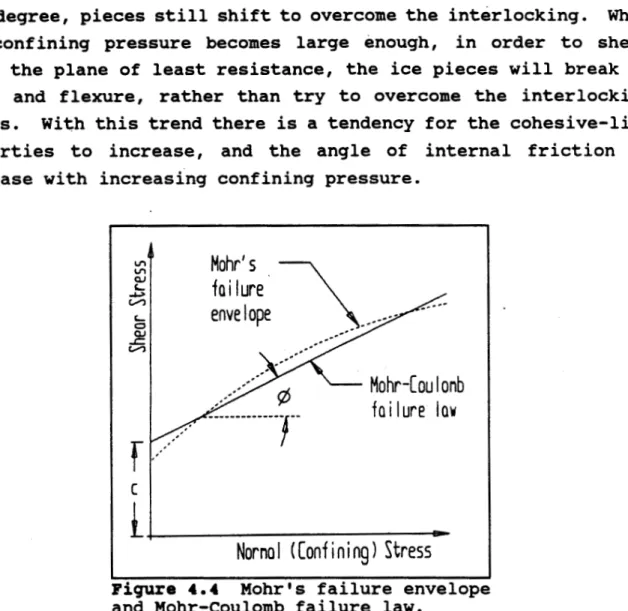
The term Fb is not significant at low confining pressures. At low pressures, the pieces tend to move around each other to overcome interlocking and induce failure. Within the rubble, there is a small amount of breaking about the piece edges caused by grinding. As the confining pressure increases, additional grinding occurs. To a degree, pieces still shift to overcome the interlocking. When the confining pressure becomes large enough, in order to shear along the plane of least resistance, the ice pieces will break in shear and flexure, rather than try to overcome the interlocking forces. With this trend there is a tendency for the cohesive-like properties to increase, and the angle of internal friction to decrease with increasing confining pressure.
u QJ 4>
r
cL
Hohr's
failure
envelope
Mohr-Coulonb
foilure law
Nornol (Confining) Stress
Figure 4.4 Mohr's failure envelope and Mohr-Coulomb failure law.
LM-1991-27
4.3 Mohr Failure Envelope and Mohr-Coulomb Failure Law
10
The Mohr-Coulomb failure law is a straight line approximation to
the Mohr failure envelope as can be seen in figure 4.4.
This approximation is only valid within a certain normal pressure range, depending on the material involved. If the Mohr failure envelope were extended to higher values, the Mohr-Coulomb approximation would become more inappropriate, as illustrated in figure 4.5.
Mohr's Failure
Envelope
ioh Nornol Stress
Nornol (Confining) Stress
Figure 4.5 Extended Mohr's failure envelope with
Mohr-Coulomb approximations.
w
Line 1 is a good approximation for the low pressure range resulting in a cohesive intercept cx and a friction angle of <px. Line 2 is the approximation for a wide normal pressure range. As can be seen, an amount of accuracy is lost in this approximation. Line 3 is a good approximation for the range of high normal stress resulting in a significantly larger cohesive intercept c3 and lower
] f LM-1991-27 11
u
friction angle <£3. From this it can quite clearly be seen how the
| | pressure range can significantly alter the result of ice rubble
w
shearing. Note that the cohesive intercept is best obtained at low
] normal pressures.
Sayed (1987) performed ice rubble experiments at high confining
Us
pressures (35 kPa) and his results showed large values for the
cohesive intercept (10-20 kPa). This agrees with the previous
I
discussion.
As a result, the trend for c to increase with
increasing normal pressure and <p to decrease is not "curious11 as
j stated by Ettema and Urroz-Aguirre (1991).
5.0 Ice Rubble Shear Apparatus
The ice rubble shear box is designed to shear floating, unconfmed ice rubble. It has been used previously during April 1991 by the author. The reader is referred to a previous report (Case, 1991) which describes the apparatus in detaxl.
The apparatus is capable of handling an ice rubble sample 700 x 600 x 500mm deep. Its design is based on the direct shear method. This testing method was chosen after careful consideration of other possible methods (Case, 1991).
An isometric drawing and photograph of the original apparatus is shown in Appendix B.
5.1 Alterations and Additions
The original shear apparatus had problems in its operation. In order to overcome these problems alterations were made. These alterations and additions to the shear box are discussed below. Appendix C shows the set-up and the altered apparatus.
\ LM-1991-27 12 The ice rubble depth originally was difficult to obtain. To ! overcome this problem a plexiglass window was installed into the box. Depth markings on this window were read by a submersible I video camera. Markings were also placed on the apparatus to — measure the height of the rubble sail. As well, distance markings and a displacement transducer for recording the movement of the
U
confining plate were also installed on the box.
The confining
plate, once in place, had its position recorded and the transducer \ Iy zeroed at this position. All movement thereafter could be
recorded. I i
The box during previous tests (April 1991) jammed in places, especially during the later stages of testing. This was attributed
^
to slight deformations caused by the shear force and swelling of
the wooden members. To correct these difficulties the apparatus Lj was disassembled and adjustments made during reassembly.
Additional epoxy resin coatings were applied to the apparatus to
'
reduce moisture entering and swelling the wood.
Where ice
contacted the apparatus, the sides were carefully smoothed to i reduce friction.
\ The confining pressure was originally applied to the rubble using ^ a lever arm system (see appendix B). With this system a movement in the rubble and lever would change the moment arm length and
I 1
\Ji hence the applied pressure. In addition, the confining plate was
able to shift more on one side than the others if the rubble
condition so warranted. This was undesirable. To overcome this, the lever arm system was abandoned and substituted with a system of sprockets and chains. By maintaining the same length of chains on both left and right, top and bottom of the box, the twisting of the confining plate would be eliminated, as would be the problem of a
^J
changing confining pressure.
To further ensure this action, the
dovetail slider was stiffened by the addition of a I11 x 1" x 1/4"
u
i \i
LM-1991-27 13
Finally, two load cells were installed into the wall of the movable
j
shearing part of the apparatus.
This enabled measurement of the
w
pressure exerted on the sides of the apparatus before actual
shearing commenced. These loads would indicate the hydrostatic
^
pressure within the rubble field.
These values could, however, be
greatly affected depending on the amount of consolidation that has
[j
occurred in the sample.
5.2 Performance of Apparatus
; All alterations to the shear box proved effective. However, after
w
the first day of testing (Squish4) several minor problems evolved.
To begin with, the underwater camera became dysfunctional on the
U second test day (Sguish5) . The depth was thereafter recorded using
an extendable inspection mirror, and the readings read from the
i ! '
^j plexiglass window.
/
Secondly, the friction in the shear box increased significantly
w
from day to day. This can be attributed to swelling of the wood or twisting in the box. Silicon grease was applied to all contact
^
positions to keep the friction low.
U
All other additions to the shear apparatus performed without
problems. The system of chains and sprockets worked well, with
Jj
friction remaining relatively low and stable.
\ !
w
6.0 Procedure
| \
^
Appendix D contains a step by step procedure for the installation
and methods for performing the shear tests of model ice rubble in
Lj
the ice tank at the Institute for Marine Dynamics branch of the
National Research Council.
1 I LM-1991-27 14 7.0 Test Conditions and Description
! I
w
The ice was formed at -20°C and the tank room warmed-up to +2°c at
testing time. Complete ice sheet summaries are provided in
U
Appendix E. EG/AD/S (Ethylene Glycol/Aliphatic Detergent/ Sucrose)
model ice of proportions (0.39/0.036/0.04)% was used for testing.
Tests were performed on six days using 30mm,
0.937Mg/m3 ice
! I consistently each test day. Ice rubble fields ranged from 30 to
50cm thickness, being formed using the service carriage. The ice i / piece size ranged from 1 to 8 times with an average of 3.0 to 3.2
w
times the parental ice sheet thickness.
This is consistent with
\ size distributions recorded by Keinonen and Nyman (1978) and Case
U (1991).
^j The shear force performed at a rate of lmm/sec, was measured using a 2 klb load cell, and was controlled by the control carriage. Friction tests were run regularly on all sliding parts.
Hydrostatic pressure measurements were made on top and bottom of
^
the box.
Two 50 lb push button load cells were used for this
purpose. The displacement transducer was extendable to a maximum
U
of 50 inches.
| A video record was taken underwater for the first test day (Squish4). For tests Squish6 through Squish9 an above water video
[ recorded the shear process.
j The ice rubble was sheared through a distance of 240mm or 40% of
^
the original shear box width. This was done to ensure a peak load
was achieved. Constant confining pressure was maintained during
LJ
w
U
\ [
LM-1991-27
8.0 Parental Ice Sheet Properties
15
LJ
Five properties of 30mm ice sheets are presented here. These
properties are obtained from data recorded from previous ice sheets with similar properties. These include: flexural strength; shear strength (punch); compressive strength; elastic modulus; and density.
It has been accepted at present that the flexural strength, shear strength, and compressive strength versus warm-up hours plots are best described by a natural logarithmic function. The elastic modulus versus warm-up hours also appears to be described by such a function. The density, as would be expected, is essentially a constant value. These functions can be visualized in Appendix F. The function describing each property are as follows:
Graph Name # Data pts. Function Correlation (r)
LJ In Flexural Str. 147 vs warm-up hrs In Shear Str. 62 vs warm-up hrs In Comp. vs 65 warm-up hrs In Elas modulus 54 vs warm-up hrs Density vs 54 warm-up hrs Flex - 181. Shear « 152.9eJ°-2371 Comp. ■ 377
Elas. = 305.8ek-O.327t
0.871 0.658 0.733 0.879 Dens. = 0.927 + 0.0019xt 0.807
u
j LM-1991-27 16 9.0 Discussion
I I
w
9.1 Results
^-J Appendix G provides the graphical and statistical output for one
run of the 32 runs over the six days. Only one is included so as
\J
to limit the quantity that would be involved in presenting all
data.
H
■
■
The area used in calculating both shear and normal stresses was
corrected for the amount of strain incurred in the sample. The
w
width of the shear plane decreased linearly at a rate of lmm/sec.
The plane depth was considered to increase linearly from its \J initial to its final thickness. The shear load values are felt to be representative of changing rubble behaviour throughout the shear
[J test, and hence the area at failure was used.
|
The point at which initial failure occurred was taken as the shear
load. This point was not always apparent on the shear load versus time graph. If the confining plate moved in quickly and by a
>uJ significant amount, the peak shear value before this occurrence,
with frictional effects considered, was used as the peak load.
U This occurrence was often accompanied by a sharp drop and rise in
the shear load. In one test this occurred early in the run and was
m hence overlooked.
i In the situation where two relative peak values occurred, the video
w
recording was used to determine where the initial shear plane formed. Generally, this was at the first peak. The second peak
u
occurred as a result of recompression of the ice rubble and
development of another shear plane. s-i
Appendix H contains the tabulated test results and calculated
lj
values. A sample calculation of the rubble depth and width at peak
load, shear area, and normal and shear stresses is included.
i i
I LM-1991-27 17
u
Five graphs have been plotted using the data presented in Appendix
I [
H.
These graphs,
shown
in Appendix I,
are
significant
in
understanding the behaviour of ice rubble. All graphs are least
[ squares straight line approximations.
U
The shear stress versus normal stress graph shows a relatively
U
strong relationship.
This graph is a plot of all thirty-two shear
and normal stress results taken over the six testing days. These j plots show the Mohr-Coulomb failure criterion is applicable to ice
rubble. The equation of the plotted line is:
i '
W
t = 0.661 + 0.778a
where, t = Shear stress (kPa)
a = Normal stress (kPa) W This converts to apparent values of:
Lj
c1 - 0.661 kPa ;
01 - 37.9Q;
correlation, r ■ 0.7171
I
This, however, is not an accurate representation of the ice rubble
behaviour. The changing properties of the parental ice sheet with
■ time (Appendix F) have an effect on the cohesive bonding intercept
^
and the friction angle.
The graph of time versus shear stress
indicates this. Each line represents different ranges of confining u/ pressure. The shear stress is seen to decrease with time for each of the confining stresses. It also indicates that shear stress I f
increases with an increase in confining pressure, as expected. [ To overcome this problem of changing rubble properties, the shear
stresses were plotted versus the normal stresses for a definite
] time division, as seen in the third graph. Within each division
^
similar properties exist, thus reducing any effects of time on the
l rubble properties. Four such bands are plotted revealing an
^ interesting trend. As time increases the cohesive bonding
increases but the angle of friction decreases.
i
LM-1991-27
18
Part of the increase in cohesion can be attributed to effect of
jj
freeze-bonding which increases with time.
With an increase in
freeze-bonding, the ice pieces lose some of their manoeuvrability.
I This means that the ice pieces cannot as easily readjust to
overcome the effect of interlocking, thus reducing the friction ; angle. As a result of the reduced ability to overcome the ^ interlocking, the weakest shear plane will involve breaking ice pieces in flexure and shear. This increases the cohesion the ^J additional amount.
; The equations describing the four time divisions are as follows:
r = 0.523 + 1.145a 7:21 to 8:08 warm-up hrs
U
t = 0.597 + 0.769a
8:08 to 8:43 warm-up hrs
r = 0.674 + 0.696a 9:35 to 10:25 warm-up hrs
i-J
t = 0.824 + 0.515a
10:25 to 11:13 warm-up hrs
[{_J
This converts to the respective values and fit correlations of:
| /
c - 0.523 kPa ; 0 - 48.9° ;
r = 0.9169
c = 0.597 kPa ; 0 = 37.6° ; r = 0.5796
I \ c = 0.674 kPa ; 0 = 34.8° ; r - 0.9023
u
c = 0.824 kPa ; 0 = 27.2° ;
r = 0.5574
The fourth graph presented in appendix J is hydrostatic load versus
'{j normal stress. The graph indicates that the hydrostatic load
increases with normal stress.
The final graph presents the strain at peak shear versus normal i stress. This plot indicates that as the confining pressure is ~~ increased on the rubble sample the amount of displacement required
to shear the sample to failure also increases.
i LM-1991-27 19 LJ
9.2 Observations
I |
The ice rubble shear box performed with few problems. The moveable [ shear box did produce a large amount of friction on the final two
^
test days.
The box seemed to swell despite the epoxy resin
coatings. However, the results are felt to have been little
U
affected.
ljj
During the shear process realignment of ice pieces was noticed.
This seemed to be a response to overcoming interlocking forces.
j The realignment also caused readjustment of the confining plate
w
position, sometimes causing a significant jump in its position.
The rubble sample was observed to develop a definite shear plane,
^
corresponding to the first shear load peak.
In some cases, the ice
rubble became compressed together and this first shear plane
Lj
disappeared.
However, a second shear plane soon after developed,
often at a much higher peak shear load. This indicates that the
M
shear load recorded is a response to the porosity and compression
of the material. Each peak is representative of a different
material.
i I
As a result of gaps developing in the rubble sample (figure 9.1),
the confining pressure was acting over a decreasing area. Although
not visible in the figure, a gap also formed on the right hand side
of the moveable shear box.LM-1991-27 20
j LM-1991-27 21
u
10.0 Conclusions
\ i
The floating ice rubble tests and subsequent results have led to several conclusions. These are as follows:
i J
1. The ice rubble apparatus uses the direct shear method for
\J
testing ice.
This method has proven to be effective.
j 2. The ice fragment size for this particular apparatus should not exceed 35mm thickness. A larger ice piece size is felt i to be large for the box dimensions. The piece sizes range
^
from 1 to 8 times the ice piece thickness, with an average
dimension of 3.0 to 3.2 times the ice piece thickness.
u
3. Ice rubble behaves as a linear Mohr-Coulomb failure
[j
material.
This implies that shear stress can be
approximated to a linear function of normal stress.
; /
\ ;
4. The model ice rubble cohesive bonding value increases with warm-up hours, this being related to freeze-bonding.
u
The cohesive bonding value ranged from 0.523 to 0.824kPa.
U
5. The angle of internal friction decreases with warm-up
hours. The angle ranged from 27.2° to 48.9°.
u
j !
6. The strain to failure of the rubble sample tends to increase with confining pressure.
7. The pressure exerted on the side of the shear box tends to increase with pressure.
The relevance of warm-up hours is that the ice strength changes (decreases) with time. This is part of the tempering process of model ice, bringing the strength down to model the strength of real
i i LM-1991-27 22 LJ
11.0 Recommendations
j j
LJ
The following recommendations are suggested for future testing of ( ice rubble:
1. A future study should try and understand the behaviour of ice
U
rubble as it relates to the amount of compression and consolidation
the sample undergoes•
u
2. The moveable shear box should be guided by runners to eliminate the high friction amounts.
i 3. The shear box was driven by the control carriage. It is ^ suggested that a hydraulic pump be used for this in the future. The pump exists at the IMD facilities for in-situ ice compression
LJ tests. A 10 l/8fl single acting, solid plunger hydraulic cylinder
can be purchased to accompany this. This can then be set to drive
■ the moveable shear box at a constant rate. The pump itself can
easily be attached to the shear apparatus.
4. The moveable shear box could be lengthened to accompany more ice. When the ice rubble is sheared, the two ice faces will still ^ be in contact, thus a changing shear width would be eliminated. i *
L)
5. The box can easily be made to accompany grounded ice rubble.
This can be done by simply attaching a top and bottom to the box. I !
6. More sheet metal collars could be fabricated and all samples I taken at once. In this way tests could be performed one after
another without having to attain another sample. ! i
^ 7. No greater ice piece size than 35mm should be used for this box.
; i
U 8. A new apparatus should be constructed from a material not
susceptible to warpage if further study on ice rubble is proposed. LJ
I LM-1991-27 23
U
REFERENCES
\ j
^
Bowles, J. E. Foundation Analysis and Design. McGraw-Hill Book Co.:
New York, 1988.
j (
Case, P. C. MA Model Scale Study of the Frictional and Cohesive [J properties of Floating Model Ice Rubble11, IMD/NRC Report
LM-1991-03, December 1991.
LJ
•
w
Ettema, R. and Urroz, G.E. "On Internal Friction and Cohesion in
Unconsolidated Ice Rubble.11 Cold Regions Science and
u
Technology, vol. 16, 1989, pp. 237-247.
U Hellman, J. H. "Basic Investigations on Mush Ice", Proc. IAHR,
Hamburg, West Germany, 1984, pp. 37-55.
I ;
i ;
Holtz, R. D. and Kovacs, W. D. An Introduction to Geotechnical
| j
Engineering. Prentice-Hall, Inc.: Englewood Cliffs, New
w
Jersey, 1981.
i ■
^
Keinonen, A. and Nyman, T. lfAn Experimental Model-Scale Study of
the Compressible, Frictional, and Cohesive Behaviour of Broken
U
Ice Mass", Proc. IAHR. 1978, pp. 335-53.
I
Prodanovic, A. "Model Tests of Ice Rubble Strength", Proc. POAC.
1979, pp. 89-105.
i !
I j
^
Sayed, M. "M.echanical Properties of Ice Rubble", Proc. Structures
| ±81, PP. 647-659.
Schaefer, J.A. and Ettema, R. "Experiments on Freeze-Bonding
j j
\Ji Between Ice Blocks in Floating Ice Rubble", IIHR Report #296,
1985.
! i
u
LJ
U
U
LM-1991-27 24
Urroz, G.E. and Ettema, R. "Simple Shear Box Experiments With Floating Ice Rubble", Cold Regions Science and Technology- vol. 14, 1987, pp. 185-199.
Weiss, R.T., Prodanovic,A., and Wood, K.N. "Determination of Ice
i I 25
J
U
! I
u
u
j 1u
u
I. J.L)
APPENDICES
LJ
U
APPENDIX A
Summary of reported c, and 0 values (with comments)
A-2 C V h (kPa) (mm/sec) (mm) <kP») H (mm) L (mm) Ice Type Grounded/ Floating
Kanonen and Nyman, 1978
48 0.01 - 20-23 1.4 300 300 iTcsn grounaca Case, 1991 35 50 3.0 3.0 450 450 600 600 EG/AD/S floating
v not repotted in reference direct shear - nibble placed in box Prodanovk, 1979 47 53 0.26 0.58 Weiss etaL, 1981 13 11 26 25 34 34 1.7 1.2 2.3 1.4 4.1 3.4 HeUman,1984 57 41 65 54 52 52 47 Wong, -0.90 0.90 0.45 0.60 0.40 0.10 0 0.9-9 0.1-9 4.0 25.0 3.0 24.0 5.0 25.0 1.6 10.9 1.6 10.9 1.6 10.9 92.0 Gale, and Sego, 1987
-Urroz and Ettema, 37 52 31 51 Sayed, 27-45 0 0 0 0 1987 10-20 2.8 5.9 1987 2 2 2 2 19 38 80 80 150 150 200 200 10-20 10-20 10-20 10-20 10-20 10-20 10-20 -18 27 70 78 30 2.7 2.7 31 31 31 31 31 31 4 4 4 4 4 4 4 -0.4 0.4 0.4 0.4 10-35 304 304 1000 1000 1000 1000 1000 1000 700 700 700 700 700 700 700 200 76-229 76-229 133-200 152-229 500 457 457 1500 1500 1500 1500 1500 1500 800 800 800 800 800 800 800 300 609 609 609 609 300 saline saline ? fresh fresh and polyethylene fresh grounded grounded grounded ? floating grounded
reported as peak shear strength direct shear - rubble placed in box
reported as peak shear strength direct shear test
nibble loaded into box
mush ice recognized 3 phases
direct shear rubble loaded into box
direct shear - nibble poured in box ice cubes, failure not observed
reported as continuous shear rubble placed in box
singularly sized blocks
cuhic hlndrfl
rubble placed in box tests at -10° and -22°
direct shear test
u
u
0 * internal angle of friction
j !
c = cohesion
v = rate of shearing
h * average thickness or characteristic dimension of ice sheet
^ H = average thickness of ice rubble layer
I L * average width of rubble sample
U
ctnn = maximum reported value of confining pressure used
U
u
B-l
APPENDIX B
Original Apparatus—Photographs
Li
B-2
Original Ice Rubble Shear Apparatus
L
Li
c-i
APPENDIX C
Altered and Improved Shear Apparatus —Photographs
C-2
Improved Shear Apparatus
C-3
Hydrostatic Pressure Plates
C-4
Application of Confining Pressure
u
APPENDIX D
Testing Procedure for Floating Ice Rubble
D-2 1. Before transporting the ice rubble shear box to the ice tank ensure that all movable sections slide freely and that idlers and bearings rotate freely. If there is any jamming or seizing, adjust parts accordingly. Adjust chains to approximately the same tension.
2. Transport the shear box to the ice tank.
3. Gather together all necessary equipment. This includes, but is not limited to, a red Robertson's screwdriver, cylindrical lead
weights (4 at 10 kg, 4 at 5 kg) , sheet metal collar, channel
section, 1 or 2 klb load cell (S-type) , 2 x 50 lb load cells
(button type), load cell related extension cords, 15-20 ft rope, two large carpenter clamps, 3/411 #8 flathead wood screws, two 9/16" wrenches, one 3/4fi wrench, two 1/411 wing nuts, two 3/8" flat washers, grabber, extendable extension mirror, rope (various lengths), underwater video camera, video camera (regular), 20 in (min.) displacement transducer, 6 x 5 kg C.I. weights, 2 x 2 kg C.I. weights.
4. Break ice sheet into pack ice and form ice rubble field using service carriage. Calculate the rubble field length for a desired depth using a porosity of 0.34 to 0.37.
5. Remove confining plate from the shear box if not already done
so.
6. Attach all necessary devices (load cells, displacement transducer)•
7. Install shear apparatus into the tank, near the end of the rubble field. Perform this by utilizing the crane on the service
carriage. Cylindrical dead weights (20 to 30 kg) must be put on
over the bars extending out of the base of the box. The underwater
camera should be attached to the box before it enters the water. 8. Clamp the apparatus to the side of the tank wall. Place bracing such that it is in contact with blocks under the carriage rails. This prevents lateral movement when shear forces are applied. 9. Connect the 1 or 2 klb load cell to the aluminum c-section and flat plate using 1" x 1/2" 20 UNC bolts.
10. Connect the channel and load cell to the service carriage with the open face of the channel facing the tank wall. The long dimension of the flat plate should be vertical.
11. Connect service carriage to the control carriage.
12. Connect the load cell wires and displacement transducer to the control carriage data recording system. This will require extension cords.
u
D-3
13. Zero the two push-button load cells.
14. Obtain rubble sample using the sheet metal collar and manoeuvre into position into the shear box.
15. Place confining plate in position and remove sheet metal collar. Attach chains and the displacement transducer to the confining plate. Remove the sheet metal collar.
16. Record all pre-test measurements (keel, sail).
17. Move carriage into position. The load cell should be lowered
so that the top of the flat plate just breaks the water surface. 18. For the first test of each day only, take a position reading of the confining plate and then zero the displacement transducer and S-shaped load cell.
19. Ensure the load cell and shear box pathway is clear.
20. Begin recording data and place confining weight into position. 21. Perform test. Do not let shear box displacement exceed 240mm.
22. Back carriages off. Acquire and record post test measurements.
23. Remove confining load, confining plate, and ice rubble from box.
24. After testing for a day is completed, remove shear apparatus from tank.
E-l
J
APPENDIX E
Ice Sheet Summaries
J
LJ
LI
lJ
L
- INSTITUTE FOR MARINE DYNAMICS ARCTIC VESSEL RESEARCH SECTION
ICE SHEET SUMMARY
E-2
Test Name: SQUISH4
Target ice thickness(mm): 30.
Target ice strength(kPa): 30
SEEDING: Air temp.(max/ain) C: -19.6/-15.1 | Seeding completed at 2027 18-N0V-1991
lJ Seed volume: 1 25.6
Humidity: tank(%) 73 i room(X) 50 GROWTH: Target temp.: C -22.0Avg temp, at plateau: C -21.9 Avg temp, of freeze cycle C -21.4 Total negative deg. hours 159.8 Avg growth rate: (mm/hr) 2.947 WARM-UP:
u
Warm-up commenced at 0355 19-N0V-1991 Time to tempering temp: (hrs) 3.7 Final ice thickness: (mm) 30.0 Total growth rate: (mm/hr) 4.016
Project Number: 91292
EG/AD/S: (%) .39/.036/.04
Ice Type: M
Tank water temp. C: 0.07 Seed duration: (mm) 30. Seed water temp.: C 40.0
Time to target temp, hrs: 0.9
Duration of plateau hrs: 6.6
Duration of freeze cycle hrs: 7.5 Thickness at end of freeze:(mm) 22.0 Avg growth rate: (mm/fdh) .138
Length of warm-up: (hrs) 8.
Avg tempering temperature: (C) 0.9
Ice growth during warm-up: (mm) 8.0
Total growth rate: (mm/fdh) .188
* thickness at end of freeze was estimated
■{ I NRC - INSTITUTE FOR MARINE DYNAMICS
U
ARCTIC VESSEL RESEARCH SECTION E_3
i !
U
ICE MECHANICAL PROPERTIES SUMMARY
| j Test Name: SQUISH4 Project Number: 91292i
Warm up commenced: 03:55 19-NOV-1991
E E/Sf Lc/hi Klc Sf/Klc Sc/s Rhoi
Pa N/m m-.5 kPa Mg/m3 57.4 1002 11.7
J
-\ 1 Time 0840 0850 0905 0913J
0927
1 0940 0952 Wa rm-up hrs 4.75 4.91 5.16 5.30 5.53 5.75 5.95 Loc N S 39S 39N 39S 39N 39N 39N hi mm 27.8+ 29.0+ 29.0 29.1 29.0 29.1 29.3 29.5 29.9 29.2 Sf kPa 2.0 0.3 58. 22. 57. 23. Lc cm M n- 3 n- 3 34. 57 + 3.6 Tu/d 36%) + 2.4 Tu/d 39%) c s 70 44 .5+ .6+ 9 7 .939 .0 .0U
NRC - INSTITUTE FOR MARINE DYNAMICS
ARCTIC VESSEL RESEARCH SECTION E-4
ICE SHEET SUMMARY
Test Name: SQUISH5
| [Target ice thickness(mm): 30.
w
Target ice strength(kPa): 30
Ij SEEDING:
li
Air temp.(max/min) C: -21.4/-14.3 Seeding completed at 2028 19-N0V-1991 Seed volume: 1 36.6 Humidity: tank(%) 76 room(%) 49 GROWTH: Target temp.: C -22.0Avg temp, at plateau: C -22.0 Avg temp, of freeze cycle C.-21.3 Total negative deg. hours 159.0
Avg growth rate: ~(mm/hr) 2.874
WARM-UP:
Warm-up commenced at 0355 20-N0V-1991 Time to tempering temp: (hrs) 3.7
U Final ice thickness: (mm) 30.0
Total growth rate: (mm/hr) 4.025
Project Number: 91292
EG/AD/S: (%) .39/.036/.04
Ice Type: M
Tank water temp. C: 0.02 Seed duration: (min) 31. Seed water temp.: C 28.0
Time to target temp, hrs: 1.2 Duration of plateau hrs: 6.3
Duration of freeze cycle hrs: 7.5 Thickness at end of freeze:(mm) 21.4 Avg growth rate: (mm/fdh) .135
Length of warm-up: (hrs) 8.
Avg tempering temperature: (C) 1.2 Ice growth during warm-up: (mm) 8.6
Total growth rate: (mm/fdh) .189
thickness at end of freeze was estimated
u
NRC - INSTITUTE FOR MARINE DYNAMICS ARCTIC VESSEL RESEARCH SECTION ICE MECHANICAL PROPERTIES SUMMARY
E-5
Test Name: SQUISH5 Project Number: 91292
Warm up commenced: 03:55 20-NOV-1991
u
j i
j JU
i
1 ! 1 ; ! ! i [•u
Time 0830 0840 0854 0903 0905 0918 0931 Warm-up hrs 4.58 4.75 4.98 5.13 5.16 5.38 5.60 Loc N S 39S 39N 39N 39S 39N 39N hi mm 28.0+ 27.5+ 28.4 28.7 28.6 28.7 28.3 28.1 29.1 28.8 Sf kPa 0.5 1.1 59. 28. 66. 29. Lc cm V n- 3 n- 3 35. 65 + 2.9 Tu/d 46%) + 5.7 Tu/d 44%)MPa E/Sf Lc/hi Klc Sf/Klc Sc/s RhciN/m m-.5 kPa Mg/t3
993 12.2 c s .936 74.6+11.4 62.7+13.6 V-'
u
NRC - INSTITUTE FOR MARINE DYNAMICS
J
ARCTIC VESSEL RESEARCH SECTION
I
J ICE SHEET SUMMARY
Test Name: SQUISH6 Project Number: 91292
Target ice thickness(mm): 30. EG/AD/S: (%) .39/.036/.04
Target ice strength(kPa): 30 Ice Type: M
j SEEDING: temp.(max/mln) C: -21.5/-14.3 Seeding completed at 2026 20-N0V-1991 Seed volume: 1 29.3 Humidity: tank(X) 75
^
room(%) 48
[GROWTH: Target temp.: C -22.0j [Avg temp, at plateau: C -22.0
wAvg temp, of freeze cycle C -21.1 Total negative deg. hours 160.0 ] Avg growth rate: (mm/hr) 2.957
I I
WWARM-UP:
Tank water temp. C: 0.01 Seed duration: (min) 30. Seed water temp.: C 40.0
E-6
jWarm-up commenced at 0400 21-N0V-1991
Time to tempering temp: (hrs)* 3.5
Final ice thickness: (mm) 30.0 [Total growth rate: (mm/hr) 3.965
Time to target temp, hrs: 1.6 Duration of plateau hrs: 6.0
Duration of freeze cycle hrs: 7.6 Thickness at end of freeze:(mm) 22.4 Avg growth rate: (mm/fdh) .140
Length of warm-up: (hrs) 8.
Avg tempering temperature: (C) 0.8 Ice growth during warm-up: (mm) 7.6 Total growth rate: (mm/fdh) .188
thickness at end of freeze was estimated
j I
NRC - INSTITUTE FOR MARINE DYNAMICS E_7
w ARCTIC VESSEL RESEARCH SECTION
i f
[j ICE MECHANICAL PROPERTIES SUMMARY
Test Name: SQUISH6 Project Number: 91292
i f
^
Warm up commenced: 04:00
21-NOV-1991
I f.
,j Time Warm-up Loc hi Sf Lc E E/Sf Lc/hi Klc Sf/Klc Sc/s Rhci
hrs mm kPa cm MPa N/m m-.5 kPa Mg/c3
0830 4.50 N 29.1+ 1.0 n« 3
U
S
28.1+ 1.0 n« 3
0840**
0853
"-'' 0901J
0912
0922 1 0935 4.67 4.88 5.02 5.20 5.37 5.58 40S 40N 40S 40N 40N 40N 29.3 29.2 29.5 29.6 29.8 29.6 29.1 29.7 37. 7€ 60.+ 3.8 25.Tu/d 40%) 63.+ 3.1 3O.Tu/d 47%)u
u
} A i w .936 s 79.7+28.4 c 83.9+ 3.9NRC - INSTITUTE FOR MARINE DYNAMICS ARCTIC VESSEL RESEARCH SECTION
ICE SHEET SUMMARY
E-8
Test Name: SQUISH7
Target ice thickness(mm): 30. Target ice strength(kPa): 30
SEEDING:
J/iir temp, (max/mln) C: -21.6/-15.6
Seeding completed at 2031 21-N0V-1991 i ;Seed volume: 1 34.9 .jHumidity: tank(X) 77 room(%) 53
f 'GROWTH:
Target temp.: C -22.0Avg temp, at plateau: C -21.7 temp, of freeze cycle C -21.3 Total negative deg. hours 160.7 Avg growth rate: (mm/hr) 3.017
'WARM-UP:
Warm-up commenced at 0403 22-N0V-1991
wTime to tempering temp: (hrs) 3.5
Final ice thickness: (mm) 30.0 1 Total growth rate: (mm/hr) 3.982
Project Number: 91292
EG/AD/S: (%) .39/.036/.04
Ice Type: M
Tank vater temp. C: -.08 Seed duration: (min) 30. Seed vater temp.: C 28.0
Time to target tump, hri;: 0.0 Duration of plateau hrs: 6.7
Duration of freeze cycle hrs: 7.5
Thickness at end of freeze:(mm) 22.7 Avg growth rate: (mm/fdh) .141
Length of warm-up: (hrs) 8.
Avg tempering temperature: (C) 1.5 Ice growth during warm-up: (mm) 7.3 Total growth rate: (mm/fdh) .187
* thickness at end of freeze was estimated
I j w
NRC - INSTITUTE FOR MARINE DYNAMICS ARCTIC VESSEL RESEARCH SECTION
ICE MECHANICAL PROPERTIES SUMMARY
E-9
Test Name: SQUISH7 Project Number: 91292
Warm up commenced: 04:03 22-NOV-1991
~J Time 0825 ! 0835
""*
0849
-/
0852
0858 / ,- 0906-1'
0912
J
0920
0925 Warm-up hrs 4.37 4.53 4.77 4.82 4.92 5.05 5.15 5.28 5.37 Loc N S 40S 4 ON 4 IS 40S 41S 40N 40N 41S 40N hi mm 29.6+ 28.2+ 29.0 29.2 29.3 29.6 29.5 29.5 29.6 29.2 29.8 29.6 30.2 Sf kPa 0.8 0.5 59. 28. 61. 29. Lc E E/S cm MPa n- 3 n- 3 37. 77.1 1257 + 1.6 (u/d 47%) + 3.1 Tu/d 48%)E/Sf Lc/hi Klc Sf/Klc Sc/S Rhoi
N/m m-.5 kPa Mg/«3 12.6 53.8+ 2.0 s s s c 86.1+ 6.1 30.6+ 5.4 .9~39 88.3+19.0 69.0+ 4.4
U
I iu
NRC - INSTITUTE FOR MARINE DYNAMICS ARCTIC VESSEL RESEARCH SECTION
E-10 ICE SHEET SUMMARY
Test Name: S0UISH8
Target ice thickness(mm): 30. Target ice strength(kPa): 30 SEEDING: Air temp.(max/min) C: -21.7/-15.4 , Seeding completed at 2024 25-N0V-1991 \ Seed volume: 1 30.6
^ Humidity: tank(%) 71
room(%) 49({
U GROWTH:
Target temp.: C -22.0Avg temp, at plateau: C -22.1 Avg temp, of freeze cycle C -21.( Total negative deg. hours 159.3
Avg growth rate: (mm/hr) 2.811
WARM-UP:
Warm-up commenced at 0346 26-N0V-1991 Time to tempering temp: (hrs) 3.7 Final ice thickness: (mm) 30.0 Total growth rate: (ram/hr) 4.071
Project Number: 91292
EG/AD/S: (%) .39/.036/.04
Ice Type: M
Tank water temp. C: -.01
Seed duration: (min) 30.
Seed water temp.: C 41.5
Time to target temp, hrs: 0.9
Duration of plateau hrs: 6.4
Duration of freeze cycle hrs: 7.4
Thickness at end of freeze:(mm) 20.7 Avg growth rate: (mm/fdh) .130
Length of warm-up: fhrs) 8.
Avg tempering temperature: (C) 1.8
Ice growth during warm-up: (mm) 9.3
Total growth rate: (mm/fdh) .188
* thickness at end of freeze was estimated
u
u
j I
NRC - INSTITUTE FOR MARINE DYNAMICS
ARCTIC VESSEL RESEARCH SECTION E-ll
ICE MECHANICAL PROPERTIES SUMMARY
|J
Test Name: SQUISH8
Project Number: 91292
Warm up commenced: 03:46 26-NOV-1991
u
E E/Sf Lc/hi Klc Sf/Klc Sc/s Rhoi
MPa N/m m-.5 kPa Mg/m3 29. 44.0 755 11.3 26.2 26.Tu/d 47%) 0910 5.40 40S 26.2 58.+ 1.6 26.2 22.Tu/d 38%) Time 0835 0850 0905 Warm-up hrs 4.81 5.06 5.31 LOC N S 40S 40N hi mm 27. 26. 26. 26. 5+ 7+ 0 5 Sf kPa 0.9 1.5 n-56.+ Lc cm 3 3 29. 3.1 i s u w i I 0919 0920 0935 5 5 5 .55 .56 .81 40S 40S 40N 26 26 26 .2 .2 .7 s c 67 66 .937 .5+11 .1+ 3 .6 .7
NRC - INSTITUTE FOR MARINE DYNAMICS ARCTIC VESSEL RESEARCH SECTION
E-12
{Test Name:
S0UISH9
ICE SHEET SUMMARY
Project Number: 91292 Target ice thickness(mm): 30.
^Target ice strength(kPa): 30
SEEDING: temp.(max/min) C: -21.5/-15.6 Seeding completed at 2025 26-N0V-1991 ) Seed volume: 1 33.5 UHumidity: tank(%) 74 room(%) 44
\JGROWTH:
Iw
Target temp.: C -22.0Avg temp, at plateau: C -22.3
Avg temp, of freeze cycle C -21.7
Total negative deg. hours 160.3
Avg growth rate: (mm/hr) 3.070
WARM-UP:
wWarm-up commenced at 0347 27-N0V-1991
Time to tempering temp: (hrs) 4.2
Final ice thickness: (mm) 30.0
Total growth rate: (mm/hr) 4.063 U
EG/AD/S: (%) .39/.036/.04
Ice Type: M
Tank water temp. C: -.01
Seed duration: (mln) 30. Seed water temp.: C 30.0
Time to target temp, hrs: 1.1
Duration of plateau hrs: 6.3
Duration of freeze cycle hrs: 7.4 Thickness at end of freeze:(mm) 22.7 Avg growth rate: (mm/fdh) .141
Length of warm-up: (hrs) 8.
Avg tempering temperature: (C) 0.7 Ice growth during warm-up: (mm) 7.3 Total growth rate: (mm/fdh) .187
* thickness at end of freeze was estimated
U-J
u
w
NRC - INSTITUTE FOR MARINE DYNAMICS ARCTIC VESSEL RESEARCH SECTION ICE MECHANICAL PROPERTIES SUMMARY
E-13
Test Name: SQUISH9 Project Number: 91292 Warm up commenced: 03:47 27-NOV-1991
Time 0840 0855 0907 0915 0926 0935 0951 1004 Warm-up hrs 4.87 5.12 5.32 5.45 5.63 5.78 6.05 6.27 LOC N S 40S 40N 40S 40S 40N 40N 37N hi mm 29.9+ 28.4+ 30.1 29.4 29.5 29.7 29.9 29.7 29.8 30.0 29.7 Sf Lc E kPa cm MPa 0.8 n- 3 0.7 n- 3 36. 64.2 59.+ 3.0 27.Tu/d 44%) 61.+ 2.3 25.Tu/d 40%) 51.+ 1.7
E/Sf Lc/hi Klc Sf/Klc Sc/s Rhoi
N/m m-.5 kPa Mg/m3 c s 95 56 .936 .2+ 6 .2+11 .2 .0
U
F-l
u
u
u
11
u
APPENDIX F
w
u
1 ! . ... i+-FI
I
r
L
i i i • < • i i i:
1
!
++ i
■ i ■ s-■71
\t *\
i
i
t ++ 1
: *
m1
1 1 •tt.
!
• ■ • • ■ ■ ■ m m m m m m m m m ■ ■ ■ 1 ■ ■ ■ ■ B 1 ■ • ■ ■ B ■ B B B B B B B B B 1 1 • • • • a 1 a • a a a a a 1 a a a a a a a a a a:♦•
1:
1 1 ■ 1 a 1 ' • 1 1 1 1 ■ 1 1 ■ 1 • ■ • 1 • ■ ■ 1 ■ 1 ■ ■ 1 ■ ■ ■ ■ 1 • ■ 1 ■ 1 ■ ■ ■ 1 ■ ■ 1 • t m ■ ■ I ■ t 1 1 1 1 • 1 1 1 1 F-2 <\J U1 CO I <M OU
u — OJ tft a.l:
C::
rr
cr
tr
u::
c
c::
cr
c;::
t:
1
n
s
h
r
s
t
r
k
P
1
t
+
k_
4.
1+
+
1+
+
1—^-—^
^—t
4
5
8
warn-up
hrs
10
11
U)c;_
c:::
cz>
cz
c:
tzz
r:::
tr;..
xz:
t::
r_
cz:
c::
cr
n
s
t
r
k
P
a
1
hrs
8
-PSci.
c:
r:
t.r:
c::
it:
c
l:::
c~
cz
e:
c::
c:
c:r
1
n
E
1
5
M
0
d
k
P
a
1
7
8
w
a
r
m
-u
p
h
r
s
10
11
7
j I
u
F-6 Ul CO Q_ IO (Uu
U
u
u
u
u
u
G-lAPPENDIX G
Squish5—Run 3, f Sample Graphical and Statistical Output
U
cr:
cr.:
cr
cr
81O.863 8O0.OO0 500.000 400.000 200.000 — 2.951 O.OOOrr;
c:
cr
lit:
c
cr
r
cr
c
tr:
c:
c
NEFF-A-6 100,000 200.000 TIME (sec x1OtO) 9.753 .HYDRO. PRESSURE .(J.QP).(NEWTONS.x 1 Otp) 300.000 -4OO.OC 428.3OO 4.000 2.OOO NEFF—A*-4 — 0.58OQ.000 100.000 2OO.OOO TIME (sec x1OtO) 300.000 4OO.OC 428.OOO 5.374 .HYDRP. PRESSURE .(BOTTOM).(NEWTONS. xi Otp) NEFF^-A-5 — 1.1 67Q.OOO 1OO.OOO 200.000 TIME (sec x1OTO) 22.421 CONFI.NI.NO PJSPLACEME.NT.Cmm xi.Otp). 20.000 O.OOO 300.000 4OO.0C 428.000 NEFF«-A«-0 -2O.OOO * — 5O.14O O.1OO O.O1 8 CARRIAGESPEED fm/s O.O1 5 0.010 100.000 200.000 TIME (see x1OTO) 3OO.OOO 4OO.OC 428.100 NEFF*-A«-47 1OO.OOO TEST«-SQUISH5 200.000 TIME (see x1OtO) 300.000 4OO.OC 428.050 RUN-3 2O-NOV—1991 13:35:12G-3 CO
t
I
Lj_ U. LJ -7o
o
xZ
O
I-LJZ
Q
<
0
_l<
LJ
I
if)
••"Zj
>
:
/
... a. .J
<-*<
\
/
"■—■—,K
rTTTrrrr00
no
000
106
00
0000
o
o
o
6
o
o
o
o
<o
o
(0o
o
o
6
o
m
o
o
o
6
o
o
o
o
•o
o
ro
o
o
o
•o
o
O
O
O
o
o
o
o
q
6
m
o
o
o
6
o
too
o
o
6
10
CN
o
o
q
6
o
o
o
«10
00
6
o
o o 0) CM in 0) 0)>
O
z
I
o
I
Z
D
q:
10
1
05
D
O
UI-Run No. 3 Total No. Samples * 8567 Tl - 0.5500 Sec. T2 - 163.8000 Sec.
"TEST SQUISH5
RUN 73 lmm/s Description SHEAR LOAD(NEWTONS)HYDRO PRESSURE (TOP)(NEWTON HYDRP PRESSURE (BOTTOM)(NEW CONFINING DISPLACEMENT (mm) ; ^ CARRIAGE SPEED(m/s)
20-NOV-1991 13:35:12.83
Run No. 3 Total No. Samples - 8567
Tl - 163.7500 Sec. T2 - 303.6000 Sec.
TEST SQUISH5
RUN 73 lmm/s
Description
SHEAR LOAD(NEWTONS)
HYDRO PRESSURE (TOP)(NEWTON HYDRP PRESSURE (BOTTOM)(NEW CONFINING DISPLACEMENT(mm) CARRIAGE SPEED(m/s)
Run No.
Tl - 315.2500 Sec.
Total No. Samples - 8567
T2 419.0500 Sec.
TEST SQUISH5
RUN 73 lmm/s
M:h Description
Average
} 1 SHEAR LOAD(NEWTONS) 583.73950
!LJ 2 HYDRO PRESSURE (TOP)(NEWTON 4.04368
3 HYDRP PRESSURE (BOTTOM)(NEW 0.60614
, 4 CONFINING DISPLACEMENT (mm) -48.76085 I 5 CARRIAGE SPEED(m/s) 0.00646
Run No. 3 Total No. Samples * 8567
j Tl - 114.9500 Sec. T2 - 403.2500 Sec.
^TEST SQUISH5
RUN 73 lmm/s
Description Average
SHEAR LOAD(NEWTONS) 416.50699
HYDRO PRESSURE (TOP)(NEWTON 2.79058 HYDRP PRESSURE (BOTTOM)(NEW 1.11856 CONFINING DISPLACEMENT(mm) -11.42957 CARRIAGE SPEED(m/s) 0.00650 \ i 1
J|
4I
G-4 Average 0.33125 6.52721 3.76167 15.84972 0.00377 Std Dev 2.21137 1.97857 0.69455 3.14999 0.00249 Minimum -2.95125 1.29219 1.68580 11.82527 0.00153 Maximum 11.21324 9.75337 5.37420 22.42118 0.01813 20-NOV-1991 13:35:12.83 Average 463.58255 0.52832 0.50922 6.55393 0.00650 Std Dev 132.35835 2.00854 0.99821 7.35235 0.00077 Minimum 1.77025 -0.51101 -1.16749 -46.15557 0.00363 Maximum 598.39569 8.43564 4.53909 12.24910 0.01053 20-NOV-1991 13:35:12.83 Std Dev 55.02812 2.12658 0.53733 0.98276 0.00063 Minimum 427.99258 -0.58036 -0.68034 -50.13964 0.00396 Maximum 668.35968 6.42438 1.96417 -46.74894 0.00928 20-NOV-1991 13:35:12.83 Std Dev £16.15959 3.38618 1.61573 27.39727 0.00077 Minimum -1.66357 -0.58036 -1.16749 -50.13964 0.00328 Maximum 658.91669 9.75337 5.16542 13.26631 0.01144H-l
U
.1 rU
u
APPENDIX H
u
Tabulated Resultsj | and Sample Calculation
U
u
H-2