HAL Id: cea-02339719
https://hal-cea.archives-ouvertes.fr/cea-02339719
Submitted on 4 Nov 2019
HAL is a multi-disciplinary open access archive for the deposit and dissemination of sci-entific research documents, whether they are pub-lished or not. The documents may come from teaching and research institutions in France or abroad, or from public or private research centers.
L’archive ouverte pluridisciplinaire HAL, est destinée au dépôt et à la diffusion de documents scientifiques de niveau recherche, publiés ou non, émanant des établissements d’enseignement et de recherche français ou étrangers, des laboratoires publics ou privés.
Effect of pH on the stability of passivating gel layers
formed on International Simple Glass
M. Fournier, T. Ducasse, A. Perez, A. Barchouchi, D. Daval, S. Gin
To cite this version:
M. Fournier, T. Ducasse, A. Perez, A. Barchouchi, D. Daval, et al.. Effect of pH on the stability of passivating gel layers formed on International Simple Glass. Journal of Nuclear Materials, Elsevier, 2018, 524, pp.21-38. �10.1016/j.jnucmat.2019.06.029�. �cea-02339719�
Effect of pH on the stability of passivating gel layers formed on
International Simple Glass
Maxime Fourniera, Thomas Ducassea, Anne Pérezb,c, Ayoub Barchouchia, Damien Davalb,
Stéphane Gina
a CEA, DEN, DE2D, SEVT, F-30207 Bagnols sur Cèze, France
5
b LHyGeS, CNRS, Université de Strasbourg, UMR 7517, 1 rue Blessig 67084 Strasbourg,
France
c LGE, Université Paris-Est, Laboratoire Géomatériaux et Environnement, (EA 4508), UPEM,
77454 Marne-la-Vallée, France
Corresponding author: Maxime Fournier 10
Postal address: CEA Centre de Marcoule
DEN/DE2D/SEVT/LCLT, Bat. 208 BP 17171
30207 Bagnols sur Cèze Cedex France
15
Tel.: +33 466797710
Abstract (
≤ 300 words)
It is known for decades that silica saturated solutions allow borosilicate glass to dissolve 20
much slower than in deionized water. The present study assesses this assertion in the specific case of the International Simple Glass, a 6-oxide borosilicate glass of nuclear interest, which we altered between pH = 1 and 10.7 at 90 °C. Depending on the stage of reaction, aqueous silica can promote either the formation of a passivating gel layer on the glass surface or the precipitation of certain secondary phases at the expense of the 25
passivating gel. We demonstrate a negligible effect of aqueous silica at acidic pH and a marked effect beyond pH90 °C = 7, ensuring a better glass chemical durability. At higher
reaction progress and above pH90 °C = 9.5, this effect becomes negative due to the formation
of secondary phases such as hydroxides or zeolites.
Keywords
30
ISG, nuclear glass, amorphous silica, pH.
Highlights (3 to 5 bullet points,
≤ 85 characters)
No effect of SiO2(aq) on the dissolution rate at acidic pH
Aqueous SiO2 slows glass dissolution at pH90 °C ≥ 7 and low reaction progress
Aqueous SiO2 fasters glass dissolution at pH90 °C ≥ 9.5 and low reaction progress
1. Introduction
Some countries like France, Japan, Russia, India or Great Britain have chosen to reprocess their spent nuclear fuel. The minor actinides and fission products arising from this
45
reprocessing are vitrified in borosilicate or, to a lesser extent, phosphate glasses. In France, the vitrified waste form, usually called “nuclear glass”, will be packed in carbon steel
containers and eventually stored in a deep claystone formation, stable and with low
permeability. The safety assessment of the geological repository relies on the performance of the different barriers and thus partly on the chemical durability and radiation resistance of the 50
glass. Although research on nuclear glass durability began a few decades ago, it is still an intense investigation field [1].
In contact with groundwater, glass dissolves and transforms into more stable phases at a rate highly dependent on geochemical conditions. The formation of a Si-rich passivating layer (also called “gel”) allows, under the most favorable conditions, to guarantee a glass package 55
lifetime of several hundred thousand years [2]. For the same glass, the composition and the structure of the gel vary according to the environmental parameters, in particular the pH and the composition of the solution. The formation of the gel competes with the formation of other secondary minerals [3-9]. As an illustration, some experiments show the presence of gel dissolution patterns under neoformed secondary phases [10, 11]. Finally, the geochemical 60
modeling of nuclear glasses alteration is based on the respective solubilities of the gel and secondary phases [12, 13].
The presence of aqueous silica [14-19] has two major effects on the glass: on the one hand, it decreases the affinity of the matrix dissolution reaction (SiO2 + 2 H2O → H4SiO4) and on
the other hand, it favors the backward reaction of silica condensation. This reaction accounts 65
for the formation of the gel layer which can, in some circumstances, be transport-limiting. Aqueous silica is not the only dissolved species which can affect glass durability. Actually, most dissolved species can play a direct role either on the reaction of hydrolysis of the –Si–
O–Si– bonds [20, 21] or indirectly, through the pH or the gel formation [6, 22-24]. Because the pH of leaching solutions is generally buffered around 9–9.5 by boron released by the 70
glass (B(OH)3 + H2O → B(OH)4– + H+, pKa = 9.14 at room temperature), and since the pH of
many natural groundwaters ranges between 6 and 8, many studies were conducted between pH = 7 and 9.5. However, some disposal designs would lead to more alkaline pH conditions [25] raising the question of the gel stability beyond the threshold of 9.5. Besides, below pH 7, the role of aqueous silica is unclear.
75
This study thus reports on the behavior of the dissolution of an international reference glass ISG (International Simple Glass) [26], a 6-oxide borosilicate glass, in solutions saturated or not with respect to amorphous silica at 90 °C for pH90 °C ranging between 1 and 10.7. Beyond
this latter pH, it becomes experimentally challenging to saturate the solution. Two ratios between the reactive surface area developed by the glass powder and the volume of solution 80
are used. These two ratios are distant from two orders of magnitude and they are complementary over the entire pH range of the study while allowing (i) to maximize the difference of silica concentrations between a pre-saturated solution and a solution where silica comes solely from the glass dissolution glass and (ii) to measure the boron
concentration with sufficient analytical precision. 85
2. Material and Methods
2.1. Preparation of the material
The tests were conducted using the ISG, which composition is given in Table 1. ISG ingots were prepared by MO-SCI Corporation (Rolla, MO, USA) [27] and provided by Savannah River National Laboratory (Aiken, SC, USA). Two glass powders were prepared from 90
ISG SiO2 B2O3 Na2O Al2O3 CaO ZrO2
Oxide wt% 56.2 ± 1.5 17.3 ± 0.9 12.2 ± 0.7 6.1 ± 0.8 5.0 ± 0.6 3.3 ± 0.5
Table 1: ISG composition expressed in oxide weight percent.
2.2. Leaching tests 95
Static leaching tests were performed at 90 ± 2 °C in perfluoroalkoxy vessel. Two test series were conducted: the first (S1) with a glass-surface-area-to-solution-volume (S/V) ratio of 60 m-1 using the 125-250 μm size fraction, and the second (S2) with S/V = 10 000 m-1 using the
20-40 μm size fraction. The reactive surfaces correspond to the geometric surfaces— assimilating glass grains to spheres—corrected by a 1.3-factor to take into account the non-100
sphericity of the glass grains [28].
Leaching tests (Table 2) were conducted in solutions saturated with respect to amorphous silica (“Sat” test series) at various pH, or in solutions with the same pH and initially devoid of aqueous silica (“Blk” test series). The acid solutions were prepared by diluting nitric acid (65%, Merck Suprapur®) in 18 M·cm ultrapure water, and the basic solutions by dissolving
105
KOH pellets (Merck Emsure®). The amounts of silica introduced to reach saturation at 90 °C
in “Sat” test series were calculated using the Chess code [29]. For pH90 °C ≥ 9.5,
silica-containing solutions were prepared by dissolving amorphous silica for about a week at 90 °C under stirring. For lower pH, the solution prepared with a pH90 °C of 9.5 was split and acidified.
The silica concentration of each solution was checked using a UV-visible spectrometer 110
(Cary® 50 Scan UV-Vis) according to a method analogous to ASTM D859-10 [30]. During the
tests, the pH was manually controlled at the set point by regular additions of micro volumes of concentrated solutions of HNO3 or KOH.
Test name Test series S/V (m-1) T (°C) pH 90°C CSi (mg·L-1) Duration (d) S1-Sat-1 1 60 90 1 3.1·102 365 S1-Blk-3 1 60 90 3 0 365 S1-Sat-3 1 60 90 3 3.0·102 365 S1-Blk-7 1 60 90 7 0 365 S1-Sat-7 1 60 90 7 1.5·102 365 S1-Sat-8 1 60 90 8 1.8·102 365 S1-Sat-9 1 60 90 9 2.8·102 365 S1-Blk-9.5 1 60 90 9.5 0 365 S1-Sat-9.5 1 60 90 9.5 7.4·102 365 S1-Sat-9.8 1 60 90 9.8 1.4·103 365 S1-Blk-10.1 1 60 90 10.1 0 365 S1-Sat-10.1 1 60 90 10.1 3.9·103 365 S1-Sat-10.3 1 60 90 10.3 1.2·104 365 S2-Blk-9.5 2 10 000 90 9.5 0 379 S2-Sat-9.5 2 10 000 90 9.5 7.4·102 379 S2-Blk-9.8 2 10 000 90 9.8 0 379 S2-Blk-9.8 2 10 000 90 9.8 1.4·103 379 S2-Blk-10.1 2 10 000 90 10.1 0 379 S2-Sat-10.1 2 10 000 90 10.1 3.9·103 379 S2-Blk-10.3 2 10 000 90 10.3 0 379 S2-Sat-10.3 2 10 000 90 10.3 1.2·104 379 S2-Blk-10.7 2 10 000 90 10.7 0 379 S2-Sat-10.7 2 10 000 90 10.7 2.7·104 379
Table 2: Characteristics of Series 1 and 2 tests, including glass-surface-area-to-solution-volume (S/V) ratio,
115
temperature (T), pH to be maintained measured at 90 °C, initial silicon concentration (CSi), and total duration.
2.3. Solution analyses
0.5 mL solution samples were taken at 1, 3, 7, 14, 28 days, 3 months and 1 year. Samples were ultrafiltered at 10 000 D, acidified with 0.5 N HNO3 and analyzed by Inductively coupled
plasma atomic emission spectroscopy (ICP-OES, Thermo Scientific iCAPTM 6000 Series) for
120
boron and silicon concentrations. As boron is known to be a glass alteration tracer, its concentration was used for the calculation of the altered glass percentage, %AG, from a mass balance taking into account the volume variation (Equation 1).
%AG =𝐶𝑖(𝑡) × 𝑉(𝑡) + ∑ 𝐶𝑖(𝑗) × 𝑉𝑆(𝑗) 𝑡−1
𝑗=1 𝑚 × 𝑥𝑖
with Ci(t) the mass concentration of element i at time t, xi the mass fraction of element i in the glass composition, V(t) the solution volume at time t, VS(j) the volume of the j-th sampling, 125
and m the mass of glass.
The equivalent thickness of altered glass, eTh(B), was calculated as a function of time using Equation 2, where r0 is the glass particles radius at t = 0 and rt its radius at a time t.
eTh(B) = 𝑟0− 𝑟𝑡 = 𝑟0× [1 − (1 − %AG) 1
3] 2
2.4. Solid analyses
X-ray diffraction (XRD). XRD patterns were acquired with a Phillips X’PERT Pro 130
diffractometer equipped with a Cu-K monochromatic source ( = 1.5418 Å) operating at 40 mA, 40 kV in Bragg-Brentano geometry. Scans were taken for 2 ranges ranges from 4° to 80° with a speed of 0.11°·min-1 and a step of 0.017° (2) using amorphous silica sample
holders. The XRD patterns were processed using the DIFFRAC.EVA v. 4.2 (Bruker) software and compared to the reference patterns of the International Center for Diffraction Data PDF-135
4+ 2018 RDB.
Scanning electron microscopy (SEM). The solid samples taken at the end of the leaching experiments were rinsed, dried, coated with a carbon deposit, and observed with a Zeiss Merlin scanning electron microscope operated with an accelerating voltage of 15 kV and coupled with a lithium doped silicon detector for energy dispersive X-ray spectrometry. 140
3. Results
3.1. S1 test series: low S/V ratio
In S1 test series, the pH values were generally maintained at the set values within ± 0.3 pH unit, with the exception of a few excursions, especially in the first 10 days of the pH90 °C = 7
tests, where the pH control was the most difficult (Figure A.1). The evolutions of silicon 145
concentrations are given in Table 3.
In the “S1-Blk” tests (Figure 1.a), the most important altered glass thicknesses are reached at pH90°C = 3 and the least important at pH90°C = 9.5. Between pH90°C = 3 and pH90°C = 9.5, the
altered thicknesses gradually decrease; above pH90 °C = 9.5, the altered glass thicknesses
increase with a sharp variation in the alteration rate between 28 and 91 days, associated with 150
the precipitation of calcium silicate hydrate-like phases (CSH) [27, 31] evidenced by SEM (Figure 2.a) but that cannot be identified by XRD because of the absence of diffraction peaks.
In the “S1-Sat” tests (Figure 1.b), the same evolution of the altered glass thicknesses as a function of pH as in the “S1-Blk” tests is observed: a decrease between pH90°C = 3 and pH90°C
155
= 9.5 and an increase beyond that point. However, it should be noted that eTh(B) at pH90°C =
3 is slightly higher than at pH90°C = 1. From pH90°C = 9.5, only the boron concentration of the
last sample at 1 year could be measured because of the high dilution to be made due to the high silica content of these solutions. This result motivated a second test series conducted at higher S/V ratio (section 3.2). Finally, only small amounts of phyllosilicate-like secondary 160
Figure 1: Evolution of the equivalent thicknesses of altered glass calculated from boron concentrations, eTh(B),
for the (a) S1-Blk and (b) S1-Sat test series conducted with an S/V ratio of 60 m-1. Dotted line represents the total
alteration of the glass (%AG = 100). Zoomed-in subfigures are given in Appendix B.
165
Figure 2: Secondary electrons scanning electron microscope images after 1 year in tests (a) S1-Blk-10.1 and (b)
S1-Sat-10.1. 0 10 20 30 40 50 60 0 100 200 300 400 e T h (B) (µm ) time (d) S1-Blk-3 S1-Blk-7 S1-Blk-9.5 S1-Blk-10.1 (a) 0 5 10 15 20 25 30 35 0 100 200 300 400 e T h (B) (µm ) time (d)
S1-Sat-1 S1-Sat-3 S1-Sat-7 S1-Sat-8 S1-Sat-9 S1-Sat-9.5 S1-Sat-9.8 S1-Sat-10.1 S1-Sat-10.3
(b)
2 µm
(a)
200 nm
Time (d) S1-Sat-1 S1-Blk-3 S1-Sat-3 S1-Blk-7 S1-Sat-7 S1-Sat-8 S1-Sat-9 S1-Blk-9.5 S1-Sat-9.5 S1-Sat-9.8 S1-Blk-10.1 S1-Sat-10.1 S1-Sat-10.3 0 3.1·102 3.3 3.0·102 2.2 1.5·102 1.8·102 2.8·102 5.7 7.4·102 1.3·103 2.4·101 3.8·103 1.2·104 1.2 2.9·102 8.4·101 3.1·102 1.7·101 1.5·102 1.5·102 2.5·102 2.0·101 6.4·102 1.2·103 3.6·101 3.4·103 9.9·103 7.2 3.1·102 3.3·101 3.2·102 5.9·101 1.4·102 1.5·102 2.8·102 3.6·101 6.3·102 1.2·103 6.7·101 3.5·103 1.1·104 14.2 3.4·102 4.6·101 3.1·102 6.3·101 1.4·102 1.5·102 2.5·102 4.2·101 5.9·102 1.2·103 6.7·101 3.4·103 9.7·103 28.2 4.9·102 5.5·101 3.2·102 6.6·101 1.4·102 1.5·102 2.5·102 4.4·101 5.5·102 1.0·103 7.5·101 2.8·103 1.0·104 91.1 5.9·102 9.3·101 3.6·102 7.6·101 1.8·102 1.6·102 2.8·102 6.2·101 NA 1.6·103 1.4·102 NA 1.8·104 364.6 5.6·102 6.0·102 9.5·102 2.5·102 3.3·102 2.6·102 4.7·102 1.4·102 8.4·102 1.3·103 5.1·102 4.0·103 1.2·104
Table 3: Silicon concentrations expressed in g·m-3 for S1 test series (NA: not analyzed).
Time (d) S2-Blk-9.5 S2-Sat-9.5 S2-Blk-9.8 S2-Sat-9.8 S2-Blk-10.1 S2-Sat-10.1 S2-Blk-10.3 S2-Sat-10.3 S2-Blk-10.7 S2-Sat-10.7
0.0 4.3 7.2·102 2.8 1.8·103 2.1 3.8·103 3.0 1.1·104 6.8 3.5·104 1.1 1.9·101 6.3·102 1.0·102 1.2·103 1.5·102 3.5·103 1.1·102 1.0·104 1.8·102 2.7·104 3.0 2.1·101 6.0·102 1.2·102 1.1·103 1.6·102 3.4·103 1.2·102 9.4·103 2.0·102 2.9·104 7.0 1.9·101 6.2·102 1.5·102 1.2·103 1.6·102 3.6·103 1.3·102 9.4·103 2.3·102 2.5·104 14.0 1.9·101 5.5·102 1.9·102 1.3·103 1.5·102 3.3·103 1.2·102 1.0·104 1.9·102 2.5·104 28.1 1.9·101 3.3·102 1.4·102 1.1·103 1.4·102 3.5·102 1.7·102 8.6·103 2.2·102 2.5·104 91.1 1.2·101 5.1·102 1.9·102 9.4·102 1.9·102 3.0·103 2.0·102 8.0·103 2.2·102 2.4·104 379.0 3.6·101 5.5·102 2.2·102 9.5·102 3.2·102 2.1·103 3.5·102 1.1·104 5.2·102 2.5·104
Table 4: Silicon concentrations expressed in g·m-3 for S2 test series. 170
3.2. S2 test series: high S/V ratio
As in the S1 test series, the pH were maintained around the setpoint values during the first 100 days (Figure A.2). However, the pH decreased significantly between 100 days and 1 year without being compensated by alkaline additions. The evolutions of silicon concentrations are given in Table 4. In the “S2-Blk” tests (Figure 3.a, Figure 4.a, Figure 5.a), the equivalent altered 175
thicknesses are close during the first 100 days, increasing slightly with the decrease in pH between 10.7 and 9.5. Between 100 days and a year, only the highest pH (pH90 °C = 10.7)
deviates from this trend by altering more rapidly. The higher altered equivalent thicknesses in this test correlate with the precipitation of secondary phases identified as calcium alumina silicate hydrates by XRD.
180
In the “S2-Sat” test series (Figure 3.b, Figure 4.b, Figure 5.b), larger amounts of secondary phases are identified: oxyhydroxides, silicates, carbonates and zeolites. The more alkaline is the medium, the larger are the amounts of precipitated crystalline phases after 1 year of leaching, and the higher are the equivalent thicknesses of altered glass. In detail (Figure 5):
no diffraction peak is observed at pH90 °C <10.1;
185
at pH90 °C = 10.1: potassium calcium silicon oxide hydrate (PDF 04-012-5493) and
potassium sodium silicon oxide (04-014-8491);
at pH90 °C = 10.3: potassium calcium silicon oxide hydrate (04-012-5493), potassium
hydrogen carbonate (04-013-5503), sodium silicate (00-018-1241), and leucite (00-038-1423);
190
at pH90 °C = 10.7: potassium calcium silicon oxide hydrate (04-012-5493), hydrogen
potassium sodium carbonate hydrate (04-010-8201), shlykovite (00-061-0758), phillipsite K (00-034-0542), and leucite (00-038-1423). In addition, the XRD pattern shows a broad reflection around 30° (2) which is characteristic of CSH [34, 35].
195
Figure 3: Evolution of the equivalent thicknesses of altered glass calculated from boron concentrations, eTh(B), for
the (a) S2-Blk and (b) S2-Sat test series conducted with an S/V ratio of 10 000 m-1. Zoomed-in subfigures are given in
Appendix B.
Figure 4: Secondary electrons scanning electron microscope images after 1 year in tests (a) Blk-10.3 and (b)
S2-200 Sat-10.3. 10 60 110 160 210 260 310 360 0 100 200 300 400 e T h (B) (n m ) time (d) S2-Blk-9.5 S2-Blk-9.8 S2-Blk-10.1 S2-Blk-10.3 S2-Blk-10.7 (a) 0 400 800 1200 1600 2000 0 100 200 300 400 e T h (B) (n m ) time (d)
S2-Sat-9.5 S2-Sat-9.8 S2-Sat-10.1 S2-Sat-10.3 S2-Sat-10.7 (b) 1 µm (a) 20 µm (b)
Figure 5: X-ray diffraction patterns of S2 (a) “Sat” and (b) “Blk” test series. The positions of the major peaks (I ≥
0.3Imax) of the reference diffractograms (PDF-4+ 2018 RDB, database 4.1801) corresponding to the identified phases
are represented: K-Ca-Si oxyhydroxide (PDF 04-012-5493), shlykovite (PDF 00-061-0758), phillipsite-K (PDF
00-034-205
0542), Na-K carbonate (PDF 04-010-8201), leucite (PDF 00-038-1423), K carbonate (PDF 04-013-5503), K-Na-Si oxide (PDF 04-014-8491), and Ca-Al-Si hydrate (PDF 04-011-6291).
4. Discussion
The choice of a “low” S/V ratio for S1 test series was made to maintain as long as possible a large difference in silica concentration between the “S1-Sat” test series (aqueous silica-210
containing solutions) and the “S1-Blk” test series (solutions without silica). However, the results show that this experimental design did not allow for the quantification of the glass alteration in strongly alkaline solutions because of the dilution of the samples—imposed by the high silica concentrations—and required for ICP-OES analysis (e.g. dilution factor > 200 at pH90 °C = 10.3).
To circumvent this shortcoming, S2 test series was conducted with a higher S/V ratio and 215
focused on alkaline pH. It is, however, more difficult to highlight the effect of the initial saturation of the solution with respect to amorphous silica in such conditions because the solution quickly reach saturation due to the greater surface area of glass. As an example, at pH90 °C = 9.8, it is
5 10 15 20 25 30 35 40 45 50 2 Cu-K2(°) (a) 04-011-6291 S2-Blk-10.7 5 10 15 20 25 30 35 40 45 50 2 Cu-K2(°) (b) 04-012-5493 00-061-0758 00-034-0542 04-010-8201 00-038-1423 04-013-5503 00-014-8491 S2-Sat-10.1 S2-Sat-10.3 S2-Sat-10.7
silica at S/V = 60 cm-1 against 0.2 µm at S/V = 10 000 cm-1. Both S1 and S2 test series will be
220
discussed in the following.
In the S1 test series and at pH90 °C = 1, an initial dissolution rate of 3.2 g·m-2·d-1 is calculated
between 0 and 7 days by linear regression (despite the beginning of inflection of the alteration rate). This value can be compared to that extrapolated from data acquired at 90°C by Inagaki, et
al. [36] of ≈ 2.5 g·m-2·d-1. The fact that these two values are very close, added to the comparison
225
of the “S1-Blk” and “S1-Sat” tests at the pH where both tests were carried out jointly (Figure 6.a and Figure C.1) shows that the effect of aqueous silica on the glass dissolution is negligible at pH90 °C ≤ 3. It becomes more significant at pH90 °C = 7: the equivalent thickness of altered glass is
1.5 to 3 times greater when the reaction is conducted in a Si-rich solution (Figure C.1.b). This difference increases very significantly with the pH, from a factor of ≈ 35 at pH90 °C = 9.5 to a
230
factor ≈ 60 at pH90 °C = 10.1. For the two most alkaline pH tested in the S1 test series, the gap
due to the initial presence of aqueous silica should probably be even greater before 1 year because the silicon concentrations in the “S1-Blk” test series at 1 year are high (1.4·102 mg·L-1
at pH90 °C = 9.5 and 5.1·102 mg·L-1 at pH90 °C = 10.1, Table 3). Therefore, it appears from these
tests that aqueous silica acts positively on glass durability from the pH90 °C ≈ 7 threshold and this
235
effect increases with pH, at least up to pH90 °C ≈ 10.1 for this first test series with a low S/V ratio.
This beneficial effect can be interpreted by the quick formation of a passivating layer in the silica-rich solutions [37], while it requires a partial dissolution of the glass in the “Blk” tests to reach saturation.
Unexpectedly, aqueous silica seems to have no direct nor indirect effect on glass alteration in 240
acidic pH. This could be due to several reasons: (i) the rate was calculated from B release; it can be hypothesized that B is preferentially leached out in acidic pH along with alkalis, whose
release from the glass is known to be driven by ion-exchange [38-41], (ii) a passivating gel cannot form because condensation reactions are slower in acidic pH than in basic pH [42].
On the one hand, the first hypothesis is supported by the observation that B and Na are released 245
congruently, following a square root-dependent time law until total alteration of the glass (Figure 7.a). Thus, it is plausible that ion-exchange is responsible for the release of Na and that the penetration of hydronium ions into the glass also drives the hydrolysis of B. At pH90 °C = 3, Si
dissolves approximately 20 times slower than B and Na. The preferential release of B and Na with respect to Si suggests the remaining of a thick Si-rich surface layer. This layer may undergo 250
local reorganization limiting the effect of ion exchange and explaining the square
root-dependence between time and B and Na releases .The observed preferential leaching of B and Na with respect to Si in acidic conditions also explains why the initial Si concentration in solution is not a determinant parameter in acidic systems. By contrast, at pH90 °C = 10.1, the three
elements dissolve almost at the same rate (Figure 7.a). These results suggest that the 255
processes controlling elemental releases into the solution are less coupled in acidic conditions than in the pH90 °C range of 7–9.5 where the release of weakly bonded elements such as Na and
B is strongly affected by hydrolysis-condensation within the silicate network.
On the other hand, the second hypothesis is similar to the one suggested by Daval, et al. [43] to account for the passivating ability of Si-rich layers developed on slow-dissolving wollastonite 260
cleavage planes as opposed to fast-dissolving cleavage planes. More generally, the
non-passivating behavior of silica layers developed in acidic solutions has been previously evidenced by the mineralogical community for a series of Fe-free silicate minerals altered in acidic pH solutions, including wollastonite [44], feldspars [45-47] and forsterite [48]. In particular, Wild, et al. [47] demonstrated that Si-rich layers formed on labradorite switched from non-passivating at 265
pH ≤ 2.5 to passivating at pH > 2.5, indicating that the threshold pH value for passivation is lower for feldspars than for ISG, indicating that there might be a strong coupling between the intrinsic dissolution rate of the parent phase (which increases with decreasing pH, in the acidic pH range) and the rate of the silica layer condensation/polymerization (which decreases with decreasing pH, in the acidic pH range).
The S2 test series, with the higher S/V ratio, sheds a different light compared to those of the first series. Indeed, at pH90 °C = 9.8 and S/V = 10 000 m-1—pH for which it had been shown that the
presence of aqueous silica had a positive effect on the glass durability—, the altered glass fraction is the same, irrespective to the initial aqueous silica concentration of the solution after a year (Figure 6.b and Figure C2). This trend is different at pH90 °C = 10.1, 10.3, and 10.7, where
275
the glass is significantly more altered in silica-rich solutions. Therefore, the passivating layer, whose formation is favored by the initial presence of aqueous silica, is rapidly destabilized. This destabilization could be linked to the precipitation of Si-rich secondary phases: C(A)SH and zeolites—already known to be at the origin of the so-called “resumption of alteration”
phenomenon leading to an acceleration of the glass alteration rate [7, 49]—, carbonates, and 280
also poorly crystallized oxy-hydroxides of silicon, alkaline and alkaline earth which can be sources of elements for the precipitation of zeolites.
For the 3 most alkaline pH of this second test series, a significant difference between the silica concentrations reached in the “Blk” tests (≈ 300 to 500 g·m-3) and those in the pre-saturated
solutions (2·103 to 2.5·104 g·m-3) is observed (Figure 6). This difference increases with pH. At
285
pH90°C = 9.5, the difference is small and it is expected that it would be even smaller at longer
times, as it was demonstrated according to a 14 year-long experiment that the solution at this pH eventually achieve the equilibrium with amorphous silica [50]. This was made possible because no secondary phases precipitated at this pH. Here, because silicate minerals precipitate above pH90°C = 9.5, they partly control the solution composition. Studies conducted at high pH have
290
shown that precipitation of silicate minerals such as CSH and zeolites is not instantaneous and that there is an induction period during which glass dissolves slowly before alteration resumes [7, 49, 51]. During this so-called “plateau regime”, the solution composition is controlled by various amorphous materials whose composition, structure and properties are poorly known [13, 52, 53]. Then, the mechanisms of formation of these materials are pH-dependent, although the 295
Figure 6: Comparison of the equivalent thicknesses of altered glass calculated from boron concentrations, eTh(B), at
300
the last sampling time (≈ 1 year) for the various pH tested for (a) S1 test series and (b) S2 test series. (c) Comparison of the silicon concentrations, C(Si), reached at the end of the experiment (379 d) for the various pH tested for S2 test series. 0 5 10 15 20 25 30 35 40 45 0 2 4 6 8 10 e T h (B) (µm ) pH90 °C S1-Blk-365 d S1-Sat-365 d (a) 0 0,2 0,4 0,6 0,8 1 1,2 1,4 1,6 1,8 2 9 9,5 10 10,5 11 e T h (B) (µm ) pH90 °C S2-Blk-379 d S2-Sat-379 d (b) 100 1000 10000 100000 9 9,5 10 10,5 11 C (Si ) (g ·m -3) pH90 °C S2-Sat S2-Blk (c)
Figure 7: (a) Evolution of the equivalent thicknesses of altered glass, eTh, calculated from boron and sodium
305
concentrations for the S1-Blk-3 test as the function of the square root of time during the first 14 days. (b) Comparison of the evolutions of B, Na, and Si eTh for the S1-Blk-3 (plain symbols) and S1-Blk-10.1 (open symbols) tests. Dotted line represents the total alteration of the glass (%AG = 100).
5. Conclusion
Test series show a negligible effect of aqueous silica at acidic pH and a marked effect beyond 310
pH90 °C = 7 at low reaction progress, ensuring a better glass chemical durability. Thus,
pH-induced changes in solution chemistry shift equilibria. At higher reaction progress and for pH90 °C
≥ 9.5, this effect becomes negative due to the formation of secondary phases (Figure 8). Most of the phases identified are hydroxides, which are likely precursors of better crystalized phases formed by Ostwald ripening.
315 R² = 0,9970 R² = 0,9972 0 5 10 15 20 25 0 2 4 6 e T h (µm )
square root of time (d1/2)
B Na (a) 0,1 1 10 100 0 100 200 300 400 e T h (µm ) time (d1/2) B (pH 3) Na (pH 3) Si (pH 3) B (pH 10.1) Na (pH 10.1) Si (pH 10.1) (b)
Figure 8: Diagram summarizing the effects of dissolved silica and glass dissolution mechanisms as a function of pH.
Acknowledgements
This research was supported by ANDRA. The authors are grateful to Jean-Pierre Mestre for SEM analysis, Géraldine Parisot and the laboratory CEA/DEN/DMRC/SA2I/LMAC for ICP-OES 320
analysis.
References
[1] B. Grambow, Nuclear waste glasses; how durable?, Elements 2(6) (2006) 357-364.
[2] C. Fillet, I. Ribet, S. Gin, S. Peuget, E. Vernaz, Long term behaviour of French R7T7 glass: a short review, Glass Technology - European Journal of Glass Science and Technology Part A 325
49(6) (2008) 302-306.
[3] E. Curti, J.L. Crovisier, G. Morvan, A.M. Karpoff, Long-term corrosion of two nuclear waste reference glasses (MW and SON68): A kinetic and mineral alteration study, Appl. Geochem. 21(7) (2006) 1152-1168.
[4] B.M.J. Thien, N. Godon, A. Ballestero, S. Gin, A. Ayral, The dual effect of Mg on the long-330
term alteration rate of AVM nuclear waste glasses, J. Nucl. Mater. 427(1-3) (2012) 297-310. [5] H. Arena, N. Godon, D. Rebiscoul, R. Podor, E. Garces, M. Cabie, J.P. Mestre, Impact of Zn, Mg, Ni and Co elements on glass alteration: Additive effects, Journal of Nuclear Materials 470 (2016) 55-67.
[6] H. Aréna, N. Godon, D. Rébiscoul, P. Frugier, R. Podor, E. Garcès, M. Cabie, J.P. Mestre, 335
Impact of iron and magnesium on glass alteration: Characterization of the secondary phases and determination of their solubility constants, Appl. Geochem. 82 (2017) 119-133.
[7] M. Fournier, S. Gin, P. Frugier, S. Mercado-Depierre, Contribution of zeolite seeded
experiments to the understanding of resumption of glass alteration, npj Mater. Degrad. 1 (2017) 17.
340
[8] E. Burger, D. Rebiscoul, F. Bruguier, M. Jublot, J.E. Lartigue, S. Gin, Impact of iron on nuclear glass alteration in geological repository conditions: A multiscale approach, Appl. Geochem. 31 (2013) 159-170.
[9] B. Fleury, N. Godon, A. Ayral, S. Gin, SON68 glass dissolution driven by magnesium silicate precipitation, J. Nucl. Mater. 442(1) (2013) 17-28.
[10] L. Neill, S. Gin, T. Ducasse, T. De Echave, M. Fournier, P. Jollivet, A. Gourgiotis, N.A. Wall, Various effects of magnetite on international simple glass (ISG) dissolution: implications for the long-term durability of nuclear glasses, npj Mater. Degrad. 1(1) (2017) 1.
[11] T. De Echave, M. Tribet, P. Jollivet, C. Marques, S. Gin, C. Jégou, Effect of clayey
groundwater on the dissolution rate of SON68 simulated nuclear waste glass at 70 °C, J. Nucl. 350
Mater. 503 (2018) 279-289.
[12] P. Frugier, S. Gin, Y. Minet, T. Chave, B. Bonin, N. Godon, J.E. Lartigue, P. Jollivet, A. Ayral, L. De Windt, G. Santarini, SON68 nuclear glass dissolution kinetics: Current state of knowledge and basis of the new GRAAL model, J. Nucl. Mater. 380(1-3) (2008) 8-21.
[13] P. Frugier, Y. Minet, N. Rajmohan, N. Godon, S. Gin, GRAAL, a model for glass corrosion, 355
npj Mater. Degrad. submitted (2018).
[14] P. Van Iseghem, M. Aertsens, S. Gin, D. Deneele, B. Grambow, D. Strachan, P. McGrail, G. Wicks, GLAMOR - Or how we achieved a common understanding on the decrease of glass dissolution kinetics, Ceram. Trans. 207(s) (2009) 115-126.
[15] J.P. Icenhower, B.P. McGrail, W.J. Shaw, E.M. Pierce, P. Nachimuthu, D.K. Shuh, E.A. 360
Rodriguez, J.L. Steele, Experimentally determined dissolution kinetics of Na-rich borosilicate glass at far from equilibrium conditions: Implications for Transition State Theory, Geochim. Cosmochim. Acta 72(12) (2008) 2767-2788.
[16] J. Neeway, A. Abdelouas, B. Grambow, S. Schumacher, Dissolution mechanism of the SON68 reference nuclear waste glass: New data in dynamic system in silica saturation 365
conditions, J. Nucl. Mater. 415(1) (2011) 31-37.
[17] S. Gin, P. Frugier, P. Jollivet, F. Bruguier, E. Curti, New insight into the residual rate of borosilicate glasses: Effect of S/V and glass composition, Int. J. Appl. Glass Sci. 4(4) (2013) 371-382.
[18] S. Gin, P. Frugier, SON68 glass dissolution kinetics at high reaction progress: Experimental 370
evidence of the residual rate, Mater. Res. Soc. Symp. Proc. 757 (2003) II5.9.
[19] T. Advocat, J.L. Chouchan, J.L. Crovisier, C. Guy, V. Daux, C. Jegou, S. Gin, E. Vernaz, Borosilicate nuclear waste glass alteration kinetics: Chemical inhibition and affinity control, Mater. Res. Soc. Symp. Proc. 506 (1998) 63-70.
[20] P. Jollivet, S. Gin, S. Schumacher, Forward dissolution rate of silicate glasses of nuclear 375
interest in clay-equilibrated groundwater, Chem. Geol. 330-331 (2012) 207-217. [21] S. Mercado-Depierre, F. Angeli, F. Frizon, S. Gin, Antagonist effects of calcium on borosilicate glass alteration, J. Nucl. Mater. 441(1) (2013) 402-410.
[22] T. Chave, P. Frugier, S. Gin, A. Ayral, Glass-water interphase reactivity with calcium rich solutions, Geochim. Cosmochim. Acta 75(15) (2011) 4125-4139.
380
[23] P. Jollivet, P. Frugier, G. Parisot, J.P. Mestre, E. Brackx, S. Gin, S. Schumacher, Effect of clayey groundwater on the dissolution rate of the simulated nuclear waste glass SON68, J. Nucl. Mater. 420(1-3) (2012) 508-518.
[24] H. Aréna, D. Rébiscoul, R. Podor, E. Garcès, M. Cabie, J.P. Mestre, N. Godon, Impact of Fe, Mg and Ca elements on glass alteration: Interconnected processes, Geochim. Cosmochim. 385
Acta 239 (2018) 420-445.
[25] B. Craeye, G. De Schutter, H. Van Humbeeck, A. Van Cotthem, Concrete containers for containment of vitrified high-level radioactive waste: The Belgian approach, CRC Press-Taylor & Francis Group, Boca Raton, 2009.
[26] S. Gin, A. Abdelouas, L.J. Criscenti, W.L. Ebert, K. Ferrand, T. Geisler, M.T. Harrison, Y. 390
Inagaki, S. Mitsui, K.T. Mueller, J.C. Marra, C.G. Pantano, E.M. Pierce, J.V. Ryan, J.M.
Schofield, C.I. Steefel, J.D. Vienna, An international initiative on long-term behavior of high-level nuclear waste glass, Mater. Today 16(6) (2013) 243-248.
[27] S. Gin, P. Jollivet, M. Fournier, C. Berthon, Z. Wang, A. Mitroshkov, Z. Zhu, J.V. Ryan, The fate of silicon during glass corrosion under alkaline conditions: A mechanistic and kinetic study 395
[30] ASTM International, Standard test method for silica in water, ASTM Standard S859, West Conshohocken, PA, United-States, 2010.
[31] S. Depierre, Etude des mécanismes d'altération du verre par des eaux cimentaires, Thèse de l'Université Montpellier 2, 2012.
[32] B. Thien, N. Godon, F. Hubert, F. Angéli, S. Gin, A. Ayral, Structural identification of a 405
trioctahedral smectite formed by the aqueous alteration of a nuclear glass, Appl. Clay Sci. 49(3) (2010) 135-141.
[33] C. Zhu, D.R. Veblen, A.E. Blum, S.J. Chipera, Naturally weathered feldspar surfaces in the Navajo Sandstone aquifer, Black Mesa, Arizona: Electron microscopic characterization,
Geochim. Cosmochim. Acta 70(18) (2006) 4600-4616. 410
[34] J.R. Houston, R.S. Maxwell, S.A. Carroll, Transformation of meta-stable calcium silicate hydrates to tobermorite: reaction kinetics and molecular structure from XRD and NMR spectroscopy, Geochem. Trans. 10 (2009).
[35] J.M. Fernández, A. Duran, I. Navarro-Blasco, J. Lanas, R. Sirera, J.I. Alvarez, Influence of nanosilica and a polycarboxylate ether superplasticizer on the performance of lime mortars, 415
Cem. Concr. Res. 43 (2013) 12-24.
[36] Y. Inagaki, T. Kikunaga, K. Idemitsu, T. Arima, Initial dissolution rate of the International Simple Glass as a function of pH and temperature measured using microchannel flow-through test method, Int. J. Appl. Glass Sci. 4(4) (2013) 317-327.
[37] S. Gin, P. Jollivet, M. Fournier, F. Angeli, P. Frugier, T. Charpentier, Origin and 420
consequences of silicate glass passivation by surface layers, Nat. Commun. 6 (2015) 6360. [38] S. Mitsui, R. Aoki, Effect of a siliceous additive on aqueous alteration of waste glass with engineered barrier materials, J. Nucl. Mater. 298(1-2) (2001) 184-191.
[39] K. Ferrand, A. Abdelouas, B. Grambow, Water diffusion in the simulated French nuclear waste SON 68 contacting silica rich solutions: Experimental and modeling, J. Nucl. Mater. 355 425
(2006) 54-67.
[40] M.I. Ojovan, A. Pankov, W.E. Lee, The ion exchange phase in corrosion of nuclear waste glasses, J. Nucl. Mater. 358(1) (2006) 57-68.
[41] B.C. Bunker, Molecular mechanisms for corrosion of silica and silicate glasses, J. Non-Cryst. Solids 179 (1994) 300-308.
430
[42] R.K. Iler, The Chemistry of Silica: Solubility, Polymerization, Colloid and Surface Properties, and Biochemistry of Silica, John Wiley & Sons Inc.1979.
[43] D. Daval, S. Bernard, L. Rémusat, B. Wild, F. Guyot, J.S. Micha, F. Rieutord, V. Magnin, A. Fernandez-Martinez, Dynamics of altered surface layer formation on dissolving silicates,
Geochim. Cosmochim. Acta 209 (2017) 51-69. 435
[44] D. Daval, I. Martinez, J.-M. Guigner, R. Hellmann, J.r.m. Corvisier, N. Findling, C. Dominici, B. Goffé, F.o. Guyot, Mechanism of wollastonite carbonation deduced from micro- to nanometer length scale observations, Am. Mineral. 94(11-12) (2009) 1707-1726.
[45] G. Jordan, S.R. Higgins, C.M. Eggleston, S.M. Swapp, D.E. Janney, K.G. Knauss, Acidic dissolution of plagioclase: in-situ observations by hydrothermal atomic force microscopy, 440
Geochim. Cosmochim. Acta 63(19) (1999) 3183-3191.
[46] R. Hellmann, J.M. Penisson, R.L. Hervig, J.H. Thomassin, M.F. Abrioux, An
EFTEM/HRTEM high-resolution study of the near surface of labradorite feldspar altered at acid pH: evidence for interfacial dissolution-reprecipitation, Phys. Chem. Miner. 30(4) (2003) 192-197.
445
[47] B. Wild, D. Daval, F. Guyot, K.G. Knauss, M. Pollet-Villard, G. Imfeld, pH-dependent control of feldspar dissolution rate by altered surface layers, Chem. Geol. 442 (2016) 148-159.
[48] G.D. Saldi, D. Daval, G. Morvan, K.G. Knauss, The role of Fe and redox conditions in olivine carbonation rates: An experimental study of the rate limiting reactions at 90 and 150°C in open and closed systems, Geochim. Cosmochim. Acta 118 (2013) 157-183.
450
[49] M. Fournier, S. Gin, P. Frugier, Resumption of nuclear glass alteration: State of the art, J. Nucl. Mater. 448(1-3) (2014) 348-363.
[50] S. Gin, X. Beaudoux, F. Angéli, C. Jégou, N. Godon, Effect of composition on the short-term and long-term dissolution rates of ten borosilicate glasses of increasing complexity from 3 to 30
[51] S. Mercado-Depierre, M. Fournier, S. Gin, F. Angeli, Influence of zeolite precipitation on borosilicate glass alteration under hyperalkaline conditions, J. Nucl. Mater. 491 (2017) 67-82. [52] W.L. Bourcier, D.W. Peiffer, K.G. Knauss, K.D. McKeegan, D.K. Smith, A kinetic model for borosilicate glass dissolution affinity of a surface alteration layer., Mater. Res. Soc. Symp. Proc. 176 (1989) 209-216.
460
[53] I. Munier, J.L. Crovisier, Alteration of Si-B-Na-Al model glass in water at 90 °C: experiments and thermodynamic modelling, Mater. Res. Soc. Symp. Proc. 757 (2003) 153-158.
Appendix A
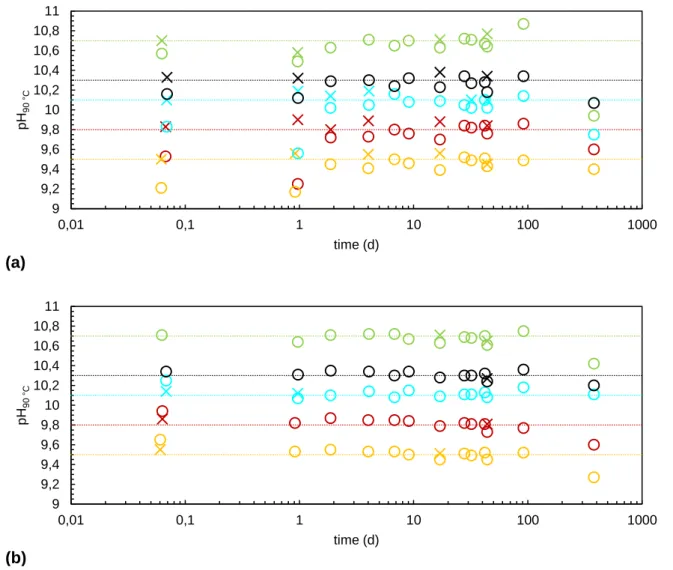
In the tests conducted in this study, the pH was manually regulated around a set value. Figures 465
A.1 (for S1 test series) and A.2 (for S.2 test series) show the different setpoint pH (dashed lines), the measured pH (circles) and the pH reached after addition of micro-volumes of KOH or HNO3
solutions if necessary (crosses).
470
Figure A.1: pH measured in S1 test series (a) “Blk” and (b) “Sat” before regulation () and after regulation () around set values (dotted lines) at pH90 °C = 1 (green), 3 (red), 7 (pink), 8 (blue), 9 (purple), 9.5 (orange), 9.8 (dark
red), 10.1 (light blue), and 10.3 (black). 2 3 4 5 6 7 8 9 10 11 0,1 1 10 100 1000 pH 90 °C time (d) (a) 0 2 4 6 8 10 0,1 1 10 100 1000 pH 90 °C time (d) (b)
475
Figure A.2: pH measured in S2 test series (a) “Blk” and (b) “Sat” before regulation () and after regulation () around set values (dotted lines) at pH90 °C = 9.5 (orange), 9.8 (dark red), 10.1 (light blue), and 10.3 (black), and 10.7
(light green). 9 9,2 9,4 9,6 9,8 10 10,2 10,4 10,6 10,8 11 0,01 0,1 1 10 100 1000 pH 90 °C time (d) (a) 9 9,2 9,4 9,6 9,8 10 10,2 10,4 10,6 10,8 11 0,01 0,1 1 10 100 1000 pH 90 °C time (d) (b)
Appendix B
Zoomed-in subfigures of Figure 1 and Figure 3 are given in Figure B.1 and Figure B.2, 480
respectively.
Figure B.1: Zoomed-in subfigures of (a) Figure 1.a and (b) Figure 1.b.
Figure B.1: Zoomed-in subfigures of (a) Figure 3.a and (b) Figure 3.b.
485 0 0,4 0,8 1,2 1,6 2 0 100 200 300 400 e T h (B) (µm ) time (d)
S1-Sat-8 S1-Sat-9 S1-Sat-9.5 S1-Sat-9.8 S1-Sat-10.1 S1-Sat-10.3
(b) 0 2 4 6 8 10 12 14 0 100 200 300 400 e T h (B) (µm ) time (d) S1-Blk-7 S1-Blk-9.5 S1-Blk-10.1 (a) 10 30 50 70 90 110 130 150 0 100 200 300 400 e T h (B) (n m ) time (d) S2-Blk-9.5 S2-Blk-9.8 S2-Blk-10.1 S2-Blk-10.3 S2-Blk-10.7 (a) 0 50 100 150 200 250 300 0 100 200 300 400 e T h (B) (n m ) time (d)
S2-Sat-9.5 S2-Sat-9.8 S2-Sat-10.1 S2-Sat-10.3 S2-Sat-10.7
Appendix C
A direct comparison between the “Blk” and “Sat” tests for the two test series of tests at all sampling dates is shown in Figures C.1 and C.2.
490
Figure C.1: Comparative evolution of the equivalent thicknesses of altered glass calculated from boron
concentrations, eTh(B), for S1 test series conducted with a S/V ratio of 60 m-1 at pH
90 °C equal to (a) 3, (b) 7, (c) 9.5, and (d) 10.1. 0 5 10 15 20 25 30 35 40 45 0 100 200 300 400 e T h (B) (µm ) time (d) S1-Blk-3 S1-Sat-3 (a) 0 1 2 3 4 5 6 7 8 9 10 0 100 200 300 400 e T h (B) (µm ) time (d) S1-Blk-7 S1-Sat-7 (b) 0 0,2 0,4 0,6 0,8 1 1,2 1,4 1,6 1,8 2 0 100 200 300 400 e T h (B) (µm ) time (d) S1-Blk-9.5 S1-Sat-9.5 (c) 0 2 4 6 8 10 12 14 0 100 200 300 400 e T h (B) (µm ) time (d) S1-Blk-10.1 S1-Sat-10.1 (d)
495
Figure C.2: Comparative evolution of the equivalent
500
thicknesses of altered glass calculated from boron
concentrations, eTh(B), for S2 test series conducted with a
S/V ratio of 10 000 m-1 at pH 90 °C equal to (a) 9.5, (b) 9.8, (c) 10.1, (d) 10.3, and (e) 10.7. 0 50 100 150 200 250 0 100 200 300 400 e T h (B) (n m ) time (d) S2-Blk-9.5 S2-Sat-9.5 (a) 0 20 40 60 80 100 120 0 100 200 300 400 e T h (B) (n m ) time (d) S2-Blk-9.8 S2-Sat-9.8 (b) 0 50 100 150 200 250 0 100 200 300 400 e T h (B) (n m ) time (d) S2-Blk-10.1 S2-Sat-10.1 (c) 0 50 100 150 200 250 300 350 0 100 200 300 400 e T h (B) (n m ) time (d) S2-Blk-10.3 S2-Sat-10.3 (d) 0 200 400 600 800 1000 1200 1400 1600 1800 2000 0 100 200 300 400 e T h (B) (n m ) time (d) S2-Blk-10.7 S2-Sat-10.7 (e)