HAL Id: cea-01778337
https://hal-cea.archives-ouvertes.fr/cea-01778337
Submitted on 13 Feb 2019
HAL is a multi-disciplinary open access
archive for the deposit and dissemination of sci-entific research documents, whether they are pub-lished or not. The documents may come from teaching and research institutions in France or abroad, or from public or private research centers.
L’archive ouverte pluridisciplinaire HAL, est destinée au dépôt et à la diffusion de documents scientifiques de niveau recherche, publiés ou non, émanant des établissements d’enseignement et de recherche français ou étrangers, des laboratoires publics ou privés.
digitizing pen
Jean-Pierre Nikolovski, Danièle Fournier
To cite this version:
Jean-Pierre Nikolovski, Danièle Fournier. 250 DPI at 1000 Hz acquisition rate S_0 lamb wave dig-itizing pen. IEEE Transactions on Ultrasonics, Ferroelectrics and Frequency Control, Institute of Electrical and Electronics Engineers, 2013, 60 (2), pp.380 - 394. �10.1109/TUFFC.2013.2574�. �cea-01778337�
0885–3010/$25.00 © 2013 IEEE
250 DPI at 1000 Hz Acquisition Rate
S
0
Lamb Wave Digitizing Pen
Jean-Pierre nikolovski and danièle Fournier Abstract—This paper presents an active stylus (X, Y) flat
digitizing tablet (AST). The tablet features an acquisition rate of 1000 pts/s with 0.1 mm resolution. The cordless stylus in-corporates a 1-mA low-power pulse generator. Precision is lim-ited by diffraction to about ±0.3 mm on a 57 × 57 mm region of a 71 × 71 × 1 mm digitizing plate. Selective generation and detection of the S0 Lamb mode with a precessing tip is the key feature of this tablet. We first highlight the ultrasonic propaga-tion inside the stylus tip and stability of Lamb wave generapropaga-tion when the stylus is inclined, rotated, and slid. Then, modeling of the limitations imposed by diffraction of a 1-MHz burst S0 plane Lamb wave packet is carried out. The model takes into account high-order zero crossing detection as well as reflections and shear horizontal (SH) conversions of the S0 Lamb mode at free edges of a glass plate. Reflection and transmission through an isotropic PZT bar are also calculated. Finally, localization precision by time difference of arrival (TDOA) is calculated and experimentally verified near the borders of the plate, tak-ing into account the angular sensitivity of the precesstak-ing tip.
I. Introduction
a
human–computer interface (HcI) may take various forms. With the advent of portable personal digital assistants (Pdas), smartphones, and tablet Pcs, the tra-ditional keyboard is being replaced by multi-touch or sty-lus-based input solutions that are perceived as being more user-friendly. The interface is often a transparent plate placed in front of a display [1]. successful touch- and/or pen-based technologies are currently encountered in many hand-held display products. The first hand-held touch technologies such as Pdas were resistive soft films that ac-cepted both finger touch and stylus based interactions [1]. However, this multi-modal input technology must comply with contradictory design constraints requiring both sen-sitivity to low-pressure touch interactions associated with finger touch and high-pressure interactions coming from point-like forces imposed by passive stylus tips. Its result-ing weaknesses are low immunity to scratches and a hard-to-avoid force activation threshold that limits detection of light and swift movements. alternately, a method for capacitive sensing of a space- and time-variable physical value such as touch pressure with a network of capacitors was already available almost three decades ago but did notallow precise pen use [2]. More recently at apple, a surface capacitive network with a charge transfer measuring tech-nique was proposed to develop multi-hand interactions [3], and with the strong growth of projected capacitive tech-nology, finger touch technologies produce 2-d multi-touch images, often with pre-touch detection [4], [5]. This advan-tageous feature has already harmed the market share of touch resistive technology. However, multitouch capacitive technology is not the ultimate paradigm and there is still a need for a precise input stylus. In this regard, with its smart inductive stylus and near touch detection, the com-pany Wacom has entered the smartphone market, turn-ing pressure into an additional writturn-ing parameter used for example to obtain thicker drawing lines [6]. Multimodal stylus and finger touch detection is a step forward in the development of high-end HcI products. Finger pre-touch localization can be obtained with a projected capacitive technology working at an operating frequency of 250 kHz, whereas cordless stylus pre-touch localization is obtained with an electromagnetic inductive technology operating at a radiating frequency of 500 kHz [7]. Finger pressure measurement can be done with a pressure sensitive sensor such as resistive film, completing a pre-touch and touch capacitive network [8]. stylus pressure measurement can be implemented with a flexible variable capacitor C in-corporated in the housing of an inductive LC resonant cordless stylus [9].
consequently, other non-2-d distribution input devices being developed must exhibit key technical features to re-main competitive alternative solutions or at least solu-tions that can be combined with successful ones. In the acoustic domain, we do not currently see many products that combine both stylus- and finger-based input solu-tions in a single HcI. In 2002, Ing et al. patented [10] an acoustic cross-correlation process for locating small finger impacts or scratches and producing sensitive objects or display products. Touchless detection and interpretation of proximity movements can also be done by ultrasonic means, as patented by dahl et al. [11] and Hotelling et
al. [12].
The oldest acoustic coordinate pen input technologies can be traced back to the 1960s. In 1964, at IbM, Woo [13] proposed a synchronous saW digitizing tablet with lucite wedges (duPont corp., Wilmington, dE) to con-vert longitudinal waves into saWs and a sharp pen tip in the form of a thumb tack. In 1969, Whetstone et al. [14] proposed a stylus with a shock wave that was gen-erated by a capacitor discharge and that propagated in the air medium to two (2-d) or three (3-d) long capaci-tive microphones located along the edges of the working
Manuscript received august 1, 2012; accepted october 28, 2012. This work was supported by apple computer, Europe.
J.-P. nikolovski is with cEa, lIsT, sensory and ambient Interfaces laboratory, Fontenay-aux-roses, France (e-mail: jean-pierre.nikolovski@ cea.fr).
d. Fournier is with EsPcI, lPEM, Paris, France. doI http://dx.doi.org/10.1109/TUFFc.2013.2574
volume. He considered sonic solutions in solid propaga-tive media as being functionally limited because of the required contact between the tip and the plate and the expensive tuned emitting and receiving crystals. In 1987, Mallicoat proposed a smart stylus graphic input system [15] for measuring the transit times of in-air ultrasonic signals and an electromagnetic signal used as a means of synchronization. He used only two alternating transmit-ting transducers at 23 kHz and a stylus incorporatransmit-ting a receiving microphone and an lEd transmitting element. The lEd was used both for time delay measurement and for coding color. The inclination of the stylus is a problem of this measuring principle using air as the propagative medium. It is also a concern for Wacom’s inductive stylus. For the air medium, in 1998, Ward et al. [16] proposed an ultrasonic stylus with double frequency sources at 40 and 60 kHz superposed in the stylus body to obtain two distance measurements and compensate for the inclination of the stylus.
considering the tablet as the ultrasonic propagation medium, in 1987, adler and desmares improved the ray-leigh wave approach [17] by limiting the number of trans-ducers surrounding the panel and replacing them with weighted reflective array strips placed along the panel edg-es while still maintaining a good signal-to-noise ratio. In 1989, dieulesaint et al. [18] proposed a glass touch screen based on an oscillating bulk acoustic wave delay line grid. curiously enough, saW touch technology has been regu-larly improved over the years with regard to its ability to work with a limited number of transducers operating in some cases with non-orthogonal beams, as demonstrated by Kent [19], but in the process has also lost the ability to work with a stylus. This probably results from the ap-plication for which saW is usually appropriate, namely point of sales, which does not require a stylus.
Using a tablet as the substrate propagating bulk acous-tic waves (baW), on december 30, 1982, Glenn [20] filed a patent for a synchronous ultrasonic stylus with a horn tip and two receiver bars bonded to the side faces of a plate, and hence adapted to the detection of a0 lamb modes. He proposed measuring the signal amplitude as a means of changing the line width of a drawing. on december 21, 1984, billmann et al. [21] filed a patent for a similar tablet which also had a synchronous stylus. In their docu-ment, they suggested covering the surface with a lubricat-ing layer such as oil, and topplubricat-ing the stylus vertex with a soft material such as rubber to ease the sliding. both sug-gestions were also good for reducing some annoying phase inversion aspects related to the inclination of the stylus, although this was not mentioned in the patent. regard-ing this problem, a few months earlier, on July 25, 1984, sato et al. patented [22] an s0 lamb wave writing tablet together with a solution to solve the problem of phase inversion at the leading edge of the s0 lamb mode when an emitting stylus is inclined by adding two layers at the surface of the glass plate or a soft layer covering the tip of the stylus to filter out the mechanical component of
vibra-tion responsible for the phase inversion. This problem was also exposed by okada and Inose in a later paper [23].
The company canon did also extensive research on a lamb wave writing tablet adapted to the dispersive a0 lamb mode based on the detection and filtering of the envelope of a long wave packet created by resonance of a horn or conical tip, as presented, for example, in the pat-ent of Kobayashi et al. [24].
all the vibrating styli found in the literature feature an emitting stylus whose tip vibrates with a movement parallel to the axis of the stylus. With only one key patent on the subject, Hitachi gave up this field rather quickly. at canon, more than 30 Us patents were filed between 1988 and 2002, starting with suzuki et al. in 1988 [25], who designed a writing tablet with three receivers and an axial vibrating tip and a method for detecting the enve-lope peak of a synchronous a0 lamb wave packet.
as can be seen from this introduction, lamb wave in-put styli have been challenged for more than 30 years by strong technical difficulties that call into question the ad-equacy of the plate as an appropriate means of coordinate measurement. Ultimately, touchless two-handed vision-based input devices such as the one proposed by Malik and laszlo in 2004, which used a camera filming the hands of a user over a table, could be adopted as the cleanest working environment [26].
In this context, this paper presents a work started in 1991 [27] on a thin s0 lamb wave pen tablet that could be combined with recent work on acoustic touch technolo-gies such as the amplitude disturbed diffraction method (addP) [28], [29], featuring distinct lower operating fre-quencies in the 10 to 100 kHz range and double-touch capability [30]. In this scenario, and by analogy with the Wacom approach, the 5-μa low-power pen presented in this paper could get its energy directly from the actively vibrating surface by the piezoelectric effect.
The next sections will present first the operating prin-ciple of the tablet and then broadband lamb wave gen-eration and detection efficiency dependency according to the form of the tip and the handling of the stylus. dif-fraction limitations in burst conditions are investigated, taking into consideration reflection and shear horizontal (sH) conversion at the edges of the plate. The paper is completed with the modeling and experimental measure-ment of the time difference of arrival (Tdoa) diffraction limits with this type of ultrasonic pen.
II. operating Principle
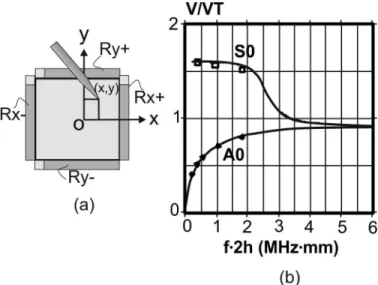
The (x, y) coordinates are calculated by measuring the time difference of arrival of a wave packet propagating in a glass plate. The emitter is the stylus tip, which incorpo-rates a small source of energy and a piezoelectric trans-ducer that launches burst wave packets that propagate to its vertex at a rate of 1000 bursts per second. Four receiver bars are bonded to the four edges of the plate, as
illustrated in Fig. 1(a). The (x, y) coordinates of the stylus are derived from the formula
x t t v y t t v x x s y y s = − = − − + − + ( ( ) ) ∆ ∆ ∆ ∆ 0 0 2 2 , (1)
where Δt is the transit time between the stylus vertex and one of the four corresponding receivers, and vs is the lamb wave symmetric s0 mode velocity. This mode is pre-ferred to the first antisymmetric lamb mode a0 because it is nondispersive, as can be seen in Fig. 1(b). These two modes are the only ones that can propagate in an isotropic plate of thickness 2h at low frequencies. The im-portant parameters are the transversal and longitudinal wave velocities VT and VL, respectively, Poisson’s ratio
σ, young’s modulus E, and density ρ. one could argue
that working with a0 could be more interesting because of its lower propagation speed and, hence, higher poten-tial resolution; however, as mentioned in the introduction, this path has been explored at canon for more than a decade. also, from (1), we can see that it takes only a 27-MHz clock frequency to reach a resolution of 0.1 mm if the s0 mode velocity is 5.4 mm/μs, as is the case for a 1-mm-thick b270 glass plate. additionally, acquiring 1000 points/s makes it possible to average the random quan-tization error and increase the resolution by a factor of three while still operating at 100 points/s. another ap-proach could be to lower the clock frequency to 9 MHz while maintaining the 250 dpi target resolution. Moreover, the low speed of a0 is not the only important parameter because inaccurate measurements may appear when one writes with swift movements or during inclination or ro-tation of the stylus about its axis. These errors depend
greatly on the vibration properties of the tip, as will be presented in the next section. also, the path chosen by Hi-tachi or canon with an axial vibration of the tip may not be the best method for efficiently transmitting a broad-band mechanical pulse through a point-like touch into the tablet substrate.
III. Vibration Properties of the Tip
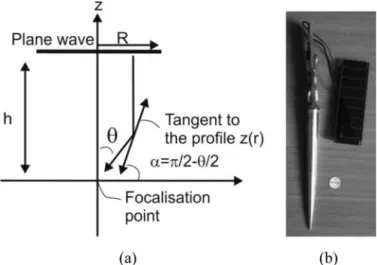
To optimize power consumption, the stylus tip must efficiently transfer its vibrating energy to its vertex and from its vertex into a selective lamb mode. In this regard, the profile of the cone plays a key role, as illustrated in Figs. 2 and 3. First, if we consider a plane longitudinal wave propagating inside the tip, there are reasons why
Fig. 1. (a) lamb wave digitizing tablet operating principle. (b) s0 and a0 lamb mode phase velocities in b270 type glass with VT = 3390 m/s;
VL = 5650 m/s; σ = 0.219; E = 71.5 kn/mm2; ρ = 2550 kg/m3. Points and squares are experimental measurements.
Fig. 2. s0 generation efficiency in a glass plate with a duralumin tip. (a) shear wave dispersion versus cone aperture, (b) s0 generation with a conical tip, and (c) s0 generation with a parabolic tip.
longitudinal waves have difficulty reaching the vertex of the tip:
1) snell’s law of refraction implies mode conversion from longitudinal to transversal waves.
2) For transversal waves, the angle of incidence onto the generatrix of a horn or a cone increases as the num-ber of internal reflections increases [31]. Theoreti-cally off-axis rays launched from a plane base in a di-rection parallel to the axis never reach the apex and bounce back after several reflections that depend on the aperture of the tip. This is clearly visible on the first echo in tips of various apertures, as illustrated in Fig. 2(a), when a 100-V pulse of width 0.2 μs is applied to a V154-type 2.25-MHz shear wave trans-ducer (Panametrics ndE, Waltham, Ma).
consequently, if most of the energy bounces back be-fore reaching the apex, then lamb wave generation is poor and most of the electrical energy is wasted. Moreover elec-tromechanical impulse response within the tip turns into a long trace, as can be seen with the exponential horn. on the contrary, if the cone aperture is narrow, then most of a shear wave propagating inside the tip reaches the apex and s0 lamb wave generation efficiency increases. Figs.
2(c) and 3 present one of the best results obtained for s0
lamb wave generation. Fig. 3 illustrates the fact that the best profile for focusing a plane shear wave so that its fo-cal point is as close as possible to the apex is a long para-bolic tip. Fig. 2(c) shows how well the first echo within the tip is attenuated when the apex is in contact with the plate, which indicates good focusing efficiency. The 800-kHz central frequency of the first echo indicates sufficient broadband capability. s0 lamb wave generation with a
parabolic tip reaches 17 Vpp, compared with 1.5 Vpp with a conical tip of half aperture θ = 70°. This result is all the more interesting because the base surface of the cone is
about four times larger than that of the parabolic tip. In this setup, the plate is a 71 × 71 × 1 mm b270-type glass with flat polished edges, onto which 70 × 1 × 1.05 mm lead zirconate titanate (PZT) P160 bars from quartz et silice s.a. (courbevoie, France) are bonded with cyanoac-rylate glue. The bars are bonded with the poling direction perpendicular to the edge. The parallel central resonance frequency measured in a high-impedance load condition is 1.32 MHz. The series resonance frequency measured in low-impedance conditions is 1.19 MHz. The receiver bar with its transimpedance amplifier is thus optimized for detecting s0 lamb waves at a central operating frequency of 1.19 MHz. In this regard, the cutoff frequency of the parabolic tip could be increased slightly to optimize emit-ter–receiver matching. Fig. 3(b) is a picture of a duralu-min parabolic tip incorporating a four-PZT piezo-element and a 5-μa solar pulse generator working at a pulse fre-quency of 1000 Hz.
IV. Inclination/rotation/sliding of the Tip once the tip profile is optimized for efficiently focusing the shear wave at the vertex, the next step is to design a low-cost piezo-element that generates s0 lamb waves ef-ficiently. This is obtained with a PZT disc comprising two opposite poling areas, as illustrated in Fig. 4. This piezo-element is driven at its radial resonance frequency. This design creates bending waves of the same kind as those obtained with the shear wave V154 type, but at a central frequency of 700 kHz, which is much closer to the receiver bar maximum sensitivity of 1.2 MHz. The next step is to investigate a0 and s0 lamb wave properties according to the basic handling operations of the stylus, namely incli-nation, rotation, and sliding of the tip above the surface.
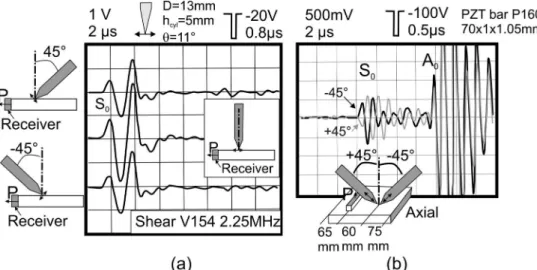
A. Inclination
In these experiments, the profile of the tip is conical with half aperture θ = 11°. Fig. 4 presents the global be-havior with respect to the inclination of a shear wave sty-lus when the receiver PZT bar is bonded at the surface of the plate and is mainly sensitive to the normal component of displacement. obviously, s0 lamb mode generation exhibits little dependency on inclination, whereas phase inversion occurs with a0 and signal amplitude clearly in-creases.
Fig. 5(a) shows the sensitivity to inclination when the receiver bar is bonded to the edge of the plate and is most-ly sensitive to the longitudinal component of vibration. Here again, s0 is only slightly dependent on the inclination of the stylus. The lamb mode a0 is not detected, as can be expected; it is known that its longitudinal component changes sign between the upper and the lower mid-thick-ness of the plate.
Fig. 5(b) shows the sensitivity to inclination when the stylus tip is vibrating axially. This scenario illustrates the
Fig. 3. (a) Plane shear wave focusing condition. (b) resulting parabolic tip with a 5-μa low-power solar pulse generator. by analogy with Wa-com’s remote powering, the stylus could retrieve its energy directly from low-frequency waves available at the surface of the plate.
well-known problem presented in the introduction of s0 phase inversion already observed at Hitachi. In this con-figuration, it can be noticed that a0 is not dependent on inclination. This is, however, not very relevant because a0 is very dispersive.
B. Rotation
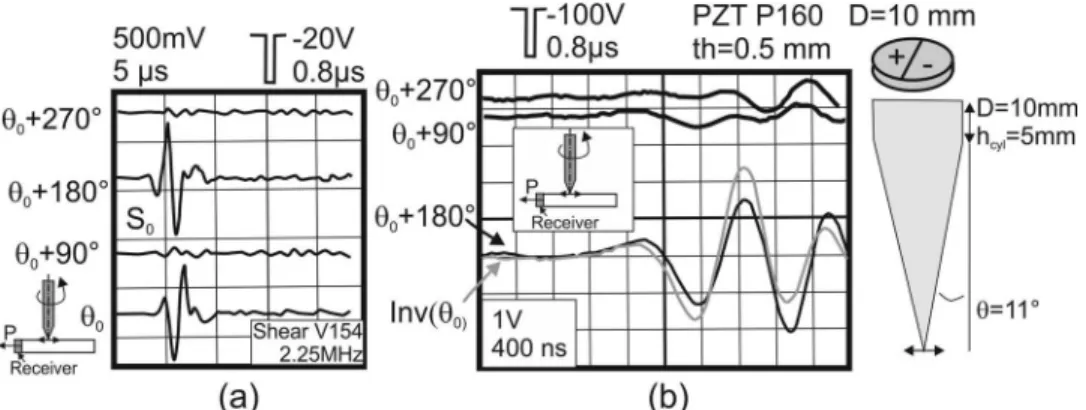
The next handling operation is the rotation of the sty-lus about its axis. Fig. 6 presents the results for a shear vibrating tip. The receiver bar is bonded to the edge of the plate and is mostly sensitive to the longitudinal s0 component. as can be seen, the tip behaves as a dipolar source exhibiting a first axis of maximum emission which is perpendicular to the line of separation of half-discs and another axis of zero emission parallel to the same line. This result is obtained with both the Panametric shear 2.25-MHz V154-type transducer and the bipolar PZT disc.
C. Sliding
The last handling operation is the sliding of the duralu-min tip over the glass surface toward the receiver bar or away from it. Fig. 7 shows the results for a shear stylus tip. as can be seen, sliding the tip over the dry surface reduces the signal transmission: the top and middle curves correspond to a moving stylus and have slower amplitudes than the bottom curve corresponding to a vertical still stylus. during sliding, friction forces act as a mechanical bias. In this setup, the displacement of the stylus at a speed of a few centimeters per second is comparable to the ultrasonic velocity. Indeed, for a tip vibrating at 1 MHz and a tangential amplitude of 100 Å, the peak vibrating velocity reaches 6 cm/s. Therefore, shear mechanical cou-pling in sliding conditions, that is, above the friction limit, is dependent on the direction of the ultrasonic vibration of the tip, which produces or alleviates friction forces.
by comparison, let us look now at an axially vibrating tip. The vibration is imposed by a Panametrics V106-type 2.25-MHz longitudinal transducer. The tip is a duralu-min cone with half-aperture angle θ = 11°. The 70 × 1 × 1.05 mm receiver PZT bar (P160 quartz et silice) is bonded to the flat polished edge of a 1-mm-thick b270
Fig. 4. s0 and a0 generation dependency on the inclination of the stylus for a shear wave propagating inside the tip and a PZT receiver bar which is mostly sensitive to the normal component of displacement: (a) ±20° inclination, (b) ±70° inclination.
Fig. 5. s0 and a0 generation and reception dependency on the inclination of the stylus. (a) a shear wave is propagating inside the tip and the PZT receiver bar is mainly sensitive to the tangential component. (b) a longitudinal wave is propagating inside the tip and the PZT receiver bar is mainly sensitive to the normal component.
type glass plate and hence optimized for detecting the s0 lamb mode. The results are as follows (see Fig. 8): 1) There is no dependency on the rotation of the stylus
[Fig. 8 (a)].
2) Phase inversion occurs between the positive and negative inclination of the stylus [Fig. 8 (b)]. signal amplitude increases with inclination angle.
3) There is little dependency on the sliding of the sty-lus. slight attenuation is noticeable, but the signal waveform is better preserved than the one with a shear wave tip when the stylus is vertical. This result suggests that the coupling stability of the shear wave stylus sliding over the surface should be much better with increased inclination of the stylus, because its vibration ceases to be strictly parallel to the plate.
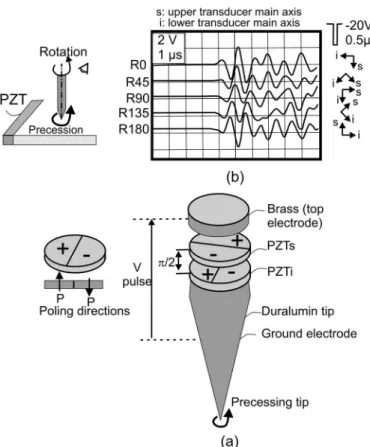
D. Precessing Tip
considering the results obtained for both types of vi-brating tips and axial and bending modes, a stylus tip with a precessing mode of vibration could solve the han-dling problems. Fig. 9 presents a basic design requiring a unique voltage spike to produce a burst precession. The tip uses a low aperture cone or parabolic profile together with two superposed dipolar PZT discs of diameter 7 mm and thickness 0.2 mm oriented at 90° from each other. on top of the PZT discs is a 1-mm-thick brass disc whose
Fig. 6. s0 dependency on the rotation of the stylus: (a) with a V154 2.25 MHz Panametrics shear-type transducer and a lead zirconate titanate receiver bar which is mainly sensitive to the tangential component; (b) with a simple PZT disc (P160, quartz et silice) with alternate poling.
Fig. 7. s0 dependency on the sliding of the shear wave stylus in the verti-cal position.
Fig. 8. s0 tangential component dependency on (a) rotation, (b) inclina-tion, and (c) sliding of the stylus for an axial vibration of the tip.
impedance is close to that of the PZT discs. Its purpose is to constitute a resonator for adjusting the spatial phase delay between the discs and to ensure precession.
Fig. 9(a) shows the experimental result of a left-pre-cessing tip for the generation of s0 lamb mode obtained with a negative voltage spike of 20 V and with a duration of 0.5 μs. The precessing mode radiates ultrasonic energy 360° around. The precessing mode is compatible with the Tdoa operating principle if one receiver is associated with a zero-crossing detection triggered on a positive edge and the opposite one is negative-edge triggered.
E. Pulse Generator
The stylus gets its energy from a small source such as a rechargeable battery placed in its housing. Fig. 10 shows the operating principle of a first-generation 1-ma pulse generator. This small generator is capable of producing 90 V bursts at a central frequency of 1 MHz and a pace of 1 kHz. a second pulse generator is capable of producing double-output 6 V pulses operating in quadrature with only 5 μa of current. This result makes it possible to draw the energy directly from a solar cell.
V. limitations Imposed by diffraction
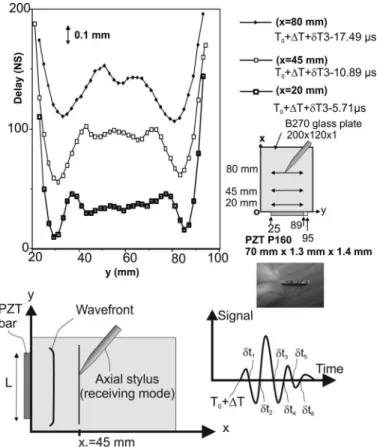
The operating principle of Fig. 1 is very simple. Piezo-ceramic bars are bonded to the four edges of the plate, which ensures a flat design, but precision is limited by the diffraction phenomenon in near-field conditions, as il-lustrated in Fig. 11. This phenomenon results from the spatial extent of the receiver bar, which is several wave-lengths long. actually, at 1 MHz, the wavelength of s0 lamb waves in b270-type glass is 5.4 mm and the receiver bar is 70 mm long. When we move the stylus along a line parallel to the bar, we would like the transit time delay of the wave packet to be constant. In fact this is not true. If the time of arrival of the wave packet is measured at a particular zero crossing of the wave packet, then the high-er the ordhigh-er of the zhigh-ero crossing is, the widhigh-er is the cone of integration over the length of the bar. around the plate borders, side reflections on free edges or on PZT-loaded edges also contribute to the building of the received sig-nal. Fig. 11 shows three diffraction diagrams based on the third zero-crossing detection at x = 20, 45, and 80 mm from the receiver bar. one electrode of the PZT bar is bonded to the edge. access to this electrode is ensured by wrapping around the electrode at the extremity of one bar as shown in the picture. This wrapping creates a 6-mm-long non-piezoelectric section of the bar.
In this experiment, the tip of the stylus is sensitive to axial vibrations and is used as a receiver, whereas the bar is the emitter. However, the same diffraction diagram is observed (as long as the elastic wave propagation re-mains linear) when the stylus is the emitter. The bar is a
little thicker than the previous one. It has the dimensions 70 × 1.3 × 1.4 mm. Its series central frequency is around 900 kHz (and 1 MHz for its parallel resonance visible at high load impedance). The plate dimensions are 200 × 120 × 1 mm.
Fig. 9. (a) Precessing tip design principle. (b) s0 generation and detec-tion sensitivity to the rotadetec-tion of the stylus about its axis. The glass plate is 1 mm thick and the dimensions of the PZT piezo-ceramic bar are 70 × 1 × 1.05 mm. Piezo-electric discs are P160 from quartz et silice.
Fig. 10. a 3-mW pulse generator (3 V, 1 ma). a 19-kHz relaxation oscillator triggers 25-V pulses at the T1 collector. The charge pump boosts this peak voltage to a stable 90 V which is further controlled by the microcontroller (μc), which sources and sinks current to the lead zirconate titanate (PZT) discs, thus generating 1-MHz bursts.
A. Modeling of the Diffraction Phenomenon in Semi-Infinite Space
let us recall here a few steps leading to the Kirchhoff– sommerfeld formulation of the Huygens–Fresnel principle, stipulating that the diffracted field at r0 = (x0, y0) is obtained by summing circular source waves G(r0 − r′) centered at r′ = (0, y′) with their amplitude proportional to the field s(r′) in r′.
let us denote by s a solution to the propagation equa-tion in free space for a sinusoidal wave:
∆s+k s2 =0, (2)
where k is fixed and designates the wave number.
let us denote by G the Green’s function, the solution of the wave equation in free space in the case of a point source placed in r′:
∆G r(0− ′ +r) k G r2 (0− ′ = −r) δ(r0− ′r), (3)
where δ(r0 − r′) is a dirac distribution defining a point source. The form of G depends on the geometry of the propagating medium. In this study, the s0 lamb mode features low dispersion and, at 1 MHz, the longitudinal component of displacement is about 5 times larger than the transversal component [32]. This ratio is assumed to
be constant over the plate for a given operating frequency and plate thickness. Therefore, beyond the diffuse field, where the s0 mode is established, the diffraction phenom-enon is mostly a two-dimensional problem even though the diffraction diagram may change by a constant value according to the examined plane within the thickness of the plate.
If we look at a problem of cylindrical symmetry, a solu-tion to (2) and (3) is of the form [33]
G R( )=AJ kR[ ( )0 +iN kR0( )]=AH kR01( ), (4)
with r′ = (0, y′), r = (x0, y0), R = ( )x0 2 (y y ) ; 0 2 + ′ − A is a constant; J0 and N0 are bessel and neumann functions of order zero; H01 is the Hankel function of the first kind
and order zero.
The constant A is calculated using (3) applied to a horizontal disc centered in r′ and of radius a that tends toward zero. In such a case, (3) becomes
∆G k G
sa
+ =
∫∫
2 1. (5)solving (5) yields [34] A = 1/(4i), where i2 = −1.
Knowing the value of the mechanical displacement s along the source segment (oy′), the Kirchhoff–sommerfeld formulation can be used to determine s(r0) at any obser-vation point of the plate. combining (2), (3), and (5) we get [35] s x y s y G RR xR y R x y y L L ( , ) ( , ) ( ) ( ) , 0 0 0 0 2 0 2 2 2 2 0 = − ′ ∂∂ ⋅ ′ = + ′ − − +
∫
/ / d (6)where L is the length of the bar and the y-axis origin is the middle of the bar. The plane source wave s(x, y) = eikx has
a value of unity at the origin x = 0, and ∂G/∂R =
−(k i H kR/4) ( ),11 where H11 designates the Hankel function of
the first kind and order one. We have
s x y ki H kR xR y L L ( , )0 0 11( ) 0 . 2 2 2 = − ⋅ ′ − +
∫
/ / d (7)If kR ≫ 1 (kR = 6.5 at 1 MHz and for R = 5.5 mm), the Hankel function can be approximated by [36]
H kR i e e
kR
kR
i ikR
11( ) → −→∞ 2 − π( )/4⋅ π . (8)
In a sine wave regime, the diffracted wave at point (x0, y0) is then expressed as follows:
s x y i i keikRR xR y L L ( , )0 0 ( ) 0 . 2 2 2 1 = + ⋅ ′ − +
∫
π / / d (9)Fig. 11. s0 near-field pulse diffraction diagram for the third zero crossing at various distances from the lead zirconate titanate (PZT) receiver bar between y = 21 mm and y = 93 mm. The stylus is vertical and vibrates axially. The internal electrode of the PZT bar is wrapped around to ease soldering accessibility.
If we now consider diffraction in burst conditions, we must take into account the transfer function H of the emit-ter, G of the receiver, and the spectral content E of the drive signal. These functions express the following facts: If we apply a drive signal e(t) to a piezoelectric transducer having an impulse response h(t), we get a mechanical force
f(t) described by f(t) = (e * h)(t), where * denotes the
convolution product. If this mechanical force is now used as an input to a receiver having an impulse response g(t), we get an output voltage v(t) that can be expressed as v(t) = ((e * h) * g)(t) = (e * h * g)(t).
The spectral content V(ω) of the drive signal v(t) is given by its Fourier transform (FT): V(ω) = FT[v(t)] =
v t e( ) j tω t
− +
∞ ∞
∫
d = E(ω)H(ω)G(ω). In burst conditions, v(t) can be expressed in the frequency domain by the general formula 1 2/( π) E H G(ω) (ω) (ω)e−j tωdω. ∞ ∞ − +∫
Taking into account the diffraction effect, we derive the spatio-temporal estimation of the output signal: v(x0, y0, t) = 1 2/( π)
∫
−+∞∞E H G s x y(ω) (ω) (ω) ( , )0 0e−j tωdω. by developing s(x0, y0), we have v x y t i i E H G keik R vt ( , , ) Re ( ) ( ) ( ) ( ) ( ) 0 0 0 2 2 1 21 = + × +∞ −∫
π π ω ω ω R R x R y v x y t A x y t iB x y L L ⋅ ′ = + − +∫
0 2 2 0 0 2 0 0 0 / / d dω ( , , ) Re[ ( , , ) ( , 00, )].t (10)The modulus and phase of the diffracted wave are then
Modulus arctan [ ( , , )] Phase[ ( , , )] . v x y t A B v x y t BA 0 0 2 2 0 0 = + = (11)
To optimize computing times, the following assump-tions are made: The PZT bar is vibrating in its thickness mode at its central resonance pulsation ω = ωh and the stylus is operating at the radial resonance pulsation of the discs ω = ωg. The output signal v(t) central frequency de-pends on the ratio q = [(E(ωh)H(ωh)G(ωh))/(E(ωg)H(ωg)
G(ωg))]. If this ratio is much larger than unity, then the pseudo-period of the output signal is imposed by the emit-ter bar, and hence is close to ωh. Inversely, if q ≪ 1, then the pseudo-period of the output signal is imposed by the stylus and is close to ωg.
actually, the PZT bar exhibits a strong selectivity be-cause of its free back face and possibly a thickness larger than the plate thickness. Its spectrum H(ω) is consequent-ly approximated by a dirac distribution centered in ωh:
H(ω) = h0δωh, where h0 is a constant.
The resonance of the stylus discs is associated with a smaller selectivity (or quality factor) because of the stack-ing of the three discs and the tip, which requires many
epoxy bonding layers, and the mechanical integration of the precessing tip in a housing that will also absorb part of the resonance. because of these conditions, the stylus is assumed to have a broader frequency response than the receiver bar. consequently, the stylus transfer function
G(ω) is approximated by a constant G(ω) = g0.
as a conclusion, we are naturally placed in conditions where q ≫ 1, that is, where the stylus restores the vibra-tion imposed by the ceramic bar.
now if the drive signal is a voltage spike whose dura-tion is half the pseudo-period of the ceramic bar, we can approximate the spectral content of the drive signal by another constant: E(ω) = epulse, where epulse is a constant proportional to the drive amplitude. The impulse response of the output signal then becomes
v t( ) E H G e( ) ( ) ( ) i t e h g Re{ei th} pulse = − d ≈ pulse −∞ +∞
∫
1 2π ω ω ω ω ω π 0 0 ω .. (12) In the case of a voltage drive step, the tempered dis-tribution associated to the drive signal is E(ω) = −(ed/i)p.v.(1/ω) + (ed/2)δ , where ed is the amplitude of the
step, δ is the dirac distribution, and p.v. is the cauchy principal value. If we look at the frequencies around the thickness resonance of the PZT bar, the frequency con-tent of the drive step function is approximated by E(ω) = −(ed/(iω)). Then, the output signal v(t) becomes
v t e h gd e
h
i th
( )step ≈ − ω π0 0Im{ −ω }. (13)
The output burst diffracted signal v(x0, y0, t) is then expressed as v x y t i i e h g kei h v R pulse pulse / ( , , ) Re ( ) ( )( 0 0 =2 2 1 2 0 0 + × − π π ω vvt L L R x R y ) − +
∫
⋅ ′ / / d 2 2 0 (14) v x y t i i e h g ke d h i h v R vt step / ( , , ) Re ( ) ( )( ) 0 0 =2 2 1 2 0 0 + × − π πω ω R R x R y L L − +∫
⋅ ′ / / d 2 2 0 . (15)It can be observed that (14) and (15) yield the same phase variations. To simplify the expression, the modulus and phase of the diffracted wave are normalized by the modulus and phase of a plane wave which corresponds to the head of the wave packet that is not affected by diffrac-tion. Eqs. (14) and (15) are normalized by the following plane wave expressions:
i i i e h g e i e h g e i v x d h i v h h ( ) ( ) ( ) ( 1 2 1 2 0 0 0 0 0 +
{
}
+ π π π πω ω ω pulse / / and ))x0 .{
}
(16)Eventually, we keep the complex form of the diffracted signal to evaluate the signal peak amplitude. The complex normalized output signal becomes vr(x0, y0, t):
v x y t ke R x R y P iQ v P r i v R vt x L L r h ( , , )0 0 ( / )( ) 0 2 2 2 0 = ⋅ ′ = + = + − − − +
∫
ω / / d Q Q v QP R x y y r 2 02 0 2 Phase[ ] arctan ( ) . = = + ′ − (17) The phase of (17) is equal to the phase distortion of an s0 plane wave, whereas the modulus of (17) is propor-tional to the peak amplitude of the diffracted wave.now, let us define the integration cone that takes into account the causality principle which stipulates that the output signal must be zero as long as the wave source r′ considered in the integrand of (17) has not reached the receiver:
R x− 0−vt >0. (18) We can now simulate various situations correspond-ing to a finite-length bar excited in burst conditions and radiating in a semi-infinite space. With regard to phase distortion, the measurements are made with reference to a particular zero crossing, which means transit time dis-tortion at constant phase. The modeling is slightly differ-ent because we look at phase distortions at constant time delay. This difference is not relevant if we consider that a phase distortion can be linked to the wavefront (i.e., con-stant phase) by adding an extra time delay Δt to reach a constant phase or an extra spatial shift Δx to also reach a constant phase. The time delay and spatial shift to reach constant phase (zero crossing) are expressed by
Phase[ ] Phase[ ] , v t vrr k xhh − = − = ω ∆ ∆ 0 0 (19) which yields ∆ ∆ ∆ t fv x fv v t v r h r h S S = = ⋅ = ⋅ Phase[ ] Phase[ ] . 2 2 0 0 π π (20)
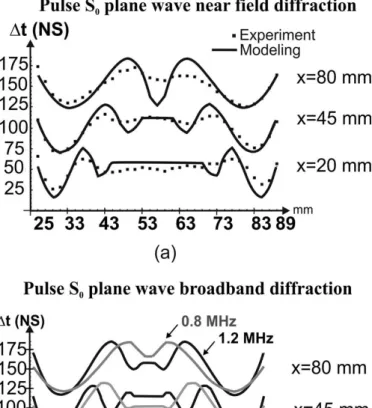
We can now simulate the experiment of Fig. 11. The observation time is 1.5 μs after the arrival time of the head
of the wave packet. This is very close to the third zero crossing of the experimental conditions. The simulation is displayed in Fig. 12(a). Experimental measurements are superposed for comparison. as we can see, experimental distortions are a little smoother than the modeling results. This may be explained by the single-frequency approxima-tion. Fig. 12(b) presents the simulation results for two dif-ferent frequencies at 0.8 MHz and 1.2 MHz. summing the effects, we can imagine that in real conditions, diffraction is smoothed by the bandwidth of the transducers.
now, if we consider higher order zero crossing detec-tion and reproduce the same experiment at a distance of 96.5 mm from the PZT bar with zero crossing orders rang-ing from 1 to 6, we get the graphs shown in Fig. 13. For greater visibility, a constant delay is added to each diffrac-tion diagram so that they can be superposed. as can be seen, by increasing the zero-crossing number, the distor-tion of the plane wave due to diffracdistor-tion is also increased. The side effect of the 6-mm non-active PZT extremity resulting from the wrapped electrode is also visible. The symmetrical curves correspond to modeling, whereas un-even ones are experimental measurements.
Fig. 12. s0 near-field pulse diffraction diagram modeling. Experimental conditions are reported in Fig. 11. Modeling in (a) is done at a frequency of 0.94 MHz.
B. S0 Side Reflections and SH Conversions
We now take into account in the building of the output signal the possible side reflections of s0 occurring at the edges of the plate. We have three possible scenarios:
• reflections at the glass–PZT bar interface,
• Transmission and back reflections at the PZT bar–air interface,
• Possible reflections at free edges of the plate when bars do not cover the entire side length.
We assume here that the frequency·thickness product of the plate is below 1.7 MHz·mm so that high-order sym-metric lamb waves are not generated. also taking into consideration the condition of continuity of displacement at the interfaces, we assume that an incident s0 lamb wave can only be reflected, transmitted, or converted into a shear horizontal (sH) wave. Finally, we assume an inci-dent wave s0 to be a plane longitudinal wave propagating
at s0 mode speed and a PZT bar to be isotropic in first
approximation. The incident wave takes the form s =
s0e−i(kr−ωt). For example, the x component of the s0
re-flected wave is written sxrl = s e xrl i kr t
0 −( −ω). reflection,
con-version, and transmission coefficients are defined as • Arl = reflection coefficient for s0,
• Art = sH reflected conversion coefficient for s0,
• Atl = Transmission coefficient for s0,
• Att = sH transmission and conversion coefficient of s0.
according to the wave polarization defined in Fig. 14, if
Arl < 0, there is no phase inversion at the wave reflection.
The method for calculating the reflection and conver-sion coefficients at free edges consists of writing the con-tinuity of the mechanical displacements sx, sy, and sz and
the stresses Tx, Ty, and Tz at the interface. snell’s law also
applies for incident and reflected waves. at the glass–air interface, the reflection and conversion coefficients are [32]:
Arl i t v v t i t vv l t l t = −
( )
+sin[ ]sin[ ] cos [ ] sin[ ]sin[ ] 2 2 2 2 2 2 2 θ θ θ θ θ
(( )
=( )
+ 2 2 2 2 2 2 2 2 cos [ ] cos[ ]sin[ ] sin[ ]sin[ ] θ θ θ θ θ t rt v v t i i t v A l t ll t v t t i t l v v( )
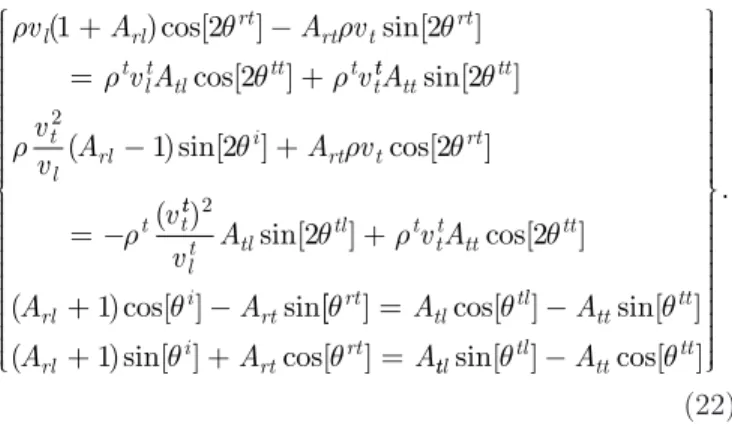
2cos [ ]22 = sin[ ] sin[ ] . θ θ θ with (21) Fig. 14(a) illustrates the reflection Arl and conversion co-efficients Art according to the incident angle θi at a free edge of the plate. sH conversion reaches its maximum at around 40°.The same formalism is carried out to obtain the coef-ficients Arl, Art, Atl, and Att. These coefficients are the solutions of the following system of four equations with four variables:
Fig. 13. s0 near-field high-order zero crossing pulse diffraction diagrams at 96.5 mm from the lead zirconate titanate (PZT) bar (conditions are the same as in Fig. 11). symmetrical curves are theoretical results where-as uneven ones are experimental mewhere-asurements. Modeling is done at the central frequency of the PZT bar: 0.94 MHz.
Fig. 14. (a) reflection and shear horizontal (sH) conversion ratio mod-eling of s0 at a free edge of a plate. (b) Front reflection ratio at the glass–PZT interface (arl1), taking into account transmission in the lead zirconate titanate (PZT) bar (arl2). The PZT bar is assumed to be isotropic.
ρ θ ρ θ ρ θ ρ v A A v v A v l rl rt rt t rt t lt tl tt t t ( )cos[ ] sin[ ] cos[ ] 1 2 2 2 + − = + tt tt tt t l rl i rt t rt t t A v v A A v v sin[ ] ( )sin[ ] cos[ ] ( 2 1 2 2 2 θ ρ θ ρ θ ρ − + = − tt lt tl tl t tt tt tt rl i rt v A v A A A ) sin[ ] cos[ ] ( )cos[ ] sin 2 2 2 1 θ ρ θ θ + + − [[ ] cos[ ] sin[ ] ( )sin[ ] cos[ ] θ θ θ θ θ rt tl tl tt tt rl i rt rt A A A A A = − +1 + = ttlsin[ ]θtl −Attcos[ ]θtt . (22) based on the solutions of (21) and (22), we can calcu-late the reflection coefficient ARL2 corresponding to the steps of a first transmission at the glass–PZT interface described by Atl, then a back-reflection at the PZT–air interface with a coefficient Artl, and then transmission at the PZT–glass interface with a coefficient Atrtl. both ARL1 and ARL2 are displayed in Fig. 14(b) according to the in-cident angle θi.
To use the reflection coefficients of longitudinal waves 1 and 2 in the diffraction integrals, we make a polynomial approximation of the fourth and eighth orders, with the variable being the incident angle θi:
RL1( )θi =0 146. +0 067. θi −0 416. θi2+0 318. θi3−0 237. θi4 (23) RL i i i i i i 2 0 969 0 143 1 108 2 0 504 3 3 494 4 5 477 ( ) . . . . . . θ θ θ θ θ θ = − − + + − + 55−4 631. θ6+2 049. θ7−0 361. θ8. i i i (24) as can be observed in Fig. 14 (b), a fair amount of s0
mode is transmitted in the PZT bar at normal incidence and is then reflected back, whereas for a tangential inci-dence, most of the s0 mode is reflected at the glass–bar
interface. considering that s0 lamb wave diffraction near
the plate borders involves mainly tangential side reflec-tions, we can conclude that rl2 will contribute little to the diffraction. Incorporating the reflected wave of ampli-tude rl1, the diffraction integral becomes:
v x y t ke R x R y ke r i v R vt x i v L L h h ( , , ) ( )( ) ( ) 0 0 0 2 2 0 = ⋅ ′ + − − − +
∫
ω ω / / / / d (( ) ( ) ( ) arctan R vt x L D L D R x R RL y x y − − − − − − ⋅ ⋅ {
′ −}
∫
0 0 0 0 2 2 3 2 2 1 / / ′ = + = + = = + dy P iQ v P Q v QP R x r r , , Phase[ ] arctan , ( 2 2 0 2 yy′ −y 0) ,2 (25)where D is the distance between the glass plate corner and the PZT bar limit.
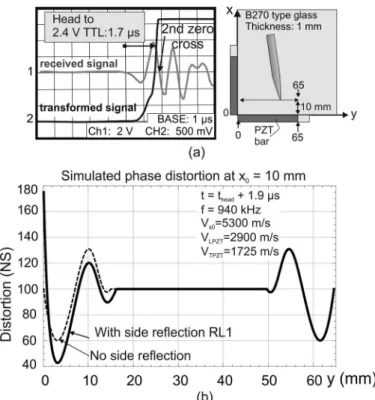
Fig. 15 shows the contribution, with D = 0, of the re-flected wave of amplitude rl1 to the diffraction pattern at x0 = 10 mm and second zero-crossing detection. Early detection, within 1.9 μs following arrival time of the head of wave packet, is ensured experimentally by a processing stage that consists of getting the square value of the re-ceived signal followed by a double active integration stage [see Fig. 15(a)]. side reflection effects are strong near the edge, where reflections at the glass/PZT bar involve phase inversion of the incident wave.
C. Contribution of the Precessing Tip to the Diffraction Phenomenon
The precession of the tip also brings some distortion to the diffraction effect. actually, if we take a point source at position r′ of the PZT bar, this source undergoes a vectorial projection over the main axes of the stylus discs. consequently, the normalized expression of the Kirchhoff– sommerfeld integral taking into account the left-preces-sion of the tip is as follows:
v x y t Rek xR y r i v R vt x L L h ( , , ) cos arctan ( ( )( ) 0 0 0 2 2 0 = ⋅ ′ ⋅ − − − +
∫
ω / / / − − − − − > x y R vt x c 0 0 0 0 0 ) θ if + ′ − − if i y x y v c h sin arctan ( 0) 0 0 θ ω (( d R vt x y P iQ vr − − > ′ = + + 0) 2π 0 = = + = = + ′ − P Q v QP R x y y r 2 2 02 0 2 , Phase[ ] arctan , ( ) , (26) where θc is the angle between the y-axis and main axis of the lower stylus disk.Fig. 16(a) illustrates the cones of integration in a case of differential detection. a diffraction effect involving side reflections and the precessing stylus angular sensitivity bring more distortion. For simplicity, Fig. 16(b) shows the vectorial projection of the s0 longitudinal component of displacement over the stylus’s main axes when θc = 0. Fig. 16(c) is a simulation of the differential diffraction ef-fect with a left- or right-precessing stylus in the setup of Fig. 17 and for the case where x = −30 mm. Fig. 17 is an experimental verification of the effect of a left-precessing tip on the precision of the s0 lamb wave tablet. The
dis-tortion brought by the precession is clearly visible and in accordance with the simulation. The horizontal scale is set at 7.2 mm per square. For the vertical scale, a linear offset corresponding to a non-diffracted plane wave is subtracted from the measured value to emphasize the error. The ver-tical scale is then set at 0.3 mm per square. If we use a single coefficient of linearity, the precision remains within ±0.3 mm, keeping 7 mm margins on all sides, giving an active surface of 57 × 57 mm. additionally, a correction term can be applied to measurements done in the 7 mm margins, based upon the fact that, first, the position er-ror made on the measured value is lower than 1.5 mm, second, the correction term calculated with the diffraction integral using the approximate position is comparable to the one that would be obtained with the real position. Precision can thus be improved or extended to a larger active area.
Fig. 18(a) shows a sample of handwriting captured with the left-precessing stylus of this study over a b270 glass plate of dimensions 71 × 71 × 1 mm incorporating four PZT bars of dimensions 70 × 1 × 1.05 mm operating at 940 kHz and at an acquisition rate of 1040 points/s. The drawing lines have changes in the gray level every time a stylus lift-off is detected. Fig. 18(b) is a picture of another prototype consisting of a 1.6-mm-thick plate incorporating on each side two bars of dimensions 70 × 1.7 × 1.8 mm and exhibiting an operating frequency of 700 kHz. The stylus incorporates the parabolic tip of Fig. 3.
VI. conclusion
an s0 lamb wave digitizing tablet based on determin-istic Tdoa localization of a cordless ultrasonic stylus has been presented. The stylus tip is vibrating at 1 MHz in a burst precession mode. This offers a solution to various technical problems associated with the handling of a sty-lus, namely inclination, rotation, and sliding of the stylus without processing the glass surface. Particular attention has been paid to efficiently focusing ultrasonic energy at the vertex of the tip in the appropriate bending mode to generate nondispersive s0 lamb waves. This has been obtained with narrow conical tips or thin long parabolic
Fig. 15. contribution of side reflections to the diffraction pattern. (a) second zero detection, 1.9 μs after arrival time of the head of the wave packet. (b) simulation at f = 940 kHz and x0 = 10 mm with adjacent sides of a corner loaded with lead zirconate titanate (PZT) bars.
Fig. 16. s0 pulse time difference of arrival (Tdoa) diffraction diagram modeling. (a) Tdoa of contributing ray sources. (b) Vectorial sensitivity of the tip. (c) simulation of precision loss of a right- or a left-precessing tip in the conditions of Fig. 17 where x = −30 mm and y is between −36 and +30 mm.
ones. The tips are metallic, but the precession also works with polycarbonate. The power consumption of the stylus is 1 ma at 90 V or 5 μa at 6 V and 1000 pulses/s. The pen can thus be powered by solar cells. The diffraction phenomenon limits the precision of localization to about ±0.3 mm on a 57 × 57 mm region of a 71 × 71 × 1 mm glass plate. The resolution is 0.1 mm at 1000 points/s. This digitizing pen can be merged with a complementary finger touch technology, such as the addP technology, operating in a separate (10 to 100 kHz) frequency range.
appendix
The following parameters have been used in the simula-tions of side reflection coefficients rl1 and rl2:
For the PZT P160 bar:
• vl = 2900 m/s, (twice the measured frequency con-stant),
• vt = 1725 m/s (shear horizontal speed of sound in the bar),
• ρ = 7300 kg/m3 (density),
• σ = 0.38 (Poisson’s ratio), • EE
11 = 60 × 109 n/m2 (young’s modulus in the plane
perpendicular to the axis of polarization of the bar in low electrical impedance loading conditions).
For the b270 glass plate:
• vl = 5300 m/s (instead of 5650 m/s, which corre-sponds to an infinite medium),
• vt = 3390 m/s (shear horizontal speed of sound), • ρ = 2550 kg/m3 (density),
• σ = 0.219 (Poisson’s ratio).
acknowledgment
The authors are thankful to l. Favro (Wayne state University) for helpful discussions.
references
[1] K. Machida and J. Kent, “2-d tactile sensors and tactile sensor arrays,” in Nanoelectronics and Information Technology: Advanced
Electronic Materials and Novel Devices. Wiley-VcH Verlag, 2003,
ch. 36.
[2] K. nicol and E. M. c. Hennig, “apparatus for the time-dependent measurement of physical quantities,” U.s. Patent 4 134 063, Jan 9, 1979.
[3] W. Westerman and J. G. Elias, “Method and apparatus for integrat-ing manual input,” U.s. Patent 6 888 536 b2, May 3, 2005.
[4] M. b. Free, b. o. Geaghan, K. P. Hauck, and b. l. Weaver, “Touch location sensing system and method employing sensor data fitting to a predefined curve,” World Intellectual Property organization, Patent Wo 2008/058047 a1, nov. 5 2007.
[5] s. Hotelling, J. a. strickon, and b. q. Huppi, “Multipoint touch-screen,” U.s. Patent 2006/097991 a1, May 6, 2004.
Fig. 17. Precision of the s0 lamb wave (x, y) digitizing tablet with the left-precessing stylus tip. The stylus is displaced on a set of parallel seg-ments ranging from x = +30 mm to x = −30 mm. Zoom (24 times) on the measured x coordinate around its linear position.
Fig. 18. (a) real-time display at an acquisition rate of 1000 (x, y)/s for (a) a 71 × 71 × 1 mm b270 glass plate equipped with 70 × 1 × 1.05 mm P160 lead zirconate titanate (PZT) bars. (b) Picture of a prototype tab-let of twice the dimensions with a parabolic stylus tip (the active area is 130 × 130 × 1.6 mm).
[6] y. Fukushima and H. Fujitsuka, “Position indicator, variable ca-pacitor and input device,” U.s. Patent 2010/0117994 a1, oct. 26, 2008.
[7] y. oda and y. sugiyama, “Position detection apparatus,” U.s. Pat-ent 2011/0216032, nov. 29, 2010.
[8] y. oda, y. sugiyama, and s. yamamoto, “Pointer detection appa-ratus and detection sensor,” U.s. Patent 2011/0234508 a1, oct. 21, 2010.
[9] y. Fukushima and H. Fujitsuka, “Position pointer, variable capaci-tor and inputting apparatus,” U.s. Patent 2011/0219892 a1, apr. 2 2010.
[10] r.-K. Ing, s. catheline, n. quieffin, and M. Fink, “Method for locating an impact on a surface and device therefor,” U.s. Patent 7 345 677 (b2), Mar. 18, 2008.
[11] T. dahl, T. o. Kavli, and T. Kirkus, “acoustic motion determi-nation,” World Intellectual Property organization, Patent Wo 2011/036486, sep. 22, 2009.
[12] s. P. Hotelling, d. r. Kerr, b. ording, J. P. Ive, P. J. Kennedy, a. M. Fadell, and J. l. robbin, “Proximity detector in handheld device,” U.s. Patent 2006/0161871 a1, sep 30, 2005.
[13] P. W. Woo, “Ultrasonic data converter,” U.s. Patent 3 134 099, May 19, 1964.
[14] a. l. Whetstone, s. Fine, W. banks, and s. c. Phillips, “Graphical data device,” U.s. Patent 3 838 212, sep. 24, 1974.
[15] s. W. Mallicoat, “Graphic input system,” U.s. Patent 4 777 329, oct. 11, 1988.
[16] d. r. Ward, r. P. Wood, J. Harel, and r. Holtzman, “Pen position-ing system,” U.s. Patent 6 184 873 b1, Feb. 6, 2001.
[17] r. adler and P. J. desmares, “an economical touch panel using saW absorption,” IEEE Trans. Ultrason. Ferroelectr. Freq. Control, vol. 34, no. 2, pp. 195–201, Mar. 1987.
[18] E. dieulesaint, o. legras, and d. royer, “Touch screen with oscillat-ing loop guided elastic waves,” European Patent EP0397539, Mar. 9 1989.
[19] J. Kent, “acoustic condition sensor employing a plurality of mu-tually non-orthogonal waves,” U.s. Patent 2005/0012724, apr. 20, 2004.
[20] W. E. Glenn, “apparatus for determining position and writing pres-sure,” U.s. Patent 4 488 000. dec. 11, 1984.
[21] a. billmann, E. dieulesaint, and d. royer, “Elastic wave position sensor,” French Patent Fr2575281 (b1), dec. 21, 1984.
[22] I. sato, T. yoneyama, M. Tanabe, K. Kawakami, H. okada, s. sa-saki, s. Inose, M. suto, and H. Uzuhashi, “Tablet type coordinate input apparatus using elastic waves,” U.s. Patent 4 665 282, May 12, 1987.
[23] H. okada and s. Inose, “Phase reversion of the received signal caused by the inclination of the input pen in the ultrasonic tablet and its prevention method,” Inst. Electron. Inform. Commun. Eng., vol. J74-a, no. 3, pp. 338–344, Mar. 1991.
[24] K. Kobayashi, s. Taniishi, a. Tanaka, y. yoshimura, K. Kaneko, r. yanagisawa, and M. Tokioka, “coordinate input apparatus,” U.s. Patent 5 500 492, Mar. 19, 1996.
[25] n. suzuki, a. Tanaka, K. Kaneko, y. yoshimura, s. Taniishi, K. Kobayashi, and s. Mori, “coordinates input apparatus,” U.s. Patent 4 886 943, dec. 12, 1989.
[26] s. Malik and J. laszlo, “Visual touchpad: a two-handed gestural input device,” in Proc. 6th Int. Conf. Multimodal Interfaces, 2004, vol. 1, p. 289.
[27] J. P. nikolovski, “lamb waves detection of the (X, y) coordinates of a stylus,” Ph.d. thesis, optics laboratory, Université Pierre et Marie curie (Paris VI), Paris, France, 1995.
[28] y. liu, J.-P. nikolovski, n. Mechbal, M. Hafez, and M. Vergé, “Tac-tile objects based on an amplitude disturbed diffraction pattern method,” Appl. Phys. Lett., vol. 95, no. 25, art. no. 251904, 2009.
[29] y. liu, J.-P. nikolovski, M. Hafez, n. Mechbal, and M. Verge, “acoustic wave approach for multi-touch tactile sensing,” in 2009
Int. Symp. Micro-NanoMechatronics and Human Science, pp. 574–
579.
[30] J.-P. nikolovski, “system for detecting and locating a disturbance in a medium and corresponding method and computer program,” World Intellectual Property organization, Patent Wo 2012/069722 (a2), oct. 27, 2010.
[31] J. P. nikolovski and d. royer, “local and selective detection of acoustic waves at the surface of a material,” in 1997 IEEE
Ultrason-ics Symp. Proc., vol. 1, pp. 699–703.
[32] d. royer and E. dieulesaint, Elastic Waves in Solids 1. berlin, Ger-many: springer-Verlag, 2000.
[33] y. rocard, Dynamique générale des vibrations, Paris, France: Mas-son, 1943.
[34] G. s. Kino, Acoustic Waves: Devices, Imaging, and Analog Signal
Processing. Upper saddle river, nJ: Prentice Hall, 1987.
[35] J. Jackson, Classical Electrodynamics, 2nd ed., new york, ny: Wi-ley, 1975.
[36] M. abramowitz and I. stegun, Handbook of Mathematical Function:
With Formulas, Graphs, and Mathematical Tables, new york, ny:
dover, 1970.
Jean-Pierre Nikolovski was born in les Mées,
France, in 1967. He received his Ph.d. degree in physics with a major in electronics and acoustics in 1995 from the University Pierre and Marie cu-rie (Paris 6). He is currently a research engineer at cEa, lIsT, where he specializes in acoustic ac-tuators and devices in human–computer interac-tions and biomedical engineering. He was formerly at EsPcI ParisTech, where he studied and de-signed several ultrasonic transducers and instru-ments, such as wideband longitudinal- and shear-wave transducers in ndT, surface acoustic shear-wave filters, ultrasonic gas flow meters, ultrasonic digitizing pens for computer graphics, and large-area tap screens. In 1997, he raised capital and co-founded Intelligent Vibrations sa, where, as a chief technical officer, he designed products such as interactive tables and multimodal touch and vocal shop windows based on large-area tap screens. He has authored 21 patents and is the recipient of the Montgolfier Medal from sPI.
Danièle Fournier was born in 1945 in Mauriac,
France. she received her Engineer diploma in 1969 from Ecole superieure Industrielle de Phy-sique et de chimie and received her Ph.d. degree in physics in 1979 from the University of Paris XIII. after 40 years of teaching in the University of Paris, she is currently Emeritus Professor at University Pierre and Marie curie (Paris VI). she specialized in applied physics courses (electronics, feedback loops, instrumentation, optics, etc.). she published more than 150 papers in national and international journals and presented her work at more than 60 interna-tional meetings with 20 invited papers in optics, instrumentation, and thermal and optical characterization of materials. she has been a mem-ber of the international committee of the Photoacoustic and Photother-mal Meeting from 1979 to 2011. she has developed numerous interna-tional collaborations (berkeley, detroit, nicosia, bochum, campinas, new delhi, etc.).