Mice trisomic for a bacterial artificial chromosome with the single-minded 2 gene (Sim2) show phenotypes similar to some of those present in the partial trisomy 16 mouse models of Down syndrome
12
0
0
Texte intégral
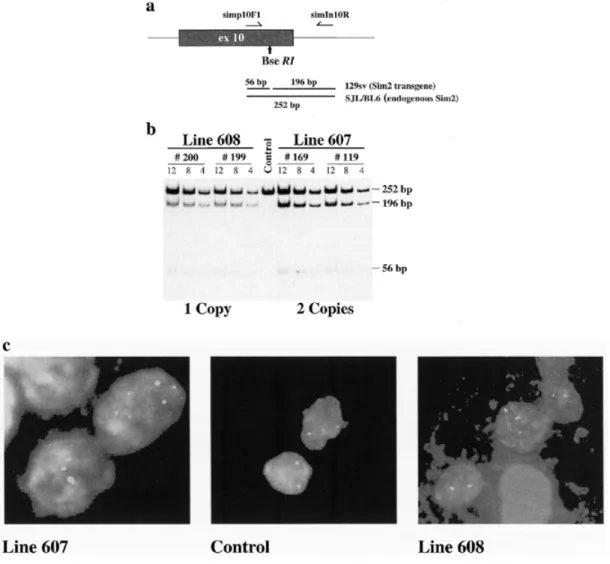
(2) 1854 Human Molecular Genetics, 2000, Vol. 9, No. 12. Figure 1. Detection and estimation of the Sim2 BAC transgene copy numbers in lines 607; TgN(Sim2)1Sagu and 608; TgN(Sim2)2Sagu. (a) Schematic representation of PCR amplification of genomic DNA using oligonucleotides in exon 10 (simp10F1) and intron 10 (simIn10R). BseRI digestion of PCR products derived from the Sim2 transgene produces two fragments of 56 and 196 bp whereas the endogenous mSim2 amplification product (252 bp) does not contain the BseRI restriction enzyme site. (b) Polyacrylamide gel analysis of PCR products from tail DNA of line 608 [(TgN(Sim2)2Sagu, individual mice 200 and 199], 607 [(TgN(Sim2)1Sagu, individual mice 169 and 119] and control mice digested with BseRI. Each transgenic sample was loaded in triplicate using 12, 8 and 4 µl of the digested PCR product. Digested PCR product (12 µl) from control mice was loaded. Transgene copy number was estimated to be 1 in line 608 and 2 in line 607. (c) FISH analysis of spleen cells using Sim2BAC probe. Additional copy/copies of the Sim2 BAC are integrated at unique sites in Sim2 transgenic lines 607 [TgN(Sim2)1Sagu] and 608 [TgN(Sim2)2Sagu].. transcription repressor, SIM2 is an outstanding candidate for implication in some DS phenotypes, in particular mental retardation. Transgenic mice are valuable experimental models to study the consequences of gene overexpression in DS (18,19). Recently, two viable mouse models bearing three copies of part of mouse chromosome 16 (MMU16) homologous with HC21, including the DSCR, were produced: (i) Ts65Dn mice have three copies of MMU16 from App to Mx1 (20); and (ii) Ts1Cje mice have three copies of MMU16 from Sod1 to Mx1 (21). Both of these mice show some of the DS phenotypes, mostly learning and behavioral abnormalities (22). Additionally, transgenic mice overexpressing single genes from the DSCR (or their mouse homologs) have been described: (i) Dyrk (or minibrain, MNBH) (23); and (ii) Sim2. (24). However, only the Dyrk-containing yeast artificial chromosome (YAC) transgenic mouse mimics the gene dosage imbalance in DS where three instead of two copies of the gene are present. This mouse shows some of the phenotypes of the partial trisomy 16 mouse models of DS (23). In contrast, the Sim2 transgenic mouse contains many copies of the Sim2 cDNA artificially driven by a strong promoter (24). In an effort to dissect the potential implication of SIM2 in the development of DS phenotypes, we have created two transgenic mouse lines using a bacterial artificial chromosome (BAC) clone containing the complete genomic sequence of the Sim2 gene and its regulatory elements termed TgN(Sim2)1Sagu and TgN(Sim2)2Sagu according to the official nomenclature proposed by the Institute for Laboratory Animal Research (ILAR, http://www4.nas.edu/cls/ilarhome.nsf ). These mice.
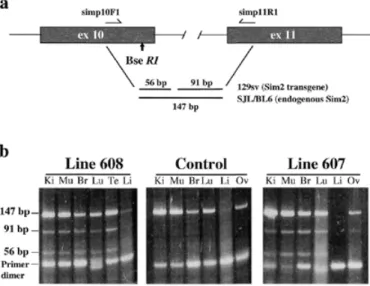
(3) Human Molecular Genetics, 2000, Vol. 9, No. 12 1855. contain one and two additional copies of Sim2, respectively, and express the transgene in the correct spatial manner at physiological levels; they therefore model in vivo the overexpression levels of SIM2 as present in trisomy 21. Phenotypic analyses of these mice show similarity with the phenotypes of the partial trisomy 16 mice models of DS. The Sim2 transgenic mice exhibit abnormal anxiety-related/reduced exploratory behavior and sensitivity to pain, suggesting that overexpression of SIM2 contributes to some of the complex DS phenotypes. RESULTS Production of Sim2 BAC transgenic mice A linearized BAC clone containing the complete mouse Sim2 gene was used for microinjection of fertilized eggs. In order to distinguish the BAC transgene (of the mouse strain 129/Sv) from the endogenous Sim2 gene of the recipient mice [(C57BL/6 × SJL) F1] we have found a C→T polymorphic transition at nucleotide 368 in exon 10 (GenBank accession no. AF023872) disrupting a BseRI restriction site in the recipient hybrid background (C57BL/6 and SJL). Twenty-five pups were analyzed using this polymorphic site of Sim2 present only in the 129/Sv strain (BAC clone) and not in the (C57BL/6 × SJL) F1 recipient strain (Fig.1a) and reconfirmed by a multiplex PCR to detect the presence of both ends of the BAC vector. We have produced four male founder mice positive for the Sim2 BAC transgene. Three of these four founder mice were successfully mated in order to establish transgenic lines 604, 607 and 608. Expression profile of Sim2 transgene and estimation of its copy number The transgene expression in lines 604, 607 and 608 was analyzed by RT–PCR amplification of exons 10–11 and detection of the BseRI polymorphic site in kidney, muscle, heart, liver, brain, lung, ovary and testis (Fig. 2). We found that the pattern of the transgene expression mimicked the endogenous Sim2 expression in kidney, muscle, brain, lung, ovary and testis isolated from lines 607 and 608. Both the transgene and endogenous Sim2 were not or very weakly expressed in heart or liver. The same pattern of the transgene expression was observed through three generations in lines 607 and 608 (data not shown). Levels of transgene expression as estimated by phosphoimager varied between 20% (kidney) and 50% (brain) of endogenous Sim2 expression in both lines, and was not dependent on transgene copy number. The number of copies of the transgene, one in line 608 and two in line 607, was determined by quantification of the results of BseRI digestion of PCR amplification products between exon 10 and intron 10 of the Sim2 gene (Fig.1a and b). The Sim2 BAC transgene(s) was inserted into a single site in the genome in both lines 607 and 608 as detected by fluorescence in situ hybridization (FISH) (Fig. 1c). In line 604 no transgene expression was detected. Line 607 was termed TgN(Sim2)1Sagu and line 608 TgN(Sim2)2Sagu as recommended by ILAR.. Figure 2. Analysis of Sim2 BAC transgene expression in lines 607; TgN(Sim2)1Sagu and 608; TgN(Sim2)2Sagu. (a) Schematic representation of the RT–PCR performed using oligonucleotides derived from exon 10 (simp10F1) and exon 11 (simp11R1) of Sim2. BseRI digestion of RT–PCR products derived from the Sim2 transgene produced two fragments of 56 and 91 bp whereas the endogenous Sim2 RT–PCR amplification product (147 bp) does not contain the BseRI restriction enzyme site. (b) Detection of transgene expression using BseRI digestion of the RT–PCR amplification products from total RNA of kidney (Ki), muscle (Mu), brain (Br), lung (Lu), liver (Li) and ovary (Ov) or testes (Te). The presence of products of 91 and 56 bp indicate the expression of the transgene.. General characterization of Sim2 transgenic mice Transgenic animals do not show any gross phenotypic differences compared with their normal littermates. Development of newborns up to 2 months postnatally was monitored by measurements of their body weight at 3 day intervals. Both male and female transgenic pups gained weight similarly to their littermate controls (data not shown). Analysis of urea, creatinine, sodium, potassium, calcium and phosphates in the blood did not reveal any differences between the transgenic animals and controls (data not shown). Histological analysis revealed no visible changes in the gross neuroanatomy of brain (i.e. all structures were present and normally developed) in both transgenic lines and their normal littermates. The brains revealed no signs of neurodegeneration in terms of cortex atrophy, presence of tangles (Bielschowsky stain) or amyloid deposits (βA4 stain), especially in the hippocampus (Fig.3A–E and G). Furthermore, the brains did not have any signs of inflammation (LCA stain), ischemic or hypoxic changes [hematoxylin and eosin stain (H&E)], demyelination (Luxol stain) or astroglial activation [glial fibrillary acidic protein (GFAP) stain]. The synaptic protein synaptophysin was normally expressed within the brains. The gross anatomy of kidney, liver, gut, heart and skeletal muscles was also unchanged in tissues of transgenic mice compared with their normal littermates (Fig. 3F and H–L). In summary, there were no differences between transgenic mice and normal controls in tissues analyzed by light microscopy..
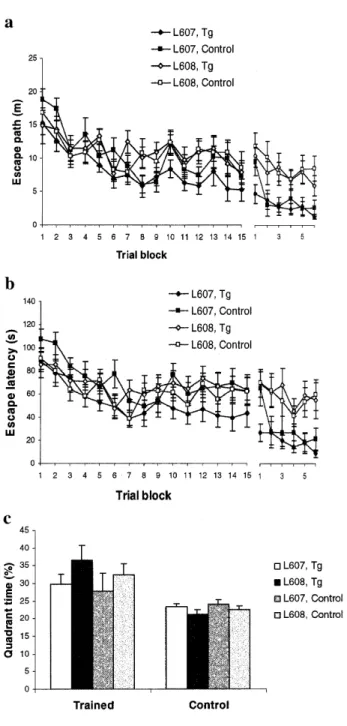
(4) 1856 Human Molecular Genetics, 2000, Vol. 9, No. 12. Figure 3. Histological analysis of Sim2 transgenic mice (data from line 607 [TgN(Sim2)1Sagu]) (left two panels) and wild-type (right two panels) tissues. There are no visible differences by light microscopy between wild-type and Sim2 transgenic mice brains. H&E, ×10 (A and C) hippocampi; (B and D) H&E, ×75; (E and G) Bielschowsky silver stain, ×75; heart muscles (F and H) (H&E × 250); tibial muscles (I and K) (H&E, ×158); and kidneys (J and L) (H&E, ×158).. Behavioral studies Water maze. Sim2 transgenic and control mice of both lines learned to escape to the hidden platform as evidenced by decreasing escape times [block F(41,14) = 9.4, P < 0.0001, transgene F(41,1) = 0.5 n.s., line F(41,1) = 0.2 n.s.] and path lengths [block F(41,14) = 12.3, P < 0.0001, transgene F(41,1) = 0.6 n.s., line F(41,1) = 2.7 n.s.] (Fig. 4a and b). Mice from line 608 spent more time overall in the vicinity of the pool wall than mice from line 607, but the transgene had no effect on this measure [block F(41,14) = 5.5, P < 0.0001, transgene F(41,1) = 1.0 n.s., line F(41,1) = 4.4, P < 0.0420]. There were no transgene or line effects on swim speed [transgene F(41,1) = 0.1 n.s., line F(41,1) = 0.3 n.s.] and tendency to float passively [transgene F(41,1) = 0.4 n.s., line F(41,1) = 1.1 n.s.]. Probe trial performance was not significantly affected by line or genotype (Fig. 4c). Even though the scores were on average rather poor compared with other samples of mice tested with the same. protocol, the sample had as a whole developed a significant spatial preference for the trained goal site, both with respect to amount of time spent in the trained quadrant [place F(46,1) = 11.8, P < 0.0013, interaction place-transgene F(46,1) = 0.7 n.s., interaction place-line F(46,1) = 2.2 n.s.] and number of crossings over the trained goal position [place F(46,1) = 12.1, P < 0.0011, interaction place-transgene F(46,1) = 0.4 n.s., interaction place-line F(46,1) = 0.7 n.s.]. During reversal training (Fig. 4a and b), both control and transgenic mice showed a relatively strong tendency to swim along the wall and episodes of passive floating became quite frequent. During subsequent testing in the cue navigation test (Fig. 4a and b), there was again no difference between transgenic and normal mice but line 607 mice showed better escape performance than line 608 mice, both with respect to escape time [block F(41,14) = 6.1, P < 0.0001, transgene F(41,1) = 0.2 n.s., line F(41,1) = 11.6, P < 0.0014] and path swum [block F(41,14) = 7.8, P < 0.0001, transgene F(41,1) = 0.7 n.s., line F(41,1) = 14.5, P < 0.0004]..
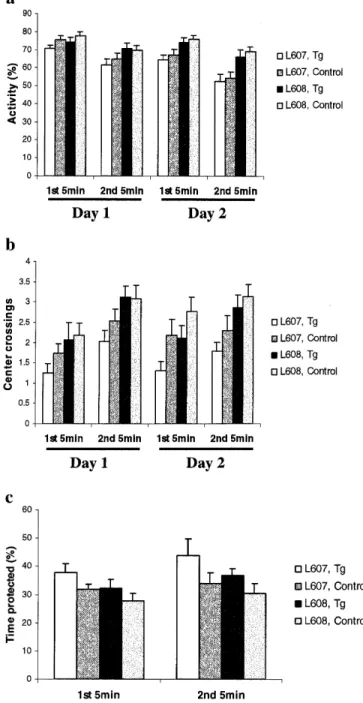
(5) Human Molecular Genetics, 2000, Vol. 9, No. 12 1857. response was present in all groups to both the context of the training chamber [response F(46,1) = 188.8, P < 0.0001, interaction transgene-response F(46,1) = 0.2 n.s., interaction lineresponse F(46,1) = 1.3 n.s.] and to the tone played in the new and unfamiliar testing cage [response F(46,1) = 34.9, P < 0.0001, interaction transgene-response F(46,1) = 0.7 n.s., interaction line-response F(46,1) = 0.1 n.s.] (data not shown). Open field. Open field behavior differed between the two lines tested; line 608 displayed increased locomotor activity compared with line 607, in particular on the second day [transgene F(46,1) = 1.2 n.s., line F(46,1) = 13.3, P < 0.0001, interaction day-line F(46,1) = 8.7, P < 0.0050] (Fig. 5a). Independently of these line differences, transgenic mice showed a trend to spend more time resting than normal controls [transgene F(46,1) = 3.2, P < 0.0817, line F(46,1) = 7.5, P < 0.0086, interaction day-line F(46,1) = 8.6, P < 0.0051]. In addition, transgenic mice showed a tendency to visit the center of the maze less frequently than their normal littermates [transgene F(46,1) = 2.9, P < 0.0933, line F(46,1) = 9.7, P < 0.0031] (Fig. 5b). The speed of locomotion was not affected by the transgene and did not differ between lines. Zero-maze. Testing on the elevated zero-maze showed a statistically significant difference between transgenic mice and their normal littermates. Transgenic mice spent significantly more time in the protected sectors of the maze [transgene F(46,1) = 5.2, P < 0.0272, line F(46,1) = 3.2 n.s.] (Fig. 5c). The distance moved on the maze was neither affected by genotype nor by line [transgene F(46,1) = 0.7 n.s., line F(46,1) = 1.8 n.s.]. As seen in the open field there was also a difference between the two lines. There was no difference between transgenics from controls with respect to head dipping.. Figure 4. Morris water maze test. Escape path (a) and escape latency (b) are shown for hidden platform acquisition (trial blocks 1–9) and hidden platform reversal (trial blocks 10–15). The right part of each graph represents the results of cue navigation test (trial blocks 1–6). The first 60 s of the first reversal trial served as probe trial. (c) Percentage of time that mice have spent in tested quadrant (trained) compared with the mean of all other quadrants (control) is represented. No statistically significant differences were observed between the Sim2 transgenic and control mice in any part of the Morris water maze test. One trial block represents two trials. The means (± SEM) are presented.. Resident–intruder social interaction test. Interestingly, the transgenic female mice had a tendency to avoid social interaction. This was particularly evident in analyzing the leaning variables, where transgenic females showed less dynamic interaction by a precocious latency to lean and increased number of leanings. The latency of leaning done by the female transgenic-intruders (40 s average) was reduced in comparison with the normal intruder (84 s average) (Fig. 6a). This difference was not statistically significant. However, the frequency of leaning was significantly higher for transgenic mice intruders (28 times average) compared with normal littermate intruders (11 times average) [F(1,3) = 3.7, P = 0.04] (Fig. 6b). The female transgenic-residents did not reveal significant differences in their behavior compared with normal residents. No significant difference was observed between the two transgenic lines, therefore the results from both lines are combined in Figure 6. In addition, no differences were observed when the test was performed using male intruder-resident combinations.. Fear conditioning. When placed into the training chamber for the first time, all groups displayed a similar and normal amount of exploratory activity [path F(46,1) = 1.4 n.s., line F(46,1) = 1.6 n.s.]. Irrespective of genotype and line, the animals responded to the three recurring training cycles with increasing levels of freezing and after 24 h an equally strong freezing. Stress-induced analgesia (SIA) test. The nociceptive response was analyzed by the SIA test that measures the latency of the mice on a hot-plate for a paw licking either in pre-stress or post-stress conditions. Both lines of transgenic mice showed significantly reduced nociceptive response in the post-swim hot-plate measure as expressed by latency to lick their paws [F(1,3) = 4.2, P = 0.008] (Fig. 7a) or as the percentage of the maximum possible effect (%MPE) [F(1,3) = 2.6, P = 0.05].
(6) 1858 Human Molecular Genetics, 2000, Vol. 9, No. 12. test and in zero-maze. The resident–intruder social interaction test revealed reduced social interactions in the transgenic female mice. Furthermore, there was increase tolerance to pain in transgenic mice. The Morris water maze test, fear conditioning, light–dark box (data not shown) and tube dominance (data not shown) tests did not show any additional differences between transgenic and control mice. DISCUSSION. Figure 5. Analysis of exploratory behavior in Sim2 transgenic mice. Animals were observed in two periods of 5 min on two consecutive days. Locomotor activity (a) (percentage of time that mice spent moving) and number of center visits (b) (number of times that mice cross the center of the maze) were measured. Even though there was no difference in general locomotor activity between transgenic and control mice, Sim2 transgenic mice from both lines explored less the center of the maze. The same reduced exploratory behavior was observed using elevated zero-maze where Sim2 transgenic mice from both lines spend more time in the protected area of the maze in both 5 min trials of the test. (c) Percentage of time spent in protected areas during the first and second 5 min trials. The means (± SEM) are presented.. (Fig. 7b). There was no difference in the baseline pre-stress latency between normal and transgenic mice. In summary, we have observed an anxiety-related/reduced exploratory behavior in both transgenic lines in the open field. Transgenic mice have become an indispensable experimental system to study the consequences of gene overexpression in aneuploidies. The correct spatio-temporal expression of a transgene is regulated by appropriate promoter sequences and often by additional regulatory elements encoded in introns and/ or in global chromatin structure(s). BAC vectors containing relatively large inserts with probably all of these regulatory elements are highly stable and represent an ideal vector for ‘physiologically correct’ transgenesis. In order to dissect the contribution of individual genes or small genomic regions to the complex phenotypes of DS, we have created the first BAC transgenic mice overexpressing a gene possibly involved in DS. Two lines of transgenic mice were generated with one [line 608, TgN(Sim2)2Sagu] or two [line 607, TgN(Sim2)1Sagu] copies of a BAC containing the Sim2 gene. This allowed us to analyze the contribution of Sim2 trisomy to the phenotype of Ts65Dn and Ts1Cje mouse models of DS. The BAC clone used contained a 210 kb genomic fragment encompassing the entire Sim2 gene and 1 kb of 3′-UTR before one of the vector arms (25). The human SIM2 gene spans ∼50 kb and if the mouse and human genes are roughly the same size there is in this BAC an additional 160 kb of mouse sequence 5′ to the Sim2 gene. The sequence of the human chromosome 21 revealed only one predicted gene, PRED41 (http:// www.rzpd.de/general/html/Chrom21/gene_cata.html) that is located 150.3 kb upstream of SIM2. It is therefore possible that this predicted gene of unknown function is also present in the mouse SIM2 BAC. RT–PCR analysis (with all its limitations) showed that Sim2 transgenic mice moderately overexpress (0.2–0.5 times) the Sim2 gene, only in tissues where the endogenous gene is expressed. This level of overexpression corresponds to that expected in trisomy 21 and therefore the Sim2 transgenic mice are an appropriate model to study the contribution of SIM2 to the phenotype of DS. We did not observe a correspondence between expression levels and transgene copy number between the two lines and tissues; it is therefore likely that there is a positional effect of the integration site on transgene expression. Sim2 transgenic mice develop normally and are fertile. No abnormalities were observed by histopathological analysis of brain, kidney, heart, liver, gut and skeletal muscle. Detailed analysis of several behavioral phenotypes of both transgenic lines revealed anxiety-related/reduced exploratory behavior in open field and the zero-maze test. A similar decrease in exploratory behavior was detected by analysis of spontaneous activity in the ‘activity box’ test in the Ts1Cje mice (21) (Table 1). The resident–intruder social interaction test revealed that the female Sim2 transgenic mice displayed reduced social interactions probably due to the observed anxiety-related/ reduced exploratory behavior in the open field and zero-maze tests. We did not observe any differences when the test was.
(7) Human Molecular Genetics, 2000, Vol. 9, No. 12 1859. Figure 6. Analysis of social interaction between the control and the Sim2 transgenic female mice. Response of normal resident to transgenic intruder (R-cont × I-Tg), response of transgenic resident to normal intruder (R-Tg × I-cont), response of transgenic intruder to normal resident (I-Tg × R-cont) and response of normal intruder to transgenic resident (I-cont × R-Tg) are represented for (a) the leaning latency and (b) the number of leanings as measured during a 10 min observation. The Sim2 transgenic females show less social interaction by a precocious latency to lean and increased number of leanings (see I-Tg × R-cont versus I-cont × R-Tg) (results from both lines combined are presented). The means (± SEM) are presented.. Figure 7. SIA test of the Sim2 transgenic mice. The latency of the mice on the hot-plate to paw licking was measured (a) in a pre-stress response and after a forced swimming period (post stress) and (b) as the percentage of the maximum possible effect (%MPE). The Sim2 transgenic mice revealed increased tolerance to pain after a forced swimming period. The means (± SEM) are presented.. performed using male intruder–resident combinations. This was probably due to the natural aggressive behavior of males during the interaction which interfered with the leaning variable measurement. A more adequate test is therefore needed to investigate whether the male Sim2 transgenic mice display this phenotype. Interestingly, the Sim2 transgenic mice showed more tolerance to pain in the SIA test. An SIA test using swimming at 25°C as the stress situation, did not reveal significant differences between the transgenic and the control mice in their nociceptive response. Therefore, the results obtained with the SIA test in colder temperature (14–15°C) might indicate that a non-opioid endogenous pain inhibitory system of the supraspinal response was affected in the transgenic mice. This phenotype should be investigated further by pharmacological experiments (26). It has been suggested that individuals with DS show poor response to different types of pain, but this has not yet been rigorously documented (27). The anxiety-related/reduced exploratory behavior phenotype of the Sim2 transgenic mice may correspond with the regulatory function of Sim2 in the developing forebrain; however, the exact molecular mechanism remains to be discovered. One. possibility is that overexpression of Sim2 leads to the increased formation of Sim2–Arnt heterodimers with at least two consequences: (i) a change in the rate of its regulatory function [probably repression of gene expression (17)]; and (ii) a reduction of the quantity of Arnt protein available as a cofactor for the other Arnt heterodimers involved in diverse biological functions (15). In addition to being expressed in the forebrain, Sim2 is expressed in developing ribs, vertebrae, limb skeletal muscles and kidney (12). Preliminary analysis of homozygous mice with targeted disruption of Sim2 showed phenotypic abnormalities in many of these tissues (28). However, the normal function of Sim2 and its human homolog during development remains unclear. We did not observe any abnormalities in these tissues in our Sim2 transgenic mice. The overexpression of Sim2 in mice was also recently studied by Ema et al. (24). However, in these transgenic mice, unknown number of copies of the Sim2 cDNA were inserted into the genome of recipient mice and Sim2 expression was artificially driven by the chicken β actin promoter which induces its strong overexpression in almost all tissues analyzed. The reverse part of the Morris water maze and fear.
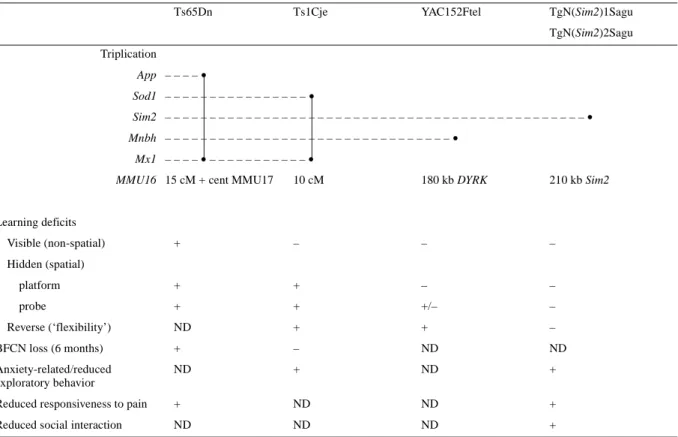
(8) 1860 Human Molecular Genetics, 2000, Vol. 9, No. 12. Table 1. Genotype–phenotype correlation in Ts65Dn, Ts1Cje, YAC152Ftel and the Sim2 transgenic mice with triplications of certain regions of chromosome 16 Ts65Dn. Ts1Cje. YAC152Ftel. TgN(Sim2)1Sagu TgN(Sim2)2Sagu. Triplication App – – – – • Sod1 – – – – – – – – – – – – – – – – • Sim2 – – – – – – – – – – – – – – – – – – – – – – – – – – – – – – – – – – – – – – – – – – – – – – – • Mnbh – – – – – – – – – – – – – – – – – – – – – – – – – – – – – – – – • Mx1 – – – – • – – – – – – – – – – – • MMU16 15 cM + cent MMU17. 10 cM. 180 kb DYRK. 210 kb Sim2. +. –. –. –. platform. +. +. –. –. probe. +. +. +/–. –. ND. +. +. –. BFCN loss (6 months). +. –. ND. ND. Anxiety-related/reduced exploratory behavior. ND. +. ND. +. Learning deficits Visible (non-spatial) Hidden (spatial). Reverse (‘flexibility’). Reduced responsiveness to pain. +. ND. ND. +. Reduced social interaction. ND. ND. ND. +. +, presence of phenotype; +/–, mild phenotype; –, no phenotype; ND, not determined.. conditioning tasks showed reduced learning capacity of these mice. Even though we have paid special attention analyzing the learning capacities of our Sim2 transgenic mice, we have been unable to reproduce these observations. It is probable that those phenotypes are the result of the strong overexpression of Sim2 in a non-physiological manner (29,30). The YAC 152F7tel transgenic mice with trisomy for the human minibrain gene from the DSCR showed abnormalities in the Morris water maze test, specifically in probe test crossing and the reverse platform test (23). No abnormalities were detected in any part of this test in our transgenic mice. Thus, the Sim2 transgenic mice appear to show a distinct phenotype from the YAC 152F7tel mice (within the resolution of the tests used) (Table 1). The availability of our Sim2 and other mice transgenic for HC21 genes and genomic sections such as the YAC 152F7tel mice, permit the definition of the contribution of single gene trisomies and trisomies of limited regions of HC21 equivalents, to the phenotypes of partial trisomy 16 models of DS, the Ts65Dn and Ts1Cje mice (20,21). As shown in Table 1, YAC 152F7 tel and Sim2 transgenic mice show some phenotypes similar to those present in partial trisomy 16 mice, but not all of them. It is therefore apparent that a number of genes contribute to the phenotypes of DS, and that each gene contributes to certain aspects of the phenotype. In favor of this hypothesis is the fact that there are differences between the phenotypes of the Ts65Dn and Ts1Cje mice (Table 1), probably due to the overexpression of genes from the region. between markers App and Sod1 as shown by analysis of Ms1Ts65 mice (20,21,31). Transgenic mice for single genes provide an opportunity to dissect the contribution of each gene to the phenotype and define the total number of genes responsible for the overall abnormalities. Complementary to the transgenic approach described here, null mutations (knockout mice) for genes within the triplicated region of the partial trisomy 16 mice could be crossed onto the genetic background of partial trisomy 16 mice. Some of the resulting animals would therefore have partial trisomy 16 with, however, only two expressed copies of this triplicated gene. Since DS results from a precise gene imbalance (three versus two copies of HC21 genes), it is important to create mouse models with only three copies of the relevant genes and their regulatory elements in order to ensure physiological relevance of these models to DS. Most of the transgenic mice generated to date for HC21 genes or their mouse homologs may not be physiologically relevant to DS as they: (i) have more than one extra copy of the transgene (32,33); (ii) have promoters that overexpress the transgene at high levels and not in the correct temporal and spatial pattern (24); and (iii) use human transgenes (23). Gross overexpression of many genes will almost certainly result in a phenotype (29,30). Using the Sim2 transgenic mice described here, the already published YAC 152F7tel mice and additional transgenic mice overexpressing genes from the DSCR which are under development, it is now possible to create multiple transgenic mice with triplication of two or more genes from the DSCR. This.
(9) Human Molecular Genetics, 2000, Vol. 9, No. 12 1861. will enhance our understanding of the molecular basis of the complex pathogenesis of DS. MATERIALS AND METHODS Generation and detection of mSim2 transgenic mice The BAC clone, 299E5 (Research Genetics) with the insert of 210 kb containing the complete mouse Sim2 gene was isolated, linearized with λ terminase and used for microinjection as described (25). To detect the presence of the Sim2 transgene we searched for (by direct sequencing of PCR products and comparison of published Sim2 sequences) a polymorphism creating or destroying a restriction enzyme site present only in the BAC transgene (mouse strain 129/Sv) and not in the recipient mice (strains C57BL/6 and SJL). All mice were screened by PCR amplification of exon 10 containing the polymorphism using oligonucleotides simp10F1 (5′-CAG TGG CAC TGT GCC AAC TC-3′) and SimIn10R (5′-CAT GAT GGG CAG TGG AAG CA-3′). The PCR conditions were: 5 min at 95°C; 35 × 94°C for 30 s, 30 s at 55°C, 30 s at 72°C; and 10 min at 72°C; and the final concentration of the reagents were: 50 mM KCl, 10 mM Tris–HCl (pH 8.3), 1.5 mM MgCl2, oligonucleotides at 0.5 µM each, dNTPs at 0.5 mM and 2 U of Taq polymerase. PCR products (10 µl each) were digested for 1 h at 37°C with 10 U of BseRI and analyzed on 3% agarose gels. All transgenic animals showed three bands corresponding to the endogenous Sim2 amplification product (252 bp) and digested transgenic Sim2 products of 56 and 196 bp. All transgenic animals were reconfirmed by multiplex PCR using two pairs of oligonucleotides: BAC1F (5′-GTG CGG GCC TCT TCG CTA TT-3′) and BAC1R (5′-CAG GTC GAC TCT AGA GGA TC-3′), and BAC2F (5′-AGT GTC ACC TAA ATA GCT TG-3′) and BAC2AR (5′-CAG TAC TGC GAT GAG TGG CA-3′) amplifying the BAC vector sequences 3′ and 5′ of the insert (PCR conditions as above except that the final concentration of MgCl2 was 3 mM). BAC1F/BAC1R amplifies a 183 bp fragment and BAC2F/BAC2AR amplifies a 398 bp fragment. The three transgenic lines were maintained by crossing transgenic animals with their normal littermates, producing (C57BL/6 × SJL) F1, F2 and F3 mice. Analysis of the mSim2 transgene copy number and expression pattern Transgene copy numbers in the F1 generation of Sim2 transgenic lines 607 [TgN(Sim2)1Sagu] and 608 [TgN(Sim2)2Sagu] were determined using the polymorphic BseRI restriction enzyme site on exon 10 (oligonucleotides: simp10F1 and SimIn10R; for conditions see above). The PCR product (12, 8 and 4 µl) was digested with BseRI and run on a 12% nondenaturing polyacrylamide gel, stained with SybrGold stain and analyzed using Pharmacia ImageMaster VDS system (Pharmacia). The expression pattern of Sim2 in F1, F2 and F3 generations was determined by RT–PCR amplification of a 147 bp long cDNA fragment spanning exons 10 and 11 [oligonucleotides: simp10F1and simp11R1 (5′-GTC CTC GCA GAA CCT GCG CG-3′); for conditions see above], which included the polymorphic BseRI restriction site, starting from 4 µg of total RNA (Superscript preamplification system; Life Technologies). isolated from 2-month-old mice. The amplified cDNA fragment was digested with BseRI and produced a unique fragment of 147 bp in control animals and two additional fragments of 91 and 56 bp derived from the expression of the transgene. Digested RT–PCR products were run on a 12% non-denaturing polyacrylamide gel, blotted onto a nylon membrane and hybridized with a radioactively labeled simp10F1/simp11R1 PCR product. Transgene expression levels were estimated using the intensity of the ethidium bromide bands and, additionally, the data from the Southern blot using a phosphoimager and the ImageQuant software. FISH The Sim2 BAC DNA was labeled with digoxigenin using the DIG-Nick translation mix (Roche). Digoxigenin-labeled probes were detected with sheep anti-digoxigenin-fluorescin antibodies (Roche). The number of integration sites of the Sim2 BAC transgene was analyzed on interphase nuclei of spleen cells isolated from normal and transgenic mice from the F1 generation. Prints were fixed with acetic acid:methanol (1:3 v/v) and heated for 30 min at 55°C. (The detailed protocol can be found at Technical Tips Online TO1796, http://www.biomednet.com/home ). Histological analysis of Sim2 transgenic mice For paraffin histology, whole mouse organs (brain, heart, skeletal muscle, kidney, liver and gut isolated from 9-monthold animals from the F3 generation) were fixed in 4% paraformaldehyde in phosphate-buffered saline. Coronal slices were dehydrated through graded alcohols and embedded in paraffin. Sections of 3 µm nominal thickness were mounted on silanized glass slides, and routinely stained for H&E. For the characterization of mouse brains, immunostains for GFAP (polyclonal, 1:300; Dako, Glostrup, Denmark), microtubuleassociated protein (MAP-2; monoclonal, 1:1000; Boehringer Mannheim, Mannheim, Germany), synaptophysin (polyclonal, 1:40; Dako), A-beta and LCA (both monoclonal, 1:50; Dako) were performed. Biotinylated secondary antibodies [goat antirabbit and rabbit anti-mouse (Dako)] were used at a dilution of 1:200. Visualization was achieved using the biotin/avidinperoxidase system (Dako) with diaminobenzidine as a chromogen. In addition, silver staining (modification of Bielschowsky) and myelin staining (Klüver-Barrera) were also performed. Behavioral analysis of Tg mice Behavioral analyses were conducted in 50 animals, all from the F3 generation, all aged 7 months, unless stated otherwise [12 transgenics of line 607 (six males and six females), 11 controls of line 607 (six males and five females), 14 transgenics of line 608 (seven males and seven females), 13 controls of line 608 (seven males and six females)]. In each test, all control mice were littermates of transgenic mice. To assess their learning capabilities, they were tested in swimming navigation (place and cue navigation), as well as in cued and contextual fear conditioning. Locomotor activity, exploratory behavior and anxiety were assessed in an open field arena, on the elevated zero-maze and in the light–dark box. Mice were also subjected to the resident–intruder social interaction test, and the stress-induced analgesia test..
(10) 1862 Human Molecular Genetics, 2000, Vol. 9, No. 12. Water maze. All water maze testing was done in a pool of 1.5 m diameter with six trials per day with an intertrial interval of 30–60 min and a maximal trial duration of 120 s (34,35). The water was made opaque by addition of milk and held at a temperature of 24–26°C. The animals were released into the water from one of eight possible locations in a balanced pseudo-random sequence. Animals were trained with the platform hidden beneath the water surface in a constant location for 18 trials (place navigation acquisition). This was followed by 12 trials of training with the still-hidden platform moved to the opposite quadrant (place navigation reversal). The first 60 s of the first reversal trial served as probe trial. The animals were subsequently tested for 12 trials during which the platform was marked with a flag and moved to a new location for every trial (cue navigation). Swim paths were tracked using a Noldus EthoVision 1.96 system. For analysis, raw data were imported into custom developed Wintrack 2.1 software. Statistical analysis was done using Statview 5.0 (PC software) and Statistica 5.1. Parameters measured during training trials were analyzed by three-way ANOVA with transgene status (transgenic, control), transgenic line (607, 608) and trial block (blocks of two trials). Probe trial data were also analyzed by two-way ANOVA, with transgene status and quadrant time (trained quadrant, average of control quadrants). Open field. Spontaneous activity was assessed in a dimly lit white circular arena with a diameter of 1.5 m. Animals were observed during two observation periods of 5 min each on two days. Movements were video tracked and analyzed as above. Statistical analysis was performed using four-way ANOVA with transgenic status (transgenic, control), transgenic line (607, 608), experimental day (first day, second day) and observation period (first versus second 5 min). Zero-maze. Animals were also tested on the elevated zeromaze, a ring-shaped runway located 40 cm above the floor (36,37). Two opposite 90° sectors were protected by side walls, the remaining two were exposed to the cliff without protection. Animals were observed during two subsequent periods of 5 min on a single day. They were video tracked using a Noldus EthoVision 1.96 system which was set up for simultaneous recording through the keyboard of defecation and cliff exploration by head dipping. For analysis raw data were imported into custom developed Wintrack 2.1 software. Statistical analysis was performed using three-way ANOVA with transgenic status (transgenic, control), transgenic line (607, 608), and observation period (first versus second 5 min). Fear conditioning. Animals were tested within a semitransparent, sound-attenuated box with a background noise level of 55 dB (35). The training chamber [247 × 168 mm, height 230 mm (Imetronic, Pessac, France)] had opaque walls and a 48 bar shock grid floor. Indirect room light (3 lux) penetrated the interior of the chamber through its top. Freezing (absence of any movement not related to respiration) was scored using the keyboard and custom developed software by continuously observing the live video image from a miniaturized infrared camera. In addition, locomotor activity was monitored through 24 × 16 infrared beams. Before training, the chamber was cleaned thoroughly with ethanol and the animal could then explore it for 60 s. This was followed by 30 s exposure to the. conditioned stimulus (CS) (2000 Hz, 92 dB tone). The unconditioned stimulus (US) (scrambled foot shock at 0.26 mA average) was delivered during the last 2 s of CS presentation, with CS and US terminating together. CS and US were delivered three times and separated by 30 s intervals. Contextual conditioning was assessed after 24 h by placing the animals in the training chamber without CS or US delivery and scoring freezing behavior for 120 s. Cued conditioning was monitored at the same interval but under 5 lux red light and in a 200 × 100 mm clear testing cage containing some cage bedding. First, spontaneous exploration of the new context was monitored for 60 s, then the CS tone was delivered without US for 60 s. Bedding was replaced between animals and the testing cage was cleaned using a lemon-scented detergent. Conditioning responses were evaluated using three-way ANOVA with transgene status (transgenic, control), transgenic line (607, 608), and test response (context/tone versus respective baseline). Resident–intruder social interaction test. Mice were housed individually for at least 1 week prior to testing. As described (38), an intruder was placed in the home cage of the individually housed resident, and their behavior was video recorded for 5 min for males and 10 min for females. Different combinations were chosen in which a resident met an intruder from the same gender with the opposite genotype. We have used 30 mice, aged 9 months, all from the F3 generation, including as control residents five males (three from line 608 and two from 607) and four females (two from each line) which met as intruders five transgenic Sim2 males (three from line 608 and two from 607) and four females (two from each line), respectively. As a resident from the transgenic mice we used three males (two from line 607 and one from 608) and three females (one from line 607 line and two from 608) that met as intruders three control from each gender (two males from line 607, one male from 608, one female from 607, and two females from 608), respectively. The videotaped behavior of the resident or intruder was scored by a blinded observer for several variables such as: (i) leaning for both sexes, latency to and number of leanings against the wall; (ii) following time (only for females); and (iii) aggressive behavior (only for males): latency to and number of attacks and tail flickings. ANOVA of the described variables was done for each sex separately. SIA test. A modified version of this test (39) was used. Tenmonth-old mice [n = 67, 19 transgenics (ten females and nine males) and 10 controls (eight females and two males) of line 607, 20 transgenics (twelve females and eight males) and 18 controls (twelve females and six males) of line 608, all from the F3 generation] were placed on a metal platform maintained at a constant temperature of 51–52°C. The movements of the mouse on the hot-plate were constrained by a clear plexiglas cylinder. Mice remained on the hot-plate until they performed a hind paw licking, otherwise the trial was terminated after 120 s (the cut-off latency). The mouse removed from the hotplate was then immediately forced to swim for 2 min in a water bath of 14–15°C. Subsequently, the mouse was towel dried, allowed a rest time (10 min) in the home cage, and then tested again on the hot-plate as before. ANOVA for pre-swim hot-plate latency and post-swim hot-plate latency was performed. SIA is also expressed as the percentage of the maximum possible effect (%MPE) using the following.
(11) Human Molecular Genetics, 2000, Vol. 9, No. 12 1863. formula: %MPE = [(post-swim latency – baseline latency)/(cutoff latency – baseline latency) × 100]. 17.. ACKNOWLEDGEMENTS We thank Marie-Pierre Papasavvas for technical assistance, Christine Monso-Hinard and Michael Morris for help with FISH and Colette Rossier for help with sequencing. We thank the members of S.E.A.’s laboratory for useful advice and discussions. This work was supported by grants 31.40500.94 and 31.57149.99 from the Swiss FNRS, 98-3039 from the OFES/EU, and funds from the University and Cantonal Hospital of Geneva and the EMDO Foundation Zurich. REFERENCES 1. Epstein, C.J. (1995) In Scriver, C.R., Beaudet, A.L., Sly, W.S. and Valle, D. (eds), The Metabolic and Molecular Bases of Inherited Disease. McGraw-Hill, New York, NY, pp. 749–794. 2. LeJeune, J., Gautier, M. and Turpin, R. (1959) Etude des chromosome somatique des neufs enfants Mongoliens. C. R. Acad. Sci. Paris, 248, 1721–1722. 3. McCormick, M.K., Schinzel, A., Petersen, M.B., Stetten, G., Driscoll, D.J., Cantu, E.S., Tranebjaerg, L., Mikkelsen, M., Watkins, P.C. and Antonarakis, S.E. (1989) Molecular genetic approach to the characterization of the ‘Down syndrome region’ of chromosome 21. Genomics, 5, 325–331. 4. Delabar, J.M., Theophile, D., Rahmani, Z., Chettouh, Z., Blouin, J.L., Prieur, M., Noel, B. and Sinet, P.M. (1993) Molecular mapping of twentyfour features of Down syndrome on chromosome 21. Eur. J. Hum. Genet., 1, 114–124. 5. Antonarakis, S.E. (1998) 10 years of Genomics, chromosome 21, and Down syndrome. Genomics, 51, 1–16. 6. Chen, H., Chrast, R., Rossier, C., Gos, A., Antonarakis, S.E., Kudoh, J., Yamaki, A., Shindoh, N., Maeda, H. and Minoshima, S. (1995) Singleminded and Down syndrome? Nature Genet., 10, 9–10. 7. Chen, H., Chrast, R., Rossier, C., Morris, M.A., Lalioti, M.D. and Antonarakis, S.E. (1996) Cloning of 559 potential exons of genes of human chromosome 21 by exon trapping. Genome Res., 6, 747–760. 8. Chrast, R., Scott, H.S., Chen, H., Kudoh, J., Rossier, C., Minoshima, S., Wang, Y., Shimizu, N. and Antonarakis, S.E. (1997) Cloning of two human homologs of the Drosophila single-minded gene SIM1 on chromosome 6q and SIM2 on 21q within the Down syndrome chromosomal region. Genome Res., 7, 615–624. 9. Crews, S.T., Thomas, J.B. and Goodman, C.S. (1988) The Drosophila single-minded gene encodes a nuclear protein with sequence similarity to the per gene product. Cell, 52, 143–151. 10. Thomas, J.B., Crews, S.T. and Goodman, C.S. (1988) Molecular genetics of the single-minded locus: a gene involved in the development of the Drosophila nervous system. Cell, 52, 133–141. 11. Ema, M., Suzuki, M., Morita, M., Hirose, K., Sogawa, K., Matsuda, Y., Gotoh, O., Saijoh, Y., Fujii, H., Hamada, H. and Fujii-Kuriyama, Y. (1996) cDNA cloning of a murine homologue of Drosophila single-minded, its mRNA expression in mouse development, and chromosome localization. Biochem. Biophys. Res. Commun., 218, 588–594. 12. Fan, C.M., Kuwana, E., Bulfone, A., Fletcher, C.F., Copeland, N.G., Jenkins, N.A., Crews, S., Martinez, S., Puelles, L., Rubenstein, J.L. and Tessier-Lavigne, M. (1996) Expression patterns of two murine homologs of Drosophila single-minded suggest possible roles in embryonic patterning and in the pathogenesis of Down syndrome. Mol. Cell Neurosci., 7, 1–16. 13. Moffett, P., Dayo, M., Reece, M., McCormick, M.K. and Pelletier, J. (1996) Characterization of msim, a murine homologue of the Drosophila sim transcription factor. Genomics, 35, 144–155. 14. Yamaki, A., Noda, S., Kudoh, J., Shindoh, N., Maeda, H., Minoshima, S., Kawasaki, K., Shimizu, Y. and Shimizu, N. (1996) The mammalian single-minded (SIM) gene: mouse cDNA structure and diencephalic expression indicate a candidate gene for Down syndrome. Genomics, 35, 136–143. 15. Crews, S.T. (1998) Control of cell lineage-specific development and transcription by bHLH-PAS proteins. Genes Dev., 12, 607–620. 16. Ema, M., Morita, M., Ikawa, S., Tanaka, M., Matsuda, Y., Gotoh, O., Saijoh, Y., Fujii, H., Hamada, H., Kikuchi, Y. and Fujii-Kuriyama, Y. (1996). 18.. 19.. 20.. 21.. 22. 23.. 24.. 25.. 26.. 27.. 28.. 29. 30.. 31.. 32.. 33.. 34.. 35.. 36.. Two new members of the murine Sim gene family are transcriptional repressors and show different expression patterns during mouse embryogenesis. Mol. Cell Biol., 16, 5865–5875. Moffett, P., Reece, M. and Pelletier, J. (1997) The murine Sim-2 gene product inhibits transcription by active repression and functional interference. Mol. Cell Biol., 17, 4933–4947. Avraham, K.B., Schickler, M., Sapoznikov, D., Yarom, R. and Groner, Y. (1988) Down’s syndrome: abnormal neuromuscular junction in tongue of transgenic mice with elevated levels of human Cu/Zn-superoxide dismutase. Cell, 54, 823–829. Kola, I. and Hertzog, P.J. (1997) Animal models in the study of the biological function of genes on human chromosome 21 and their role in the pathophysiology of Down syndrome. Hum. Mol. Genet., 6, 1713–1727. Reeves, R.H., Irving, N.G., Moran, T.H., Wohn, A., Kitt, C., Sisodia, S.S., Schmidt, C., Bronson, R.T. and Davisson, M.T. (1995) A mouse model for Down syndrome exhibits learning and behavior deficits. Nature Genet., 11, 177–184. Sago, H., Carlson, E.J., Smith, D.J., Kilbridge, J., Rubin, E.M., Mobley, W.C., Epstein, C.J. and Huang, T.T. (1998) Ts1Cje, a partial trisomy 16 mouse model for Down syndrome, exhibits learning and behavioral abnormalities. Proc. Natl Acad. Sci. USA, 95, 6256–6261. Hernandez, D. and Fisher, E.M. (1999) Mouse autosomal trisomy: two’s company, three’s a crowd. Trends Genet., 15, 241–247. Smith, D.J., Stevens, M.E., Sudanagunta, S.P., Bronson, R.T., Makhinson, M., Watabe, A.M., O’Dell, T.J., Fung, J., Weier, H.U., Cheng, J.F. and Rubin, E.M. (1997) Functional screening of 2 Mb of human chromosome 21q22.2 in transgenic mice implicates minibrain in learning defects associated with Down syndrome. Nature Genet., 16, 28–36. Ema, M., Ikegami, S., Hosoya, T., Mimura, J., Ohtani, H., Nakao, K., Inokuchi, K., Katsuki, M. and Fujii-Kuriyama, Y. (1999) Mild impairment of learning and memory in mice overexpressing the mSim2 gene located on chromosome 16: an animal model of Down’s syndrome. Hum. Mol. Genet., 8, 1409–1415. Chrast, R., Scott, H.S. and Antonarakis, S.E. (1999) Linearization and purification of BAC DNA for the development of transgenic mice. Transgenic. Res., 8, 147–150. Mogil, J.S., Sternberg, W.F., Balian, H., Liebeskind, J.C. and Sadowski, B. (1996) Opioid and nonopioid swim stress-induced analgesia: a parametric analysis in mice. Physiol. Behav., 59, 123–132. Martinez-Cue, C., Baamonde, C., Lumbreras, M.A., Vallina, I.F., Dierssen, M. and Florez, J. (1999) A murine model for Down syndrome shows reduced responsiveness to pain. Neuroreport, 10, 1119–1122. Shamblott, M.J., Bugg, E.M., Lawler, A.M., Fan, C.M., Blue, M.E. and Gearhart, J.D. (1998) Developmental abnormalities and perinatal lethality resulting from targeted disruption of the murine Sim2 gene [abstract]. Am. J. Hum. Genet., 63, A172–A172. Magdaleno, S.M. and Curran, T. (1999) Gene dosage in mice—BAC to the future. Nature Genet., 22, 319–320. Yang, X.W., Wynder, C., Doughty, M.L. and Heintz, N. (1999) BACmediated gene-dosage analysis reveals a role for Zipro1 (Ru49/Zfp38) in progenitor cell proliferation in cerebellum and skin. Nature Genet., 22, 327–335. EMBO Workshop Molecular Biology of Chromosome 21 and Down Syndrome. Israel, June 1999 (1999) Abstracts. Cytogenet. Cell Genet., 86, 2–20. Elson, A., Levanon, D., Weiss, Y. and Groner, Y. (1994) Overexpression of liver-type phosphofructokinase (PFKL) in transgenic-PFKL mice: implication for gene dosage in trisomy 21. Biochem. J., 299, 409–415. Sumarsono, S.H., Wilson, T.J., Tymms, M.J., Venter, D.J., Corrick, C.M., Kola, R., Lahoud, M.H., Papas, T.S., Seth, A. and Kola, I. (1996) Down’s syndrome-like skeletal abnormalities in Ets2 transgenic mice. Nature, 379, 534–537. Balschun, D., Wolfer, D.P., Bertocchini, F., Barone, V., Conti, A., Zuschratter, W., Missiaen, L., Lipp, H.P., Frey, J.U. and Sorrentino, V. (1999) Deletion of theryanodine receptor type 3 (RyR3) impairs forms of synaptic plasticity and spatial learning. EMBO J., 18, 5264–5273. Minichiello, L., Korte, M., Wolfer, D., Kuhn, R., Unsicker, K., Cestari, V., Rossi Arnaud, C., Lipp, H.P., Bonhoeffer, T. and Klein, R. (1999) Essential role for TrkB receptors in hippocampus-mediated learning. Neuron, 24, 401–414. Shepherd, J.K., Grewal, S.S., Fletcher, A., Bill, D.J. and Dourish, C.T. (1994) Behavioral and pharmacological characterisation of the elevated ‘zero-maze’ as an animal model of anxiety. Psychopharmacology (Berl.), 116, 56–64..
(12) 1864 Human Molecular Genetics, 2000, Vol. 9, No. 12. 37. Konig, M., Zimmer, A.M., Steiner, H., Holmes, P.V., Crawley, J.N., Brownstein, M.J. and Zimmer, A. (1996) Pain responses, anxiety and aggression in mice deficient in pre-proenkephalin. Nature, 383, 535–538. 38. Dixon, A.K., Huber, C. and Lowe, D.A. (1994) Clozapine promotes approach-oriented behavior in male mice. J. Clin. Psychiatry, 55 (Suppl. B), 4–7.. 39. O’Callaghan, J.P. and Holtzman, S.G. (1975) Quantification of the analgesic activity of narcotic antagonists by a modified hot-plate procedure. J. Pharmacol. Exp. Ther., 192, 497–505..
(13)
Figure
![Figure 3. Histological analysis of Sim2 transgenic mice (data from line 607 [TgN(Sim2)1Sagu]) (left two panels) and wild-type (right two panels) tissues](https://thumb-eu.123doks.com/thumbv2/123doknet/14886382.647078/4.918.201.717.103.686/figure-histological-analysis-transgenic-sagu-panels-panels-tissues.webp)
+4

Documents relatifs