Design, Implementation and Validation of an Exoskeletal
Robot for Locomotion Studies in Rodents
ARCHNES
by
MA SEACHUSETS INSTifrOF TECHNOLOGY
Yun Seong Song
N
282012
M.S., Carnegie Mellon University (2006)
J
2
0
LIBRARIES
B.S. and B.S.E., Seoul National University (2004)
Submitted to the Department of Mechanical Engineering
in partial fulfillment of the requirements for the degree of
Doctor of Philosophy
at the
MASSACHUSETTS INSTITUTE OF TECHNOLOGY
June 2012
C Massachusetts Institute of Technology 2012. All rights reserved.
A uthor ... .. .. .. .. .. .. .. .. .. .. .. .. .. .. . . . ...
Departme i'~of Mechni al*Engineering
ay 11, 2012
Certified by...
..
...
.
...
(I
Neville Hogan
Professor
Thesis Supervisor
Accepted by...
...
....
David E. Hardt
Chairman, Department Committee on Graduate Students
Design, Implementation and Validation of an Exoskeletal
Robot for Locomotion Studies in Rodents
by
Yun Seong Song
Submitted to the Department of Mechanical Engineering
on May 11, 2012, in partial fulfillment of the
requirements for the degree of
Doctor of Philosophy
Abstract
Growing interest in robotic treatment of patients with neurological injury motivates the development of therapeutic robots for basic research into recovery. Though humans are the ultimate beneficiaries, basic research frequently involves rodent models of neurological injury, which motivates robotic devices that can interact with rats or mice. Currently, available apparatus for locomotion studies of rodents is built upon treadmills, which simplify the design and implementation but also restrict the scope of possible experiments. This is largely due to the treadmill's single-dimensional movement and the lack of accommodation for natural or
voluntary movement of the animal.
In order to open up new possibilities for locomotion studies in rodents, this work introduces newly developed apparatus for locomotion research in rodents. The key concept is to allow maximal freedom of voluntary movement of the animal while providing forceful interaction when necessary. Advantages and challenges of the proposed machine over other existing designs are discussed. Design and implementation issues are presented and discussed, emphasizing their impact on free, voluntary, movement of the animal. A live-animal experiment was conducted to verify the design principles. Unconstrained natural movement of the animal was compared with movement with the overground robot attached. The compact, overground design and back-drivable implementation of this robot allow novel experiments that involve open-space, free (or interactive) locomotion of the animal.
Thesis Supervisor: Neville Hogan Title: Professor
Acknowledgements
There was a time when I was imagining the moment of completing my thesis and writing this acknowledgement, full of self-confidence and pride. Now, being present at that very moment, I have realized how this work could not have been possible without the support from great many people around me. I can only mention a few here - but I thank everyone.
Meeting Neville Hogan is probably the most wonderful thing that will have happened in my academic life. I am privileged to have had the opportunity to work with him. As a thesis advisor, his keen physical insight and clear, objective thoughts were always inspiring. He was a sharp advisor, an enthusiastic discussion partner, and a lethal critic that never fails to hit the mark. As a mentor, he was always open to concerns of his students and provided humble advices that resonated. As a person, he has quite an interesting character that I could only get a glimpse of. I wish I had the chance to talk to him outside of work.
Professors Russell Tedrake, Sangbae Kim and Richard Marsh constituted a superb committee. Coming from distinct disciplines, these experts helped shape my thesis the way it is now. They were available to provide invaluable insights on the apparatus design, control implementation and animal locomotion - and in every other aspect. It was always a humbling and exiting experience to discuss my work with them, individually or as a group.
I would like to thank the past and present Newman Lab members for making my days at MIT
memorable. Dr. Hermano Igo Krebs was always an excellent source of information on hardware implementation. Laura Dipietro was very supportive of my work and my career in general, and I always enjoyed the conversations we had on vast array of topics. Jooeun Ahn has been a good friend of mine since before joining this group - and will continue to be so. Hyunglae Lee and
superb technical assistants. Everywhere else, they were always a good company to have. Past members of the lab, namely Mohammad, Panagiotis, and Seungjae, are my respectful academic seniors with whom I had the pleasure to discuss my work with. I would also like to thank the newer, north-mezzanine members, Tyler Susko, Will Bosworth and Konstantinos Michimizos, for being a joyful presence in the lab. Finally, Marjorie Joss has been very helpful and patient as I placed a large numbers of orders through her.
As the apparatus design evolved, the focus shifted towards conducting animal experiment. On rat experiments, Dr. Matthew Wilson provided critical advices that greatly influenced the experiment design. Dr. Simon Giszter of Drexel University, PA, welcomed inquiries through emails and in person. Dr. Gang Song shared a lot of his time to help me initiate my very first animal experiment. Dr. Allison Hayward gladly served as an overseeing animal expert throughout the experiments. Catrina Wong, a veterinarian, was a very pleasant person to work with who were always offering helping hands.
I give my big thanks and love to my parents who are in Korea. I am sure they are as relieved to see this thesis as I am now. I cannot thank them enough for the amount of support and encouragement throughout my life. Yun-jeong is my sister, my life-long friend and a mentor to whom I owe a lot. Thank you, my sister, mom, and dad.
And finally, I thank my true companion, Sangeun. Through all the challenges and years of hardship, she has been on my side strong and patient. She was the one who truly understood and supported my views and actions in the past few years. Her presence made me rethink what happiness in life is about. Thank you, Sangeun.
This work was supported by New York State Center of Research Excellence CO19772, the Eric P. and Evelyn E. Newman Fund, Gloria Blake fund, and Samsung Scholarship.
Contents
A b stra ct ... 3
A cknow ledgem ents ... 4
1 Introduction... 23
1.1 Spinal Cord Injury ... 24
1.1.1 N um ber of Patients ... 25
1.1.2 Severity of Injury ... 25
1.1.3 Life Expectancy and Lifetim e Cost ... 26
1.2 M ethods to A id Recovery from SCI ... 28
1.2.1 Conventional M ethods... 28
1.2.2 Current Progress in the Field ... 29
1.3 U sing Therapeutic Robots... 35
1.3.1 Upper Extrem ity Robotic Therapy for Stroke ... 35
1.3.2 Low er Extrem ity Robots for Neurological Injuries... 36
1.4 Sum m ary, G oal and Thesis Organization ... 37
2 Central N ervous System and Locom otion ... 39
2.1 M otor Function-related Anatom y of the CN S... 39
2.1.1 The Spinal Cord... 40
2.2 Sensory Inform ation on Interlimb Coordination... 42
2.2.1 Studies in Cats ... 43
2.2.2 Studies in Other Anim als... 44
2.2.3 Studies in Hum ans ... 44
2.2.4 Im plications for Recovery from SCI... 46
2.3 Studies on N eonatal Rats and Rat Embryos... 46
2.3.1 Locomotor studies on the neonatal spinal cord, in vitro preparation ... 46
2.3.2 Locom otor studies in rats, in vivo preparation ... 47
2.3.3 Developm ent of the rat spinal cord... 48
2.3.4 Im plication for Recovery from SCI... 50
2.4 Spinal N etwork M odels... 51
2.4.1 Interlimb coordination ... 51
2.4.2 Lower limb coordination ... 52
2.4.3 Im plications for SCI research ... 54
2.5 Discussion ... 54
2.5.1 Using Anim al M odels... 54
2.5.2 Im plications for the Apparatus Design... 54
3 Apparatus Concept and Requirem ents... 57
3.1 Requirem ents for the Apparatus... 57
3.2.1 The Rat Stepper ... 59
3.3 D esign Concept ... 62
3.3.1 Early D esign Concepts ... 62
3.3.2 Current D esign Concept ... 64
3.4 Technical Challenges ... 67
3.4.1 Interfacing w ith the Anim al... 67
3.4.2 M inim um Encum brance to the A nim al ... 68
3.4.3 Lack of Sim ilar Precedents... 69
4 D esign and Im plem entation of the Rat M odule... 71
4.1 D esign Consideration ... 71
4.1.1 N um ber of A ctuated Degrees of Freedom ... 71
4.1.2 A ctuator Selection ... 73
4.1.3 D iscussion of M otor Selection ... 75
4.2 D etailed Configuration... 78
4.2.1 Overall D esign ... 78
4.2.2 Robotic A rm ... 83
4.2.3 Custom Force Sensor... 85
4.2.4 Base and Cover D esign... 88
4.4 Supporting H ardw are ... 94
4.5 Sum m ary and D iscussion... 95
5 Body-W eight Support System ... 98
5.1 M otivation ... 98
5.2 Body-W eight Support System (BW SS)... 99
5.2.1 Configuration... 99
5.2.2 The R 19 Robot A rm ... 101
5.4 V ision Feedback... 104
5.4.1 W hy U se V ision Feedback? ... ... ... ... 104
5.4.2 Im age Processing ... 106
5.4.3 Cam era A ttachm ent... 110
5.5 W eight Bearing ... 110
5.6 W iring... 112
5.7 Perform ance ... 114
5.8 D iscussion ... 116
6 Simple and Robust Method to Manage Uncertainties with Discrete-State Control ... 118
6.1 D ifficulties due to the Current Selection of the M otor... 119
6.1.1 Position Control in the Presence of Large Static Friction ... 119
6.1.2 Im proving Back-Drivability ... 122
6.2.1 The D SC-Schem e... 127
6.2.2 U sing D SC to M odulate Position ... 128
6.2.3 U sing D SC to Im prove Back-Drivability ... 129
6.2.4 Another Example -Torque Modulation with a Series Damper ... 130
6.3 Form ulation of D iscrete-state control ... 134
6.3.1 Form ulation ... 134
6.3.2 H euristic M ethod to Select the Param eters... 135
6.3.3 Sim ulation Exam ples... 139
6.4 D iscussion ... 142
6.4.1 System order and DSC ... 143
6.4.2 Com parison w ith Sliding M ode Control (SM C) ... 146
6.4.3 Other rem arks... 148
6.5 Conclusion... 150
7 V alidation Experim ents w ith Rodents: Part I ... 152
7.1 M otivation ... 152
7.1.1 Questions A ddressed in the Experim ents ... 153
7.2 M ethods... 154
7.2.1 Experim ents U sing a 'M ockup'... 154
7.2.4 A ddressing Anxiety of the Anim al... 158
7.3 Results ... 159
7.3.1 Coupling Strategy ... 159
7.3.2 K inem atic Constraint ... 160
7.3.3 Apparatus Function... 160
7.3.4 Anim al A nxiety ... 162
7.4 D iscussion ... ... -... --... 164
7.4.1 Anxiety w as Reduced through Training ... 164
7.4.2 Coupling Strategy and K inem atic Constraint... 164
7.4.3 Apparatus Function... 165
7.4.4 Other Rem arks ... 168
8 V alidation Experim ents w ith Rodents: Part II... 170
8.1 Experim ent Setup ... 170
8.1.1 Encouraging Forward Locom otion... 172
8.2 Results ...-... -... 175
8.2.1 Observed M ovem ents ... 175
8.2.2 Stride Length ... ... 175
8.2.3 Stride D uration ... 175
8.2.4 Sw ing Duration per Stride Duration (Duty Cycle)... 176
8.2.6 End Effector Trajectory ... 181
8.3 Discussion ... 182
9 Conclusion ... 188
9.1 Im plication for the Field of Research... 188
9.2 Future Prototypes ... 189
9.3 Sum m ary ... 191
A Linkage Forward Kinem atics and Jacobian... 193
B Program m ing the R19 Robot ... 198
B.1 Roboforth... 198
B.2 Position Control of R 19... 199
C Experim ent Procedure ... 206
List of Figures
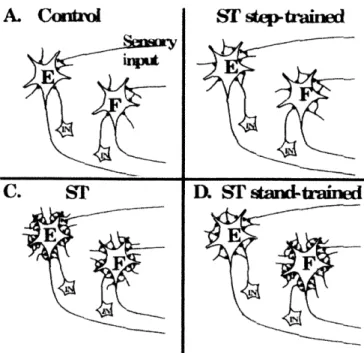
Fig. 1-1. Step training with weight support and manual assistance on a treadmill [5]. ... 29 Fig. 1-2. Schematic illustrating changes of inhibitory synapses (gray dots) around the ... 33 extensor (labeled as E) or flexor (F) neuron groups in cats under various motor training
conditions. Before injury (A), the number of inhibitory synapses in each neuron group is small. After the spinal transection (ST), the populations of the inhibitory synapses vary depending on the types of training. It can be seen that the training of a certain locomotion task decreases the number of inhibitory synapses in the neuron group that is responsible for that specific task. [26].
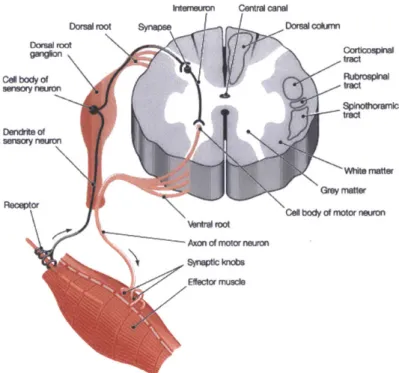
Fig. 2-1. Schematic of the spinal cord, cross-section, simplified. 1: Spinal Ganglion. 2: ... 41 Dorsal root. 3: White matter. 4: Gray matter, dorsal horn. 5: Gray matter, ventral horn.
6: Ventral root.
Fig. 2-2. Schematic of corticospinal tract. The neurons originate from the motor cortex ... 41 (top). 80% of them decussate to the contralateral side in the medulla oblongata
(middle). These neurons make synaptic connections to interneurons or directly to motoneurons within the gray matter (bottom).
Fig. 2-3. A photo of a thymidine radiogram of an embryonic rat spinal cord [78]. The ... 49 cell nuclei are clearly visible.
Fig. 2-4. Diagram of the spinal cord, muscle and relevant neurons. ... 50
Fig. 2-5. Schematic of a postulated variation of neural movement control during ... 53 different motor tasks [83]. Depending on the task, the brain may a) inhibit interlimb
coordination, or b) promote cross-talk while minimizing its control over the upper limb.
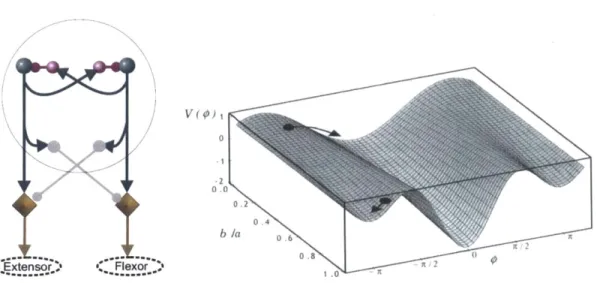
Fig. 2-6. Left: Schematic of the half-center model of Brown and Lundberg. Each of the ... 53 two centers (blue circles on the top corners) mutually inhibits the other. Right: The
Haken-Kelso-Bunz (HKB) potential described by V(p) = acosp - bsingp, where p is the relative phase between the motion of the two limbs. The parameter b/a is related to the movement frequency.
Fig. 3-1. A rodent treadmill from Panlab (www.panlab.com). ... 59
Fig. 3-2. Earlier designs of the Rat Stepper. (A) In the first version in 2000 haptic ... 60 devices simulated virtual ground [88]. (B) A subsequent version in 2002 used a
treadmill [89].
Fig. 3-3. Current configuration of the Rat Stepper[87]. ... 61
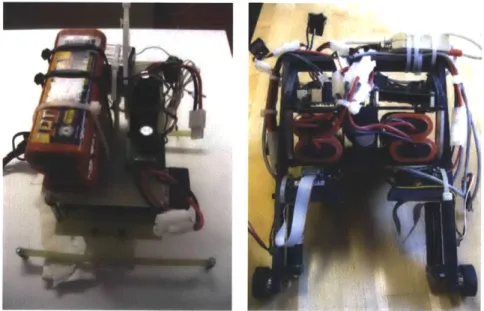
Fig. 3-5. Early prototypes of the wireless configuration. Each prototype weighed more ... 64 than 2 kg and was taller than 25 cm. (The dark-orange components on the top of the left
figure and in the middle of the right figure are the onboard batteries.)
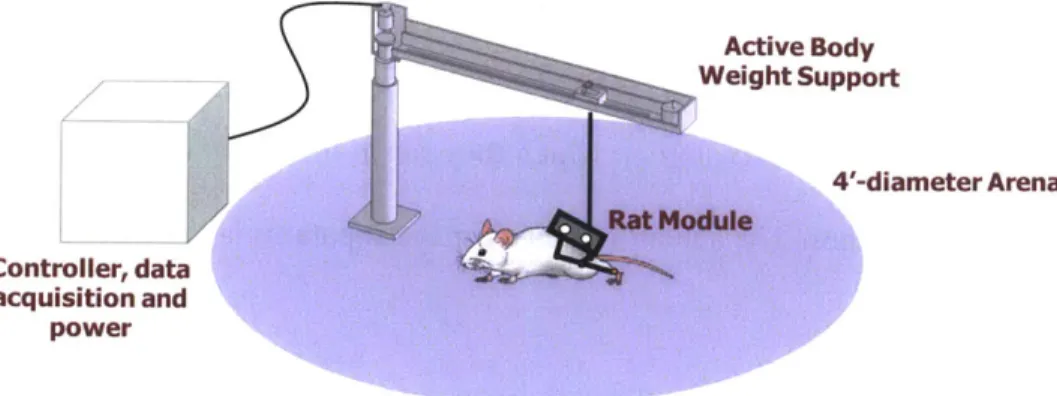
Fig. 3-6. Current concept of the system, consisting of the Rat Module, BWSS, and an ... 67 external computer for control, DAQ and power. The animal is free to move inside the
circular 4'-diameter "arena".
Fig. 4-1. Advantages and disadvantages of many or few actuators. ... 71
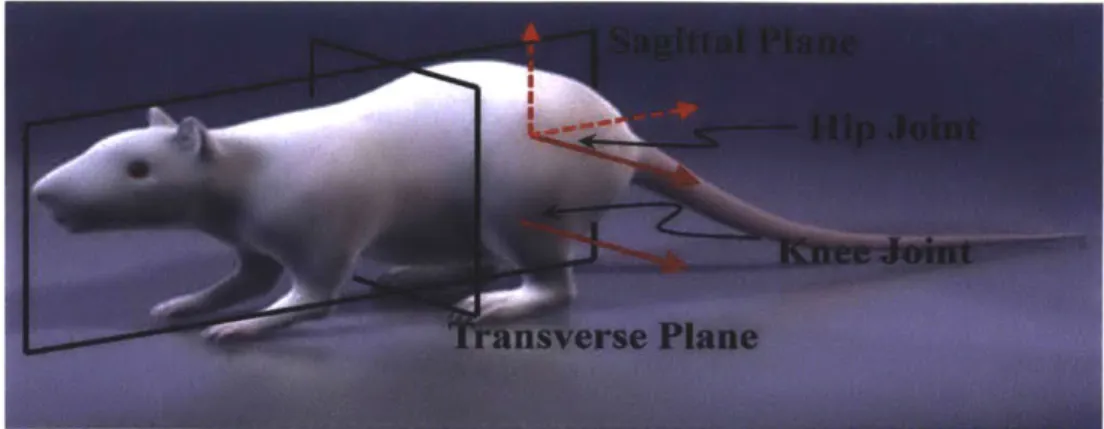
Fig. 4-2. Body planes and DOFs of the hip and knee of the rat hindlimb. The arrows ... 73 represent the axes of rotation for each joint. The solid red arrows indicate the two DOF
that are normal to a sagittal plane, responsible for hindlimb motion in a sagittal plane. (The 3D model is taken from Turbosquid.com)
Fig. 4-3. Rough estimate of required power for the motors. ... 74
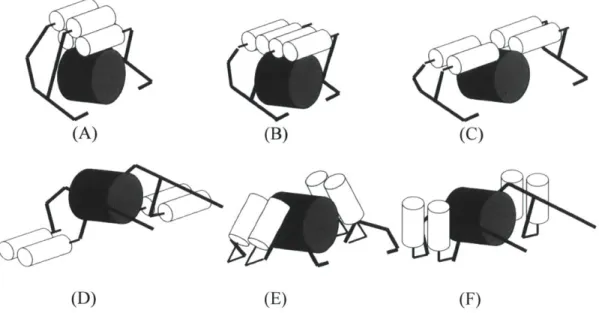
Fig. 4-4. Variations of Configuration #2 and #5. The white cylinders represent the ... 81 motors, black bars depict the linkage mechanism, and the large gray cylinders represent
the animal's lower back.
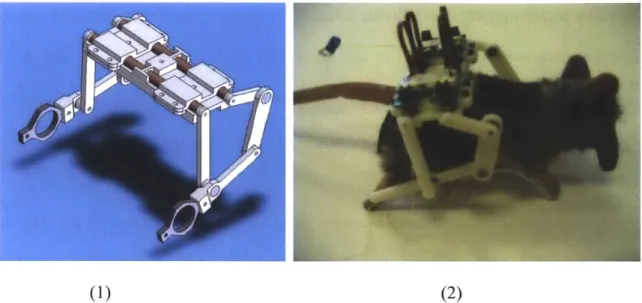
Fig. 4-5. First prototype with configuration (A) from Fig. 4-4. (1) CAD model. (2) first ... 82 prototype fabricated in plastic. The flexible connectors to the motors (brown) emerge
from both sides of the mechanism.
Fig. 4-6. One of the later prototypes with configuration (C) from Fig. 4-4. (1) A CAD ... 83 model with the motors depicted as brown cylinders, and (2) an early prototype with
motors placed on an actual-size rat doll. Note that the flexible connectors are all facing upwards and are easy to access.
Fig. 4-7. Figure from [95] showing the normal gait profile of a rat on a treadmill (left) ... 84 and a plot from the linkage calculation (right). The two red dots represent the location
of the two motor axes, and the blue area denotes the reachable end points of a certain 5-bar linkage configuration (Fig. 4-8 on the right). The red line is the ankle position with respect to the hip joint as derived from [95].
Fig. 4-8. A selection of alternative linkage configurations. The design on the right with ... 85 grey background is the final design.
Fig. 4-9. Final linkage dimensions. Triangle DAC forms one rigid link. ... 85
Fig. 4-10. Custom force sensors. (A) configuration and (B) actual photo of one force ... 87 sensor. The two bundles of wires are for each force measurement direction. The strain
gages were placed on the inner surface of the ring, forming two independent Wheatstone bridges.
Fig. 4-11. Exploded view of the base, two covers and the four motor assembly.
Fig. 4-12. A belt-type harnesses on the animal. (Top-left) the cloth belt was put on the ... 91 animal while the rat was anesthetized briefly. (Top-right) the rat module was placed on
the belt using Velcro tape. This cloth belt easily slipped off the rat's body. (Bottom) the Elastikon@ tape around the animal's waist. The tape remained secure on the animal's fur.
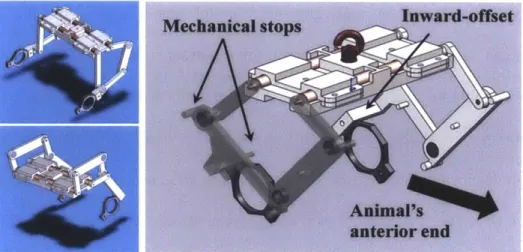
Fig. 4-13. Photo of the Rat Module placed on a plastic block. Features of this device are ... 93 enumerated and explained in the table.
Fig. 4-14. Supporting hardware items were fixed onto the utility cart. The cart could ... 94 easily be transported between labs.
Fig. 5-1. R19 robot from ST-Robotics. Left: photo of the robot (a) and the controller... 102 box (b). Right: actuated degrees of freedom.
Fig. 5-2. Illustration of the idea of using a force sensor to measure the position error... 106 between the BWSS and the animal. The force sensor measures the shear force in a
compliant medium, whose compliance is presumed known.
Fig. 5-3. Video camera used in the BWSS (Logitech Quickcam Pro 9000). ... 107
Fig. 5-4. Examples of processed images acquired from the video camera. The yellow... 109 pixels are those detected as 'true green' using the algorithm presented above. All
pictures are 320 pixels by 240 pixels. (a) Rat Module on a rat doll. This is a typical view from the camera. (b) through (d) are cases when the video system may work less efficiently. (b) In rare cases, the wires may be tangled and partially block the view of the Rat Module. (c) The rat may be moving quickly, blurring the image. (d) The animal may rear up such that the Rat Module is slanted relative to the image plane.
Fig. 5-5. Camera mount for coupling the video camera to the R19 robot. Left: CAD... 110 drawing of the mount. Right: Attachment to R19.
Fig. 5-6. Weight supporting cord and tension spring attached to the BWSS and the Rat... 111 Module.
Fig. 5-7. Wire connections. See text for explanations. ... 112
Fig. 5-8. Experiment setup viewed from above. The body-weight support system was... 115 mounted on a low-profile wooden cart. The animal, initially anesthetized, was placed in
the trapezoidal rat arena.
Fig. 5-9. Data from an experiment showing the animal's movement in the rat arena. See... 115 text for details.
Fig. 6-1. Schematic of the system used. A miniature brushless DC motor (Maxon EC6,... 120 diameter 6 mm) was connected to a load through a planetary gearhead (57:1 reduction).
An encoder was mounted on the motor shaft. The current into the motor was determined by a trans-conductance servo-amplifier (Copley Controls, Accelnet), which was driven by a control signal from a computer, in which different control schemes were programmed and tested.
Fig. 6-2. Open-loop velocity responses of the system in Fig. 1 to a quasi-static ramp... 121 input. The input rose from 0 V to 10 V over 10 seconds. The velocity responses from
four different trials are shown. The voltage at which the system first responded with non-zero velocity was different from trial to trial (by as much as 10% of the maximum control effort of 10 V). Once moving, the system reached its maximum velocity of
51,000 rpm after less than a 0.2 V increment of the input.
Fig. 6-3. Behavior of the plant of Fig. 6-1 when driven by a PID controller to modulate... 122 the position of the motor shaft. Plotted are the gear-reduced, expected positions and
error of the shaft outside of the gearhead, assuming no backlash. (A) Position tracking. The system response (blue) deviated from the commanded trajectory (red). (B) Time history of position tracking error. The error was largest at low velocities and varied substantially from cycle to cycle.
Fig. 6-4. The 2-DOF manipulator using two motors described in section 4-1. A 2D force... 123 sensor measured the x and y interaction forces at the tip.
Fig. 6-5. (Left) Kinematic model of the system in Fig. 6-4. M1 and M2 are the two... 124 motors with poor back-drivability, and A is the point of interaction which is the tip of
the force sensor in Fig. 6-4. (Right) The force feedback scheme used in this study (right).
Fig. 6-6. Trajectories and interaction forces while manually back-driving the system in... 126 Fig. 6-4. Top row: Open-loop measurement with no controller. The trajectory consisted
almost entirely of arcs, characteristic of only one motor back-driven at a time due to significant static friction of the other motor. The peak interaction force was in excess of 1.3 N. Bottom row: Force feedback using a PI controller. The back-drivability is enhanced, although interaction force could occasionally exceed 0.5 N.
Fig. 6-7. Response of the system of Fig. 6-1 to DSC with V= 5 V, M= 0.0125 rad... 129 Plotted are the gear-reduced, expected positions and error of the shaft outside of the
gearhead, assuming no backlash. (A) Position tracking. The commanded input (red) and the response (blue) of the plant in Fig. 6-1 to a DS-controller. The two curves are on top of each other. (B) Time history of error (blue), a substantial improvement over the performance with PID control (red).
Fig. 6-8. Force feedback using DSC. Back-drivability is enhanced with a peak... 130 interaction force substantially less than 0.2 N.
Fig. 6-9. The DC motor with gearhead is connected in series with a rotary damper. The... 132
right side of the damper is the torque sensor. The torque reading is determined by the velocity of the motor shaft. Fig. 6-10. Torque modulation with DSC. (A) Without the damper in series and in 2 kHz... 133
sampling rate. (B) Damper is in series and with 200 Hz sampling rate. RMS error was 0.007 V. (C) Damper in series and with 2 kHz sampling rate. RMS error was 0.005 V In all cases, V= 10 V, M= 0.01 V. Fig. 6-11. System F(u) modulated by the controller G. ... 134
Fig. 6-12. Function D(e) used in (a). ... 135
Fig. 6-13. Step response of a system and the maximum slope S. ... 137
Fig. 6-14. An example where undesired bouncing of x can occur. ... 139
Fig. 6-15. DSC on a lightly damped 2"d order system ((= 0.087 in Table 6.3). Top:... 144
Command (red) versus the response with DSC control (blue) after 5% settling time (5 sec). Bottom: error. RMS value over this time window is less than 5% of the amplitude of the sine input. Fig. 6-16. DSC on a system in Fig. 6-15 with an added zero at -10. Despite the... 145
similarity in the step response, DSC performs much better when a zero is added. Top: Adding a zero at -10 does not drastically improve the system response to a step input. Middle: DSC performs well. Command (red) and response (blue) are indistinguishable. Bottom: error. RMS value after transient response (before t = Is) is 0.23% of the amplitude of the sine input, an improvement of more than 95% improvement over the no-zero case in Fig. 6-15. Fig. 6-17. (A) A motor-load system can usually be modeled as a 2nd order system with... 146
no zero for F = O/Vin. (B) A damper in series with the load introduces a zero to the transfer function of F= wi/Vin. Fig. 6-18. Left: The saturation function often used in SMC. Right: DSC may be... 148
considered to use an alternative function with more aggressive suppression of control action within the boundary layer. Fig. 7-1. 1D-arena used in the experiment. ... 156
Fig. 7-2. Experiment setup. ... 158
Fig. 7-3. Collection of movements commonly observed in this experiment. ... 160
Fig. 7-4. Trajectory of the left and right leg ankles plotted over the entire workspace of... 161 the 5-bar linkages. The yellow dotted circle represents the area in which the ankle
position would be expected in normal (sober) conditions.
Fig. 7-5. Magnitude of the force measured at the left hindlimb ankle. ... 162
Fig. 7-6. Stride length (left) and stride duration (right) compared between 1: an animal... 165 with coupling attachments only, and 2: identical animal trained in mockup.
Fig. 7-7. Recorded force vectors are plotted on top of the trajectories of the ankles... 166 shown in Fig 7-4. The vectors are plotted at 100 ms intervals. Force vector of length 1
(mm) represents the force magnitude of 0.1 N. Regions inside the red-dotted circle are where the ankles were for most of the duration of the experiment.
Fig. 8-1. Addressing back-drivability of the Rat Module (these figures were presented... 171 in chapter 6.) Trajectories and interaction forces while manually back-driving the right
side of the Rat Module. Top row: Open-loop measurement with no controller. The trajectory consists of arcs, characteristic of only one motor back-driven at a time due to significant static friction on the other motor. The peak interaction force is over 1.3 N. Bottom row: with force feedback. Back-drivability is enhanced with peak interaction force of 0.2 N.
Fig. 8-2. The animal was trained to respond to and walk through the dark 'hallway'. A... 173 side wall was transparent to allow video recording of the locomotion.
Fig. 8-3. Snapshots from a live animal experiment. Top: The Rat Module mounted on... 174 the animal. 1-Waist coupling. 2-Ankle coupling. 3-Wires for the sensors and actuators.
4-Compliant elongation springs for partial weight support. Right: snapshots from the video recorded while the animal performed self-paced, forward locomotion.
Fig. 8-4. Stride Length data. Left: Mean ±STD. There is no significant difference... 178 between cases. Right: Data histograms.
Fig. 8-5. Stride Duration data. Left: Mean ±STD. Significant differences from the... 178 unconstrained case are marked with * (p < 0.05). Right: Data histograms.
Fig. 8-6. Ratio of swing duration to stride duration (Mean ±STD). No significant... 179 difference from the unconstrained case were observed.
Fig. 8-7. Time-averages of interaction force magnitude during forward locomotion... 180 (blue), and the average peak interaction force. The left side showed larger interaction
forces.
Fig. 8-8. End effector trajectories derived from encoder recordings during nine... 182 occurrences of forward locomotion are superimposed.
Fig. B-1. Coordinate frames of the BWSS robot in the "home-position". The x-y frame... 201 (black), also called the robot frame, is the fixed coordinate for the position of the
end-effector of the robot. The x'-y' frame (brown) is attached to the end-end-effector. The x"-y" frame is also attached to the end-effector (more specifically, to the camera attached at the end-effector). The positive y" axis is opposite to the positive y' axis. In this "home-position", the x'-y' frame is offset 360 mm in the y-direction from the robot frame.
List of Tables
Table 1.1 Life Expectancy of SCI Patients for Persons Surviving At Least One Year ... 27
Post-Injury [3] Table 1.2 Lifetime Costs of SCI Patients [3] ... 27
Table 2.1 Apparatus Design Considerations ... 55
Table 4.1 List of Motors Considered ... 75
Table 4.2 Motor and Gearhead Specification ... 76
Table 4.3 Candidate Configurations ... 80
Table 5.1 Possible BWSS configurations ... 100
Table 6.1 DSC performance on F = 10/(s+10), L = 0.001 s and xc = sin(2nt) ... 141
Table 6.2 DSC performance on F = 24/(s2 + 10s + 24), L = 0.001 s and xc = sin(27rt) ... 141
Performance evaluated after 5% settling time (0.6 sec) Table 6.3 DSC with 2"d order systems. F = oo2/(s2 + 2(oos + W02) where oo2= 50 ... 144
Command = 1-sin(27i-t), Frequency = 1 kHz Table 8.1 Stride Length ... 177
Chapter 1
Introduction
Every living organism's instincts drive it to pursue a longer and healthier life. Humans are no exception, as we have long been seeking the panacea for every illness, disease or injury, with the hope of extending life. For a long time in human history, the available remedies for illness or injury were limited to naturally available substances that were taken orally or applied to the skin surface. While the first record of medicine in the west is dated at 420 BC, other forms of medical technology that are available today did not exist, and even those that did remained in their infancy until much later. Surgery was in a primitive state until the early 19th century, when new
solutions could better address the major problems of controlling bleeding, pain, and infection. Vaccinations and the injection of drugs became more effective only after the industrial revolution.
In the 2 0th century, advances in science and engineering have led to advances in medical
technology, such as new diagnostic methods or treatment options. Synthetic drugs became widely popular by the 1950's [1]. The first human kidney transplants were performed in 1954. Magnetic Resonance Imaging (MRI) and Computed Tomography (CT) technology were developed in 1971, leading to the first commercial MRI machine in 1980. Surgical robots emerged in the 1980's, while robots for rehabilitation became available in the 1990's. As a result of these advances and many others, the life expectancy at birth in the United States increased from around 50 years in the 1900's to over 70 years in the 1990's [2]. Further, as of 2011, identifying breast cancer in its early stages gives patients an excellent prognosis, with the same
therapy are a few technologies in development that have potential to drastically alter the field of medicine.
Despite the general trend towards longer and healthier life, humans are still challenged by numerous forms of illness and injury. For example, neurological injuries or illness such as Alzheimer's disease, stroke, or spinal cord injury are receiving more attention than in the previous century as researchers are enthusiastic to find a cure. Patients with these injuries suffer decreased or even completely absent sensory-motor functions in their legs, arms or sometimes the whole body below the neck. As the number of patients with such injury continues to grow, their lowered quality of life as well as the financial burden of their care adds to the motivation to find effective methods for recovery.
This thesis is in line with the ongoing quest to find effective treatments to aid the recovery of patients with lost sensory-motor functions due to neurological injuries. In particular, the focus is on spinal cord injury and lower extremity function, as well as the neural circuitry associated with the biomechanics of locomotion. As a large volume of research in neurological injuries is done in animal models, this work focuses on developing and validating a new tool for animal locomotion research related to spinal cord injury.
1.1 Spinal Cord Injury
Spinal Cord Injury (SCI) is a neurological disorder described as a disturbance of the spinal cord that results in loss of sensation and/or mobility. The main causes of the injury include motor accidents (40%), falls (28%), violence (15%) or sports-related injuries (8%) [3]. Depending on the severity and location of the injury, the patient may suffer various degrees of sensory-motor
deficit such as being paraplegic or tetraplegic, and cases of full-restoration of functionality are extremely rare.
1.1.1 Number of Patients
There are more than 11,000 new patients each year in U.S., where less than 1% of the new patients fully recover their sensory and motor functions. The total number of patients keeps growing from 210,000 in 2002 to 250,000 in 2006, and the total is estimated to have reached 265,000 in 2011 [4][3]. The average age when an SCI occurs has been gradually increasing, from 28.7 years during the 1970's to 40.7 years in 2005. The increase in these numbers is in part due to the higher survival rate of the patients after the incident that caused the injury, which may also account for the increasing trend in the number of the SCI patients.
1.1.2 Severity of Injury
Persons with legions at a higher level of the spinal cord (namely in the cervical segments) become tetraplegic, while patients with a lower injury site (thoracic, lumbar, or sacral segments) become paraplegic. At hospital discharge, it is reported that 39.5% of patients are incomplete tetraplegic, 22.1% are complete paraplegic, 21.7% are incomplete paraplegic, and 16.3% are complete tetraplegic [3]. Less than 1% of patients recover full sensory-motor functions at discharge.
The ASIA scale is an SCI impairment assessment scale developed by the American Spinal Injury Association. It defines the level of spinal cord injury as follows:
B: Incomplete: Sensory but not motor function is preserved below the neurological level and includes the sacral segments S4-S5.
C: Incomplete: Motor function is preserved below the neurological level, and more than half
of key muscles below the neurological level have a muscle grade* less than 3.
D: Incomplete: Motor function is preserved below the neurological level, and at least half of
key muscles below the neurological level have a muscle grade* of 3 or more. E: Normal: motor and sensory functions are normal.
(* Muscle grade of 3: subject can hold a limb against gravity but no additional pressure can
be tolerated.)
A 'complete' injury is declared if the patient has a level below which no sensory-motor
functions remain at all. An 'incomplete' injury is every other situation except being normal (ASIA E level as described above).
1.1.3 Life Expectancy and Lifetime Cosi
The life expectancy of SCI patients continues varies with several factors, such as the severity mortality of SCI patients is higher than in normal are expected to live on average another 17 years patients are very high, as can be seen in Table II. loss of income from loss of productivity. In order as reduce the patients' financial burden, partial function in these patients is of great interest in thisto increase as well. The specific expectancy of injury and the age at injury. While the persons, patients whose age at injury was 20 (Table 1.1). The life-long expenses for these Note that these figures do not include indirect to increase their general quality of life as well to full recovery from loss of sensory-motor field of study.
Table 1.1
Life Expectancy of SCI Patients for Persons Survi ving At Least One Year Post-Injury [3]
Individuals Motor Low High Ventilator
Age at Without Functional Paraplegia Tetraplegia Tetraplegia Dependent
Injury Injury at Any (C5-C8)* (C1-C4)* Any Level
Level ______
20 58.6 53.0 45.8 41.0 37.4 23.8
40 39.4 34.5 28.2 24.2 21.2 11.4
60 22.4 18.0 13.2 10.4 8.6 3.2
*C 1, C4, etc. refers to the injury location at the spinal cord, where higher number refers to lower
site of lesion.
Table 1.2
Lifetime Costs of SCI Patients [3]
Average Yearly Expenses (USD) Estimated Lifetime Costs by Age at
Severity of Injury (USD)
Injury First Frst
Year
Each Subsequent Year 25 years old 50 years old25_yearsold 50_yearsold High Tetraplegia 985,774 171,183 4,373,912 2,403,828 (C1I C4)* _______ Low Tetraplegia 712,308 105,013 3,195,853 1,965,735 (C5-C8)* Paraplegia 480,431 63,643 2,138,824 1,403,646 Incomplete Motor Functional 321,720 39,077 1,461,255 1,031,394 at Any Level *Cl, C4, etc. refers site of lesion.
1.2 Methods to Aid Recovery from SCI
1.2.1 Conventional Methods
While potential therapeutic strategies under research in animal models include cell implants, pharmacological interventions, and locomotor training, current rehabilitation methods applicable to human patients are limited to compensatory strategies for accomplishing mobility or strengthening muscles above the level of lesion until early 2 1st century [5][6]. In the past 10
years, physical therapies motivated by findings in animal studies have shown partial success in human patients. For example, a young patient has scored a lower ASIA level after receiving physical therapy motivated by findings from animal research [5]. This may be possible because the spinal cord below the lesion still maintains functional neural circuits and can respond to sensory inputs. While physical therapy is currently the only available option to improve motor functions in human patients, the mechanism behind its partial success is still largely unknown and calls for further studies. Other methods such as cell implants are not mature enough for human trials at this point, but show significant potential in animal studies.
Fig. 1-1. Step training with weight support and manual assistance on a treadmill [5].
1.2.2 Current Progress in the Field
Research in SCI reports observations regarding the functionality (or automaticity) present in the spinal cord that may play a significant role in locomotion when supra-spinal control is compromised due to injury. Functional recovery after SCI may be possible, because 1) the spinal cord has the automaticity to perform certain tasks, and 2) the spinal cord has an ability to adapt to any imposed activity (functional plasticity). As mentioned previously, there are a number of different research pathways to improve recovery from SCI. Most of the attempts to facilitate recovery from SCI listed in this section show modest results at best, but the ultimate goal may be reachable by combining these therapies.
Note that a large volume of studies are done with animal models of SCI, and especially with rats. There are a number of benefits of using animal models instead of human subjects for this research. Firstly, the range of experiments that are justifiable with animals is much wider than those that can ethically be done with humans. For example, one can prepare decerebrated cats (intact animals in which connections between the spinal cord and cerebral hemispheres have been severed) to study the effect of functional isolation of the spinal cord from the brain. Also, one can use pharmacological agents that are not approved for use with humans but may be justifiable for animal research. Secondly, in animal studies, one can control important factors of the SCI such as the intensity of injury, lesion site, days since injury or even genetic homogeneity of the subject population. It is effectively impossible to recruit human SCI patients with such a homogeneous intensity of injury, lesion site, etc.
1.2.2.1 Relevant Observations
There are three major observations after SCI that affect locomotor function. 1) Loss of coordination between motorneuron pools, 2) deficits in activation of specific motorneuron pools, and 3) atrophy of skeletal muscle. At present, there is evidence that 1) motorneuron pools can become more effectively coordinated [7][8], 2) the level of activity in specific motorneuron pools can be elevated [7][8][9], and 3) the amount of muscle atrophy can be at least partially and perhaps fully recovered [10][11][12][13][14]. In spite of this evidence, there has been no full recovery from SCI in humans. However, in cats, almost full recovery is reported.
Spinal automaticity remains even after the absence of supra-spinal input. After a complete transection or injury, automaticity in the spinal cord can be attributed to two components: a Central Pattern Generator (CPG) [15][16], and the sensory input to the spinal cord. When they
work in synergy, relevant patterns of locomotion can emerge. The temporal patterns of ensembles of peripheral inputs may have to be matched with that of the CPG for locomotion to continue effectively. In other words, only the specific sensory input patterns (such as those generated by walking) may generate appropriate motor patterns in the CPG.
Some examples of conserved automaticity in the spinal cord are shown in both human and cat studies. In an ASIA A subject (complete SCI), muscle activation patterns for supporting load can occur at the appropriate timing within the step cycle [17]. Similar loading-related responses have been described in cats whose spinal cord is completely transected at a low-thoracic level [18]. Also, a series of experiments on spinal cats demonstrated that a stimulus to the dorsum of the paw of a spinal cat during the swing phase would induce ipsilateral flexion and contralateral extension [19].
In addition, voluntary initiation of locomotion can be observed in SCI patients. For example, an ASIA A subject standing with bilateral weight support can initiate stepping by shifting body weight, extending the hip of the contralateral leg, and then leaning forward [20]. By shifting the weight of the upper body and therefore unloading a limb at the end of the stance phase of a step, one can facilitate the initiation of the swing phase of that leg [21]. This observation is in agreement with the load-related human experiments mentioned in the previous section.
1.2.2.2 Various Facets of Research
Motor Training
In humans, combinations of motor training that involve body-weight supported treadmill training as well as overground training were reported to enhance the level of motor pool
slow [9]. Some of the early animal studies reported that in spinal cats, full weight bearing treadmill training for 2-3 weeks results in close-to-normal EMG behaviors in the muscles [22][23]. Trained cats, compared to non-trained cats, can produce accurate timing of toe-off and
paw-contact even at higher treadmill speeds [22]. Also, it has been shown that motor training can markedly change the physiological, biochemical and pharmacological state of the spinal cord. (See figure 1-2.) Presumably, motor training works to repetitively activate the appropriate extensor and flexor networks in a specific temporal/spatial pattern so as to enhance the coordination of the motorneuron pools [24].
Sensory Stimulation
One can benefit from above-threshold sensory stimulation that may enhance a specific part of the cyclic pattern of neural activity that may be otherwise preventing normal steps. One example in humans involves stimulating the peroneal nerve at the end of the stance phase to induce a flexor reflex and therefore help the initiation of the swing phase. Subjects improved their walking speeds by 45% after a year of such training [25].
A. Control
44 1inj C. STE
ST
~p-trairEd D. ST stadtrafindFig. 1-2. Schematic illustrating changes of inhibitory synapses (gray dots) around the extensor (labeled as E) or flexor (F) neuron groups in cats under various motor training conditions. Before injury (A), the number of inhibitory synapses in each neuron group is small. After spinal transection (ST), the populations of inhibitory synapses vary depending on the types of training. It can be seen that the training of a certain locomotion task decreases the number of inhibitory synapses in the neuron group that is responsible for that specific task. [26].
Spinal Cord Stimulation
Direct stimulation of the spinal cord results in some positive improvement in motor function. For example, in intact cats under anesthesia, L3-L4 stimulation of the dorsum of the spinal cord induced hindlimb muscle group activation [27]. In an ASIA C human, an implanted electrode at the upper lumbar spinal cord (dorsum) significantly improved motor performance [28]. Although different frequency and amplitude of stimulation resulted in different physiological effects, a generalized, non-specific electrical stimulation of upper lumbar neurons may be sufficient to generate rhythmic stepping movements of the lower limb [24].
Some biochemical adaptation that degrades motor performance occurs after spinal cord injury [17]. Use of the right drugs can manipulate the 'state-dependence' of the degraded neural circuits within the spinal cord such that it may respond 'better' to appropriate stimulation. For example, when small doses of strychnine (glycine receptor antagonist) were given to adult spinal cats, they showed some weight-bearing, alternating steps even without any previous motor training [29]. There are multiple neurotransmitters and neuromodulatory systems that can facilitate or degrade motor performance. Hence, one must use the right combination of drugs to achieve a suitable physiological state for the spinal circuitry to respond to the relevant proprioceptive inputs.
Growthfactors
A biochemical agent known as brain-derived neurotrophic factor (BDNF) could possibly
stimulate axons to grow across the lesion of an injured spinal cord. The amount of BDNF in the spinal cord or in the muscles was increased in response to wheel running in rats [30] [31][32] [33], suggesting a positive role of BDNF in motor function recovery. The exact role of growth factor in these studies is only vaguely known at this point.
Cell Implants
There are four types of possible implants that may result in facilitation of lomocotor ability, which are listed here. They have all been reported to produce some positive preliminary results, especially in neonates.
- Peripheral nerves: for example, the intercostals nerves that are found around the ribcage are used.
- Fetal tissue: embryonic spinal cord tissues are used in SCI research in rats.
- Olfactory ensheathing cells (OECs): these cells are found in the olfactory mucosa and
are responsible for the life-long growth of neurons in this region.
- Schwann cells: these cells provide myelin insulation to axons, and also promote
regeneration of axons. Direct injection of these cells to the lesion site has resulted in some, although limited, functional reconnection in rats [34].
1.3 Using Therapeutic Robots
Therapeutic robots may greatly reduce the workload of therapists by providing similar physical assistance. These robots may be programmed to test and provide novel locomotor training protocols. Moreover, they may also be used to study neurological disorders. Robotic therapy may even be used in conjunction with other promising therapies, such as shown in a study with rats [35]. In short, there is a great potential for the use of robotic devices for therapy and basic research on neurological injuries.
1.3.1 Upper Extremity Robotic Therapy for Stroke
Rehabilitation of the upper extremity in stroke patients is the earliest and primary example of the significant advantages that robotic therapy has to offer to patients with neurological disease or injury. An upper extremity robot, the MIT-Manus, was used in a number of studies involving both acute [36] and chronic stroke patients [37][38]. In both cases, robotic therapy showed measurable benefits over manual conventional therapy. The results with chronic patients were particularly novel, since recovery in the chronic phase was thought to be absent. This robot has
been used later in attempts to identify other forms of robotic therapy, such as an EMG-triggered therapy [39], that may be of greater benefit. The success of MIT-Manus may have resulted, in part, because it was designed to be compatible with and take advantage of contemporary knowledge about neural control of upper extremity movement.
1.3.2 Lower Extremity Robots for Neurological Injuries
A number of robots have been developed for lower extremity rehabilitation after stroke or
SCI, such as Lokomat [40], ALEX [41], or ARTHuR[42]. However, none of these robots have
achieved a level of success similar to upper extremity robots. Although the machines exhibit excellent engineering design and implementation, they may have failed to be compatible with what little is known about lower extremity neural control during locomotion. For example, all current lower extremity therapy robots are built upon treadmills, while walking on a treadmill is known to be different from walking overground. Also, these robots restrain certain aspects of locomotion that may be important. For instance, the Lokomat does not permit weight shifting even though it is known that load-related sensory inputs play an important role in locomotion [43]. It is also common for these lower extremity robots to omit actuation at the ankle, despite the fact that this joint makes a major contribution to the propulsive force [44].
In short, the current lower extremity robots for rehabilitation appear to have been designed without properly considering what is currently known about lower extremity biomechanics and neural systems in locomotion. This is hardly surprising however - the current knowledge of neural control of human locomotion is sparse. Better understanding of human movement is necessary in order to design and implement useful rehabilitation robots.
1.4 Summary, Goal and Thesis Organization
This chapter can be summarized as follows:
- SCI is a neurological disorder whose complete cure is absent.
- SCI patients suffer reduced quality of life and significant financial burden .
- Current research to find a cure relies heavily on animal models (rats in particular)
- Promising research directions are 1) combinations of therapy that include motor
training, 2) robotic therapy based on knowledge of the biomechanics and neural control of movement.
Motivated by these findings, the research reported in this thesis aimed to develop a robotic device for basic research into locomotion and therapy for its restoration after neurological injury in animal models. In particular, the device is expected to enrich basic research on hindlimb locomotion in rats, which may serve as a model of lower extremity locomotion in humans.
The following chapters provide further motivation for the development of such an apparatus. Chapter 2 reviews relevant motor neuroscience on lower limb locomotion. Chapter 3 details the specific requirements of the apparatus based on these findings. Also, the basic configuration of the apparatus is presented and justified by comparison with existing equipment. Chapters 4 and 5 detail the design and implementation of the several hardware modules. Chapter 6 presents the engineering challenges and the solution developed. Chapters 7 and 8 document animal experiments to evaluate the apparatus. The thesis is concluded in Chapter 9 by discussing implications of the developed apparatus for the relevant field of research.
Chapter 2
Central Nervous System and Locomotion
We have seen in the previous section that limited knowledge of how the human body works may lead to poorly designed robots that are ineffective for recovery after SCI or stroke. To build a more useful machine, it is important to review the current findings on locomotion and the neural circuitry involved. A well-designed machine should be compatible with the biomechanics and the neural control of movement.
This chapter is a survey of current research on the role of the Central Nervous System (CNS) in locomotion, including both animal and human studies. Of particular interest is the role of the spinal cord in the animal models. Relevant topics include the role of sensory inputs, interlimb coordination, spinal cord development in rats, and existing models of the spinal circuitry. Implications for recovery from SCI and/or on the development of the apparatus in this project are also provided.
2.1
Motor Function-related Anatomy of the CNS
In this section the anatomical features of the CNS that are relevant to motor function are summarized. Specifically, an introduction to the neural circuitry of the spinal cord and its connection to the brain is provided.
2.1.1 The Spinal Cord
The human spinal cord is composed of cervical, thoracic, lumbar and sacral levels which consist of 8, 12, 5 and 5 segments respectively. One such segment is shown in Fig. 2-1. In each segment and on each side, there are dorsal roots which are bundles of sensory neurons that carry information into the spinal cord (afferent signals), and ventral roots, which are bundles of motoneurons that carry neural signals generated by the CNS to the muscles (efferent signals).
The dorsal roots neuron bodies are protected by nodules called dorsal root ganglions, or spinal ganglions. The two bundles of neurons make synaptic connections to intemeurons (INs) within the spinal gray matter.
The gray matter contains INs that provide connections between not only the ipsilateral dorsal and ventral roots, but also between interneurons on both sides (left and right) of the gray matter. Spinal white matter is the pathway of axons that originate from higher CNS as well as those originating from the spinal cord. In other words, the white matter contains pathways of neurons communicating between the spinal cord and the brain, whereas the gray matter contains interneurons that provide communication between the dorsal and ventral roots within the spinal cord. Neurons in the white matter that originate from the brain terminate in the gray matter to make synaptic connections to interneurons, or directly to motoneurons.
2.1.2 Corticospinal Tract
The motor cortex in the brain sends motor commands to the periphery through the corticospinal tract (Fig. 2-2). It is a bundle of neurons that originates from layer V of the motor cortex (where the cell bodies reside) and descends into the spinal cord through a white matter
matter of the spinal cord. 80% of the neurons in the corticospinal tract decussate (cross over) to the contralateral side in the medulla oblongata before entering the spinal cord. The remaining 20% do not decussate and follow the white matter tract on the ipsilateral side.
T Dorsal-2
6
1 Ventral
Fig. 2-1. Schematic of the spinal cord, cross-section, simplified. 1: Spinal Ganglion. 2: Dorsal root. 3: White matter. 4: Gray matter, dorsal horn. 5: Gray matter, ventral horn. 6: Ventral root. Fig. 2-2. Schematic of corticospinal tract. The neurons originate from the motor cortex (top). 80% of them decussate to the contralateral side in the medulla oblongata (middle). These neurons make synaptic connections to interneurons or directly to motoneurons within the gray matter (bottom).
2.1.3 Sensory Inputs to the Brain
There are several pathways within the spinal cord that transmit the sensory information from the periphery to the higher CNS. For example, Spinothalamic tract transmits information about itch, pain, or temperature to the thalamus, while Posterior column-medial lemniscus pathway is responsible for transmitting fine touch or vibration. Of particular interest to human movement is the spinocerebellar tract. This pathway transmits information obtained from sensory receptors
information such as position and velocity of body segments is carried to the brain through this the spinocerebellar tract within the white matter.
2.2
Sensory Information on Interlimb Coordination
This section reviews current findings in the literature regarding the influence of sensory input on motor output. A number of experiments have shown the role of the CNS, especially the spinal cord, in generating rhythmic movements such as gait as a result of appropriate sensory inputs. The neural circuitry responsible for this within the spinal cord is called a Central Pattern Generator (CPG). It is known that there are CPGs in mammals, particularly in rats and cats. Other types of animals such as turtles, lampreys or squids also are believed to have CPGs. Although the evidence of a CPG in humans is not as clear, the community is inclined to believe in its existence [45].
A lot of the studies mentioned in this chapter involve animal models such as cats or rats.
Popular preparations include decerebration (the elimination of cerebral brain function in an animal by removing the cerebrum or cutting across the brain stem) or partial/complete spinalization (cutting across the neuron bundles in the spinal cord). Fictive locomotion studies are also popular, where 'fictive steps' refer to patterns of motoneuron output that would generate muscle activation for step-like movements. Fictive locomotion studies involve using isolated or exposed spinal cords taken from animals. These preparations offer useful insights particularly on the role of the lower spinal cord in locomotion. However, intentional application of such preparations in humans would be morally indefensible.
2.2.1 Studies in Cats
A large body of research reports on interlimb coordination in the presence of sensory inputs
in cats. In spinalized cats, continuous flexion of one hindlimb blocks rhythmic motion of both hindlimbs [46]. De-afferentation of one hindlimb in spinalized cats disrupts not only ipsilateral stepping [47], but also contralateral stepping. It is also observed that there exists a fore-and-aft coordination of the limbs, both in intact and in spinal cats [48][49][50][51]. These experiments suggest that there is a spinal mechanism for interlimb coordination whose mechanism depends on sensory inputs.
Spinalized cats can, to some extent, adjust to a "split-belt" condition where different treadmill speeds are imposed on the two hindlimbs. Decerebrated cats can also adjust to the same condition [52]. This suggests that the adjustment to a rather non-trivial task can be made within the spinal cord without supraspinal control.
Spinalized cats can produce motor output patterns in the lower spinal cord similar to those seen in normal locomotion. This can be done by inducing a hip position-related afferent activity [53] [54][55], or by unloading the ankle extensor at the end of the stance phase [21]. However, the muscle activation patterns of fictive and normal locomotion were not identical, suggesting a role of stretch reflexes based on length and force related receptors such as muscle spindles or Golgi-tendon organs (GTO) [56][57][58] [59]. Still, it is argued in the same studies that the contribution of stretch reflexes to motion is restricted to particular muscles only, and their effect at a more general level is small.
Other studies in cats report fictive steps related to forelimb-hindlimb coordination. In high-level decerebrated cats, fictive step cycles of the two forelimbs were always strictly alternated. The phasing of the step cycles of either the two hindlimbs or pairs of homolateral or diagonal
![Fig. 1-1. Step training with weight support and manual assistance on a treadmill [5].](https://thumb-eu.123doks.com/thumbv2/123doknet/14722736.570833/29.918.290.597.99.525/fig-step-training-weight-support-manual-assistance-treadmill.webp)