HAL Id: hal-02479843
https://hal.archives-ouvertes.fr/hal-02479843
Submitted on 6 Apr 2020HAL is a multi-disciplinary open access archive for the deposit and dissemination of sci-entific research documents, whether they are pub-lished or not. The documents may come from teaching and research institutions in France or abroad, or from public or private research centers.
L’archive ouverte pluridisciplinaire HAL, est destinée au dépôt et à la diffusion de documents scientifiques de niveau recherche, publiés ou non, émanant des établissements d’enseignement et de recherche français ou étrangers, des laboratoires publics ou privés.
between early and late-onset amnestic Alzheimer’s
disease
Anne-Laure Aziz, Bernard Giusiano, Sven Joubert, Lauréline Duprat, Mira
Didic, Claude Gueriot, Lejla Koric, José Boucraut, Olivier Félician,
Jean-Philippe Ranjeva, et al.
To cite this version:
Anne-Laure Aziz, Bernard Giusiano, Sven Joubert, Lauréline Duprat, Mira Didic, et al.. Difference in imaging biomarkers of neurodegeneration between early and late-onset amnestic Alzheimer’s disease. Neurobiology of Aging, Elsevier, 2017, 54, pp.22-30. �10.1016/j.neurobiolaging.2017.02.010�. �hal-02479843�
M
AN
US
CR
IP
T
AC
CE
PT
ED
Difference in imaging biomarkers of neurodegeneration between early and
late-onset amnestic Alzheimer’s disease.
Anne-Laure AZIZ (MD) 1, Bernard GIUSIANO (MD) 1, 8, Sven JOUBERT (PhD) 9, 10,
Lauréline DUPRAT 4, Mira DIDIC (MD) 1,5, Claude GUERIOT (MD) 5, Lejla KORIC
(MD) 5, José BOUCRAUT (MD) 3,11, Olivier FELICIAN (MD, PhD)1,5, Jean-Philippe
RANJEVA (PhD) 4, Eric GUEDJ (MD, PhD) 2, 6, 7 and Mathieu CECCALDI (MD,
PhD)1, 5
1
Aix-Marseille Université, INSERM UMR 1106, Institut de Neurosciences des Systèmes,
13005 Marseille, France 2
Service de Médecine Nucléaire, Assistance Publique-Hôpitaux de Marseille, Timone
Hospital, 13385 Marseille, France 3
Laboratoire d’Immunologie et d’Immunopathologie, Assistance Publique-Hôpitaux de
Marseille, 13005 Marseille, France 4
Aix-Marseille Université, Centre de Résonance Magnétique Biologique et Médicale -
CRMBM, UMR 7339 AMU-CNRS, 13385 Marseille, France 5
Service de Neurologie et de Neuropsychologie & CMRR PACA Ouest, AP-HM, 13385
Marseille, France 6
Institut de Neurosciences de la Timone, UMR 7289, Aix-Marseille Université & CNRS,
Assistance Publique-Hôpitaux de Marseille, 13005 Marseille, France 7
CERIMED, Aix-Marseille Université, 13005 Marseille, France 8
M
AN
US
CR
IP
T
AC
CE
PT
ED
10Centre de recherche Institut universitaire de gériatrie de Montréal (CRIUGM), Montréal,
Quebec, Canada
11
Aix Marseille Université, CRN2M, CNRS UMR 7286, 13344 Marseille Cedex 15, France.
Correspondance to: Dr Anne-Laure Aziz, Aix-Marseille Université, INSERM, Institut de
Neurosciences des Systèmes, Faculté de Médecine, 27, Boulevard Jean Moulin, 13005
M
AN
US
CR
IP
T
AC
CE
PT
ED
ABSTRACT:
Neuroimaging biomarkers differ between patients with early-onset (EOAD) and late-onset
Alzheimer’s disease (LOAD). Whether these changes reflect cognitive heterogeneity or
differences in disease severity is still unknown. This study aimed at investigating changes in
neuroimaging biomarkers, according to the age of onset of the disease, in mild amnestic
Alzheimer’s disease (AD) patients with positive amyloid biomarkers in cerebrospinal fluid
(CSF). Both patient groups were impaired on tasks assessing verbal and visual recognition
memory. EOAD patients showed greater executive and linguistic deficits, while LOAD
patients showed greater semantic memory impairment. In EOAD and LOAD,
hypometabolism involved the bilateral temporoparietal junction and the posterior cingulate
cortex. In EOAD, atrophy was widespread, including frontotemporoparietal areas, whereas it
was limited to temporal regions in LOAD. Atrophic volumes were greater in EOAD than in
LOAD. Hypometabolic volumes were similar in the two groups. Greater extent of atrophy in
EOAD, despite similar extent of hypometabolism, could reflect different underlying
pathophysiological processes, different glucose-based compensatory mechanisms or distinct
M
AN
US
CR
IP
T
AC
CE
PT
ED
Key words: Alzheimer’s disease; age of onset; neuroimaging biomarkers; magnetic
resonance imaging; positron emission tomography imaging
Abbreviations:
AC-PC: anterior commissure-posterior commissure, 18FDG = fluorodeoxyglucose, MRI =
magnetic resonance imaging, PET = positron emission tomography imaging, AD =
Alzheimer’s disease, EOAD = early-onset Alzheimer’s disease, LOAD = late-onset
Alzheimer’s disease, KE = cluster size (number of contiguous significant voxels), BA =
M
AN
US
CR
IP
T
AC
CE
PT
ED
BACKGROUND:
Alzheimer’s disease (AD) is considered to be a memory disease of elderly patients, although
it constitutes a polymorphic entity both in terms of its clinical presentation and age of onset.
Early-onset Alzheimer’s disease patients (EOAD) present with initial symptoms before the
age of 65 (Delay J, 1962). Among the patients presenting with “typical” amnestic AD forms,
differences in cognitive profiles (Joubert et al., 2016, Koedam et al., 2010) and functional
brain connectivity (Gour et al., 2014) have been described based on age of onset of the
disease. In EOAD patients, non-amnestic domains including executive functions, praxis, and
visuoconstructional abilities, are more affected than in LOAD patients, suggesting a more
diffuse pattern of cognitive impairment (Joubert et al., 2016). Concerning pathological data,
Murray et al. reported that patients with hippocampal sparing and higher densities in
neurofibrillary tangles in neocortical regions were the youngest ones, suggesting distinct
age-related clinicopathological subtypes of AD (Murray et al., 2011).
Structural MRI and 18FDG PET-CT are usually used as additional biomarkers for AD (Fan et
al., 2008). These biomarkers provide information about morphological neural loss on the
MRI, and functional neural changes of synaptic activity on 18FDG PET. Indeed, in the
'conventional' LOAD presentation, hypometabolism is believed to appear before atrophy in
some of the brain regions involved early in the disease course, in particular in the posterior
cingulate cortex (Bittner et al., 2005). Whether this temporal discrepancy between atrophy
and hypometabolism observed in LOAD patients is similar in EOAD patients remains to be
M
AN
US
CR
IP
T
AC
CE
PT
ED
Regarding the neuroimaging differences between EOAD and LOAD patients, previous
studies suggested that EOAD patients have more widespread atrophy in neocortical structures
than LOAD patients (Frisoni et al., 2005). At mild stages of dementia, the pattern of
hypometabolism seems to involve the temporoparietal junction and posterior cingulate cortex
in both EOAD and LOAD patients, whereas frontal hypometabolism seems to be greater in
the former group (Salmon et al., 2000). However, inclusion of inhomogeneous clinical
dementia presentations in previous studies might account for some of the variability in
neuroimaging findings and limit conclusions about the reported differences, since shorter
disease evolution and the atypical clinical presentations observed in EOAD can impact the
neuroimaging patterns. To our knowledge, direct comparison between atrophic and
hypometabolic areas from homogeneous EOAD and LOAD patient groups in terms of clinical
phenotypes and dementia stages is not available.
Beyond topographic concerns, the question arises as to whether these macroscopic
abnormalities differ in extent according to age of onset. Since several factors related to age of
onset impact the expression of imaging biomarkers– such as disease severity, cognitive
reserve or the preexisting atrophy level, we hypothesize differences between EOAD and
LOAD patients concerning the atrophy volumes and hypometabolism.
The aim of the present study was to analyze the neuroimaging changes observed in AD, in
terms of topography and extent according to age of onset in a single and homogeneous group
of patients with amnestic mild AD.
M
AN
US
CR
IP
T
AC
CE
PT
ED
Subjects:The study uses data from the French hospital clinical research program ADAge (AP-HM,
Marseille, France; PHRC National – 2008/24). Inclusion of patients and controls ranged from
2008 to 2015 at the cognitive neurology unit of CHU Timone, Marseille. All patients
presented with typical amnestic AD according to criteria defined by McKhann 2011
(McKhann et al., 2011). All patients were at mild stages of dementia with a clinical dementia
rate (CDR) of 1. First symptoms of the disease, as reported by the patient and/or the family,
appeared less than 5 years before the inclusion. Amyloid biomarkers in the CSF were positive
for all patients (decrease in Aß1-42, below 500 pg/mL and an increase in Tau and
phosphoTau, respectively above 450 and 60 pg/mL). Patients were not included when the
clinical presentation was atypical (primary progressive aphasia, posterior cortical atrophy, or
a behavioral presentation), if they had neurological events in their past medical history, or if
they met diagnostic criteria of other neurodegenerative diseases such as Fronto-Temporal
Lobar Degeneration or Lewy Body Disease. Patients presenting one of the 4 following MRI
criteria were not included: sequelae of stroke, more than 2 lacunes defined as an area of
hyposignal bigger than 3 mm and circled by white or gray matter, presence of profound or
periventricular white matter hyperintensities above grade 2 of Fasekas (Schmidt et al., 2007),
or suspicion of recent ischemic stroke. Patients were matched for age and gender with
healthy controls; all of them were classified into two groups, according to their age (above or
below 65 years).
Biological analysis:
Apolipoprotein E genotype (Apo E) was obtained in all subjects using Hha 1 digestion and
M
AN
US
CR
IP
T
AC
CE
PT
ED
Patients had a lumbar puncture for AD CSF biomarkers (Aß1-42, Tau and phosphoTau
protein, IATI score defined as Aß42/(240+1.18Tau).
Neuropsychological assessment:
All participants underwent a comprehensive clinical assessment, including a global
assessment of quality of life (WHO-QOL 30 scale) and caregiver burden (Zarit scale) (Zarit et
al., 1980) as well as neuropsychiatric symptoms (NPI-scale) (Cummings, 1997) and
depressive signs (MADRS scale) (Montgomery et al., 1985), along with detailed
neuropsychological measures. General cognitive abilities were assessed using the
Mini-mental State Examination (MMSE) (Folstein et al., 1975) and the Batterie rapide
d’évaluation frontale (BREF/FAB) (Dubois et al., 2000). Episodic memory (anterograde
memory) was assessed both in the verbal and visual domains. Verbal memory was assessed
with the delayed RL/RI 16 (Van der Linden and Juillerat, 2004), a free/cued word recall test
widely used as a measure of verbal learning in French similar to the Free and Cued Selective
Reminding Test (FCSRT) (Grober et al., 1988). Visual memory was assessed using the
Delayed Matching to Sample test (DMS48), a visual recognition memory test widely used in
the assessment of Mild Cognitive Impairment (MCI) and dementia (Barbeau et al., 2004).
Semantic memory (retrograde memory) was assessed using the TOP 10 (Thomas-Antérion et
al., 2006). The TOP 10 is a standardized semantic test evaluating famous person knowledge.
Executive functions were assessed using the Trail Making Test part A (attention) and the Trail
Making Test part B (Reitan, 1955). Language abilities were evaluated with the DO80, a
French standardized picture naming task (Deloche et al., 1997) and the Category (animals)
fluency test (Cardebat et al., 1990). The Benton line orientation test (BLOT) was employed to
evaluate visuospatial abilities (Benton et al., 1978), while visuoconstructional abilities were
M
AN
US
CR
IP
T
AC
CE
PT
ED
Neuroimaging data:PET scans were performed using an integrated PET/CT camera (Discovery ST, GE
Healthcare, Waukesha, WI) with an axial resolution of 6.2 mm allowing 47 contiguous
transverse sections of the brain of 3.27 mm thickness. FDG (150 MBq) was injected
intravenously with the subject in an awake and resting state with eyes closed in a quiet
environment. Image acquisition was started 30 min after injection and ended 15 min later.
Images were reconstructed using the ordered subset expectation maximization algorithm with
five iterations and 32 subsets, and corrected for attenuation using a CT transmission scan.
Structural 3D MPRAGE T1 MRI acquisitions were performed in the CEMEREM unit, under
the same conditions for all patients and controls. The MRI parameters were the following:
128 axial slices, slice thickness less than 1.25 mm, 256x256 matrix, RT=1050 mS, ET=3.93
mS, IT= 310 mS, FA = 12°, PB = 123Hz/pixel.
Biological and neuropsychological data analysis and statistics:
Concerning the analysis of CSF biomarkers, the Innotest Amyloid Tau Index (IATI) was
calculated as: (measured Aß1-42/(240+1.18 [Tau]). The cerebrospinal ratios between amyloid
and Tau markers were obtained by dividing Aß1-42 respectively by Tau and phosphoTau
concentrations.
Neuropsychological data in the two age groups were compared in reference to their respective
adjusted healthy control group. Individual Z-scores were determined for neuropsychological
data and calculated as follows: [(individual patient score – mean score of the matched control
M
AN
US
CR
IP
T
AC
CE
PT
ED
Between-group comparisons were performed using respectively a Student t-test in the case of
normal data distributions and a Mann-Whitney test in the case of non-normal distributions.
The statistical analysis was performed using PrismGraphPad®. A Bonferroni correction was
applied, resulting in a p signification level of 0.001.
Imaging data analysis:
DICOM data were converted in NIFTI images using the publicly available “MRICron”
software (http://www.sph.sc.edu/comd/rorden/mricron/). Whole brain group comparisons of
EOAD versus LOAD patients and of patients versus age-matched controls were performed
using SPM12 (Wellcome Department of Cognitive Neurology, University College, London,
UK, fil.ion.ucl.ac.uk/spm) for both PET and MRI data. The PET and MRI images were
realigned, AC-PC reoriented and spatially normalized into the MNI space. All images were
smoothed at 8mm full-width at half-maximum (FWHM) with a Gaussian filter. The
proportional scaling normalization was used. A T-score threshold was applied for PET and
MRI analyses despite distinct numbers of voxels tested. The cluster size was set to be higher
than the expected volume based on random field theory and provided by the SPM model (for
MRI and PET). A 3.16 T-score corresponding to a p significant level of 0.001, corrected for
gender and educational level and a cluster size equal or above 125 or 65 voxels were
considered as significant for PET and MRI analysis, respectively, in the comparisons of
EOAD vs LOAD. A 3.16 T-score and a cluster size equal or above 300 voxels corrected for
age, gender and level of education was considered as significant for the comparisons of
patients versus controls. This last threshold defined regions of hypometabolism and
non-hypometabolism, and of atrophy and non-atrophy, in each group of patients in comparison to
respective healthy group. The anatomical localization of the most significant voxels was then
M
AN
US
CR
IP
T
AC
CE
PT
ED
comparison to healthy subjects, a brain cartography of atrophic and/or hypometabolic regions,
resulting from successive masks applied to the PET or MRI images, was then performed and
illustrated on a 3D brain render using MRICron software. In this line, regions of pure
hypometabolism (defined as areas of significant hypometabolism without significant atrophy),
were searched within the mask of non-atrophy. The same process was used to define the pure
atrophic regions (within the mask of non-hypometabolism). The respective volumes (in mm3)
of atrophic and hypometabolic regions, concerning the whole cortex, were determined by
using MarsBar toolbox in SPM (http://marsbar.sourceforge.net/).
RESULTS:
Population description: clinical data and general scales
Twenty-three EOAD patients and 29 LOAD patients were included and adjusted for age with
respectively 19 young controls (YCTRL) and 33 old controls (OCTRL).
Mean age was respectively 60.2 and 77.0 years for EOAD and LOAD patients. Respective
female/male ratio was 0.60 and 0.62 for EOAD and LOAD patients. Educational levels in
years of formal education were respectively, for EOAD, LOAD, YCTRL and OCTRL, of
11.3 (3), 10.3 (4.2), 13 (2) and 12.2 (3.7). EOAD and LOAD patients obtained very similar
results concerning the following scales: WHO-QOL30 (Quality of life assessment), NPI
(neuropsychiatric symptoms), MADRS (depressive symptoms), Zarit (caregiver burden)
M
AN
US
CR
IP
T
AC
CE
PT
ED
EOAD LOAD YCTRL OCTRL
Age (years) 60.2 (5.3) 77 (4.7) 56 (7) 74 (5.6) Sex (W/M) 14/9 18/11 14/5 21/11 Education (years) 11.3 (3) 10.3 (4.2) 13 (2) 12.2 (3.7) NPI 15,7 (14,6) 14,1 (14,6) NA NA MADRS 7 (6,3) 7,1 (6,1) NA NA Zarit 17,8 (17,5) 16,3 (14,5) NA NA WHO-QOL 30 15,8 (3,2) 15,8 (3,8) NA NA
Table 1: Epidemiological, neuropsychiatric and quality of life assessment in patients and controls. NA is mentioned when data was not available or not applicable.
Biological data:
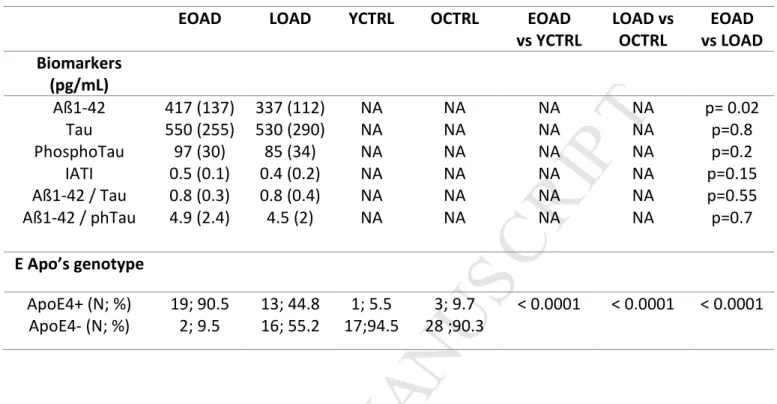
Concerning CSF biomarkers for AD, levels of Aß1-42 were slightly but not significantly
lower in LOAD compared to EOAD patients, respectively 337 (112) vs 417 (137) pg/mL,
p=0.02. The other biomarkers showed similar rates in both groups (table 2).
Concerning Apo E genotype, there were more Apo E4 carriers in EOAD (90.5%) than in
LOAD patients (44.8%), p<0.0001 and in controls (9.7%), p<0.0001 (table 2). There were 3
M
AN
US
CR
IP
T
AC
CE
PT
ED
EOAD LOAD YCTRL OCTRL EOAD
vs YCTRL LOAD vs OCTRL EOAD vs LOAD Biomarkers (pg/mL) Aß1-42 Tau PhosphoTau IATI Aß1-42 / Tau Aß1-42 / phTau 417 (137) 550 (255) 97 (30) 0.5 (0.1) 0.8 (0.3) 4.9 (2.4) 337 (112) 530 (290) 85 (34) 0.4 (0.2) 0.8 (0.4) 4.5 (2) NA NA NA NA NA NA NA NA NA NA NA NA NA NA NA NA NA NA NA NA NA NA NA NA p= 0.02 p=0.8 p=0.2 p=0.15 p=0.55 p=0.7 E Apo’s genotype ApoE4+ (N; %) ApoE4- (N; %) 19; 90.5 2; 9.5 13; 44.8 16; 55.2 1; 5.5 17;94.5 3; 9.7 28 ;90.3 < 0.0001 < 0.0001 < 0.0001
Table 2: Apolipoprotein E genotype and cerebrospinal fluid biomarkers in patients and controls. Statistical significance is set at p<0.001. NA is mentioned when data was not
M
AN
US
CR
IP
T
AC
CE
PT
ED
Neuropsychological tests:EOAD and LOAD patients were impaired on neuropsychological tests when compared to
their respective control groups, in particular for the MMSE, memory tasks (RL-RI 16,
DMS48, TOP10), visuoconstructional tests (Copy of the Rey-Osterrieth figure for EOAD
patients), executive function tests (TMT A and B) and language tests (DO80 for LOAD
patients, Category fluency), (p<0.001) (table 3). Thus, both patient groups showed very
similar overall cognitive profiles, such as typically reported in the mild dementia stage of AD.
EOAD LOAD YCTRL OCTRL EOAD
vs YCTRL (p) LOAD vs OCTRL (p) MMSE (/30) 20,30 (3.6) 21,90 (3.8) 29,32 (0.8) 29,15 (0.6) < 0,001 ‡ < 0,001 ‡
MEMORY Delayed RL/RI
(/16) 2,727 (4.1) 3,769 (4.5) 15,95 (0.2) 15,64 (0.8) < 0,001 ‡ < 0,001 ‡ DMS48 (%) 83,86 (14.5) 73,46 (15.8) 96,05 (4.4) 94,39 (7.6) < 0,001 ‡ < 0,001 ‡ TOP10 24,5 (13,1) 18,2 (12,2) 50,8 (6,8) 49,5 (7,5) < 0.001 < 0.001 VISUOCONSTRUCTIONAL ABILITIES BLOT (/30) 18,00 (18) 19,76 (4.8) 22,84 (22.8) 23,52 (3.8) < 0,01 < 0,01
Rey copy score (/36) 17,68 (15) 28,74 (11.4) 34,47 (1.3) 33,97 (3) < 0,001 ‡ 0,02 ‡ EXECUTIVE FUNCTIONS FAB (/18) 12,39
(3.1) 12,52 (3.7) 17,58 (0.8) 17,45 (0.8) < 0,001 ‡ < 0,001 ‡ TMTA 75,50 (43) 115,1 (151) 33,32 (10.2) 46,64 (15.4) < 0,001 ‡ < 0,001 ‡ TMTB 248,1 (98) 203,9 (77) 72,74 (17) 110,3 (38) < 0,001 < 0,001 ‡ LANGUAGE DO80 (/80) 73,70 (5.4) 68,14 (17.1) 73,70 (5.4) 79,55 (1.4) > 0,9999 < 0,001 ‡
M
AN
US
CR
IP
T
AC
CE
PT
ED
Table 3: Neuropsychological results (raw scores) in patients and controls.
Statistical significance degree is set at p< 0.001. “‡” highlights Mann-Whitney test.
However, EOAD patients showed significantly lower scores, as expressed by individual
Z-scores, than LOAD patients on the Copy of the Rey-Osterrieth figure, and on the TMT B
(p<0.001). EOAD patients showed lower results compared with LOAD patients on the DO80
and Category Fluency, although not significant following Bonferroni corrections (p<0.01).
Finally, LOAD patients showed significantly lower results than EOAD ones on TOP10
(p<0.001) (table 4).
EOAD LOAD EOAD vs LOAD
(p)
MMSE -9,966 (4.8) -11.7 (6.1) 0.43 ‡
MEMORY Delayed RL/RI -59.2 (17.8) -15.1 (5.7) < 0.001 ‡
DMS48 -3.2 (3.3) -2.7 (2.1) 0.7 ‡ TOP10 -1.5 (0.8) -2.7 (1.1) < 0.001 VISUOCONSTRUCTIONAL ABILITIES Benton Lines -1.4 (1.6) -0.9 (1.2) 0.33 Rey’s copy score -1.7 (1.8) -0.03 (0.7) < 0.001 ‡
EXECUTIVE FUNCTIONS BREF -1.34 (0.8) -1.2 (0.8) 0.4
TMTA - 3.4 (3.6) - 4.4 (9.8) 0.43 ‡ TMTB - 8.9 (5.1) - 2.4 (2.0) < 0.001 ‡ LANGUAGE DO80 -28.8 (31) -8.2 (12.3) < 0.01 ‡ Category Fluency -3.2 (1.3) -2.3 (1.2) < 0.01 ‡
Table 4: Comparison of neuropsychological Z-scores between EOAD and LOAD patients.
M
AN
US
CR
IP
T
AC
CE
PT
ED
Neuroimaging:Direct comparison between EOAD versus LOAD:
Intergroup metabolic comparison showed more hypometabolism in EOAD patients than in
LOAD in bilateral cuneus, in left precuneus (BA 19) and in the right middle temporal gyrus.
It showed more hypometabolism in LOAD patients than in EOAD in the right limbic lobe
(BA 28) and right inferior temporal gyrus (BA 20).
Intergroup atrophy comparison showed more atrophy in EOAD patients than in LOAD in
bilateral inferior (BA 40) and superior (BA 7) parietal lobule, in bilateral post central gyrus
(BA 2) and in the middle temporal gyrus (BA 39). It showed more atrophy in the right
orbitofrontal gyrus (BA 11), in the right limbic lobe (BA 20) and in the right superior
M
AN
US
CR
IP
T
AC
CE
PT
ED
Patients versus age-matched controls:
Intergroup metabolic comparison showed hypometabolism in the temporoparietal junction
bilaterally (T-score = 7.4, KE = 9386 voxels), and in the posterior cingulate cortex/precuneus
in both EOAD (T-score = 6.8, KE = 9386 voxels) and LOAD patients (T-score = 6.1, KE =
4660 voxels). In the latter patient group, hypometabolism also involved temporal areas
(anterior, superior and inferior temporal areas). Intergroup comparison showed significant
atrophy, limited to bilateral temporal regions (for superior temporal region, T-score = 5.9,
KE= 615 voxels, for inferior temporal region, T-score = 5.9, KE = 1161 voxels), in LOAD
patients. Atrophy was more widespread in EOAD patients, involving the prerolandic and
retrorolandic associative neocortex, in particular parietal (T-score = 5.6, KE = 624 voxels)
and smaller frontal regions (table 5 and Fig.2).
Cluster-level
Peak-level
Talairach BA Side, Gyrus
KE T X (mm) Y(mm) Z(mm) PET EOAD (vs YCTRL) 9386 7.4 -44 -60 38 40 L, Inferior Parietal 9386 6.8 -8 -55 38 7 L, Precuneus 1654 3.6 52 -48 12 22 R, Superior Temporal LOAD (vs OCTRL) 4660 6.1 -36 -68 42 19 L, Precuneus 4660 5.7 -58 -46 -16 37 L, Inferior Temporal 2226 5.5 -2 -36 36 31 L, Posterior Cingulate MRI EOAD (vs YCTRL) 3504 7.5 -66 -34 -6 21 L, Middle Temporal 1409 6.4 -12 -34 0 27 L, Parahippocampal 624 5.6 -36 -56 54 40 L, Inferior Parietal LOAD (vs OCTRL) 615 5.9 -32 8 -18 38 L, Superior Temporal 1161 5.9 -62 -40 -16 20 L, Inferior Temporal
M
AN
US
CR
IP
T
AC
CE
PT
ED
Table 5: Statistics and localization of the most significant results of intergroup PET and MRI comparison between patients and their respective healthy controls.
Results are given at the cluster-level and at the peak-level, False-Discovery Rate, minimal
T-score = 3.16, minimal KE> 300 voxels. KE corresponds to the cluster size, BA = Brodmann area, L = Left, R= Right.
Differences concerning topography of pure hypometabolic or pure atrophic areas were found
when comparing EOAD and LOAD patients (Fig.3). Pure hypometabolism was limited to the
temporoparietal junction bilaterally in EOAD. It was more widespread in LOAD patients,
involving the posterior and anterior temporal regions. The posterior cingulate cortex showed
pure hypometabolism in the two groups. Pure atrophy was found in temporal but also frontal
regions in EOAD patients, whereas it was limited to temporal structures in LOAD patients.
Regions showing both significant hypometabolism and atrophy included the bilateral
posterior temporal regions in EOAD patients, and middle temporal regions in LOAD patients.
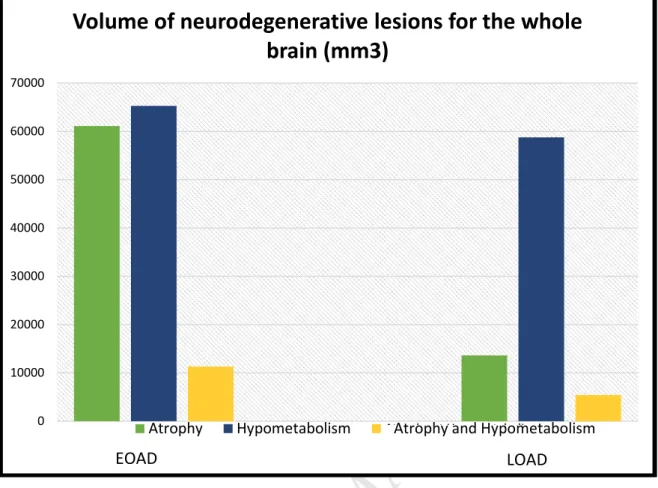
Respective volumes of pure hypometabolism and pure atrophy on the entire brain are shown
in Fig.4. EOAD patients had a greater volume of atrophy (61 000 mm3) than LOAD patients
(close to 14 000 mm3). However, hypometabolism volumes were very close in EOAD and
LOAD patients (65 000 mm3 for EOAD and 59 000 mm3 for LOAD patients). Both atrophic
and hypometabolic regions are larger in EOAD patients than in LOAD ones (respectively 11
M
AN
US
CR
IP
T
AC
CE
PT
ED
DISCUSSION:The main goal of this study was to compare age of onset-related differences in structural and
metabolic imaging patterns, in a homogeneous group of patients presenting with an amnestic
mild AD, selected on the basis of a positive CSF AD biomarker profile. We showed a shift
between EOAD and LOAD patients concerning the topography but also, for the first time,
concerning the extent of these biomarker abnormalities.
We included a homogeneous group of patients in order to avoid clinical phenotype variability
that could act as a confounding factor for imaging analysis. Although memory impairment
was found in the two groups, differences were observed on other neuropsychological tests,
suggesting, in accordance with previous studies, that some neuropsychological functions are
differently affected by the disease as a function of age of onset (Binetti et al., 1993). Direct
Z-score comparisons between EOAD and LOAD patients showed distinct severity: EOAD
patients were more impaired in executive, attentional, linguistic and visuoconstructional
functions, whereas LOAD patients were more impaired in semantic memory. This might
reflect, at least at this mild dementia stage, a greater dysfunction of associative neocortical
areas in EOAD patients. Conversely, LOAD patients were more severely impaired on
long-term memory, which is likely due to greater underlying damage of temporal lobe structures
(Joubert et al., 2016).
In our study EOAD patients carried in a greater proportion the Apolipoprotein E4 allele than
LOAD patients. There were 3 patients with an e4 homozygotes profile in the EOAD group
(15%), versus none in the LOAD group. This over-representation of E4 alleles in the EOAD
group may be due to the specific selection criteria with the exclusion of atypical forms of AD
M
AN
US
CR
IP
T
AC
CE
PT
ED
the frequency of E4 carriers according to the age of onset, and the effect of the
Apolipoprotein E genotype on imaging data and clinical profiles. AD has been reported to be
dependent on the age among the ApoE4-carriers (Farrer et al., 1997), with a maximum impact
between 60 and 70 years (Davidson et al., 2007). In EOAD, Smits et al. showed a faster
decline in non-memory cognitive functions in non-carrier patients (Smits et al., 2015). A
positive correlation between E4-carriers and mesiotemporal atrophy, together with memory
dysfunction, has been suggested in LOAD patients. However, other authors hypothesized that
the clinical profile of EOAD patients is particularly determined by genetic factors, including
Apolipoprotein E genotype, whereas the profile of LOAD patients profile appears to be more
influenced by environmental factors (Frisoni et al., 2005). E4 allele is known to be associated
with earlier disease onset (Slooter et al., 1998, Thambisetty et al., 2013). The role of other
potential genetic factors on the age of onset is still unknown. Other studies would be relevant
in this field, to better understand the links between E4 carriers, age at onset and clinical and
neuroimaging expression.
Structural MRI and 18FDG PET are classically used in addition to CSF biomarkers (Bittner et
al., 2005) and their patterns are well defined, especially in LOAD (Good et al., 2001, Herholz
et al., 2002, Matsuda et al., 2002) . However, these neuroimaging patterns are characterized
by heterogeneity (Chételat et al., 2008) and are impacted by several factors, including age of
onset (Frisoni et al., 2007).
For a mild level of dementia, and an amnestic presentation, we observed widespread atrophy
M
AN
US
CR
IP
T
AC
CE
PT
ED
temporal regions in LOAD patients. This was observed based on the results of a comparison
between EOAD and LOAD and a comparison between patients and controls. Very little
changes in metabolic abnormalities were observed between EOAD and LOAD.
Hypometabolism involved temporal areas bilaterally in EOAD and LOAD, yet extended to
the anterior temporal region in LOAD patients. Precuneus and cuneus areas were more
hypometabolic in EOAD patients. As opposed to previous authors, we did not identify
significant frontal hypometabolism in EOAD patients (Kalpouzos et al., 2005). This might be
related to the inclusion of patients in a more advanced disease stage in previous studies. These
neuroimaging findings might reflect underlying pathological differences between EOAD and
LOAD patients. We hypothesize that neuroimaging biomarker expression depends on the
spread of neurofibrillary tangles (NFT), which differ between EOAD and LOAD patients.
Murray et al. suggested that Braak & Braak stages couldn’t be fully applied to EOAD patients
(Braak and Braak, 1991) whose NFT involve neocortical areas at an earlier stage (Murray et
al., 2011). These pathological results could be further assessed using in-vivo Tau markers in
PET-CT, in particular at the earliest stages of the disease. Little is known about the
determinants of brain regions vulnerability to amyloid and tau induced phenomena. Freer et
al. suggested that tissue vulnerability may be mediated by failures of the protein homeostasis
system and variability in tissue connectivity (Freer et al., 2016). Age of onset might influence
the topography of abnormal protein aggregation, with the highest tissue vulnerability in
neocortical regions in EOAD and in limbic cortex in LOAD patients, in line with our results.
Concerning brain networks, specific changes have been found by Gour et. al, with a double
dissociation in EOAD and LOAD between two networks implicated in cognitive functions
(Gour et al., 2014). The consequences of neurodegeneration biomarker changes on remote
areas, as a function of age, are still unknown. This can be addressed by functional MRI or
M
AN
US
CR
IP
T
AC
CE
PT
ED
Our novel approach was to assess the whole brain volume of neurodegeneration biomarkers,
namely atrophy (neuronal loss), and hypometabolism (synaptic activity). We hypothesized
that the extent of these changes would vary according to age of onset. In fact, when observed
at a specific time point, atrophy and hypometabolism reflect upstream processes of synaptic
dysfunction and neuronal loss, which may both depend on the severity of the disease,
cognitive reserve, and possibly other neurodegenerative processes that may have started
before the disease onset.
Our results suggest that EOAD patients display almost 5 times more atrophic voxels than
those of LOAD patients, but that metabolic level does not differ across patient groups. Thus,
glucose metabolism appears to be more spared in EOAD than in LOAD patients,
commensurate with their respective volumes of atrophy. We hypothesize that the volume of
changes of these two biomarkers may be somehow affected by whole brain compensatory
processes. Compensatory mechanisms are believed to take place in AD pathophysiology, and
may be expressed by an increase of glucose metabolism level in response to atrophy (Villain
et al., 2010). A greater increase of glucose metabolism, relative to the extent of atrophy, may
exist in EOAD patients. It is worth mentioning, however, that educational level was similar in
both patient groups. Since education is commonly considered to be a proxy of cognitive
reserve, which can be viewed as a reduced susceptibility to impairment due to greater use of
compensatory processes, our data suggest that educational level is unlikely to account for the
differences observed in the current study. On the other hand, we observed higher atrophy
levels in EOAD patients. Atrophy level and CSF markers of neurodegeneration (in particular
Tau and phosphoTau) are looked upon as surrogate markers for neuronal loss and severity of
M
AN
US
CR
IP
T
AC
CE
PT
ED
patients, which suggest severe degeneration in both groups. Hence the question of possible
neurodegeneration prior to AD pathology deposits in EOAD patients is open. Previous studies
in patients with MCI showed that neurodegeneration can exist independently of
amyloïdopathy, for example in the case of “Suspected non-Alzheimer disease
Pathophysiology” patients (Jack et al., 2016). One way to further explore the hypothesis of a
prior neurodegenerative state would be to extend this study to the prodromal stages of
AD.Indeed, different degrees of neurodegeneration might be expected between early and
late-onset MCI due to AD. Comparisons between different age groups in prodromal AD patients,
or even in subjective cognitive impairment (SCI) patients, should be relevant and should
contribute to better understand the different patterns of atrophy and metabolism at the
M
AN
US
CR
IP
T
AC
CE
PT
ED
Ethical approval: This research has been approved by the local ethics CPP committee
(“Comité de Protection des Personnes”).
Acknowledgments:
None of the authors have any actual or potential conflicts of interest related to this work. The
authors are thankful to the patients, their families and healthy controls for their generous
participation in this study. They are grateful to Dr. Radka Gantcheva for clinical assessment
of healthy subjects, Natalina Gour for neuropsychological assessment of patients, Dr
Raphaelle Bernard for performing Apo E genotyping, Julie Pelat and Lucie Toulemonde
(AP-HM, Direction Recherche Clinique) for their help with study management including data
managing and Mohamed Fattalah (AP-HM, Centre d’Investigation Clinique) for his help with
data managing.
Funding:
This work was supported by the French Hospital Clinical Research Program (PHRC ADAGE
2008-A01213-52), the A*MIDEX project (n° ANR-11-IDEX-0001-02) funded by the «
Investissements d’Avenir » French Government program, managed by the French National
Research Agency (ANR) and the association “déchaines ton coeur”. Anne-Laure Aziz is
supported by a Young Researcher allowance award from Toulouse Hospital, France.
Lauréline Duprat is supported by a “Année-Recherche” award from the Aix-Marseille
University. Sven Joubert was supported by a Chercheur-boursier Senior award from the
M
AN
US
CR
IP
T
AC
CE
PT
ED
References:
Barbeau, E., Didic, M., Tramoni, E., Felician, O., Joubert, S., Sontheimer, A., Ceccaldi, M., Poncet,
M., 2004. Evaluation of visual recognition memory in MCI patients. Neurology 62, 1317–
1322.
Benton, A.L., Varney, N.R., Hamsher, K.D., 1978. Visuospatial judgment. A clinical test. Arch.
Neurol. 35, 364–367.
Binetti, G., Magni, E., Padovani, A., Cappa, S.F., Bianchetti, A., Trabucchi, M., 1993.
Neuropsychological heterogeneity in mild Alzheimer’s disease. Dementia 4, 321–326.
Bittner, D., Grön, G., Schirrmeister, H., Reske, S.N., Riepe, M.W., 2005. [18F]FDG-PET in patients
with Alzheimer’s disease: marker of disease spread. Dement Geriatr Cogn Disord 19, 24–30.
doi:10.1159/000080967
Braak, H., Braak, E., 1991. Neuropathological stageing of Alzheimer-related changes. Acta
Neuropathol. 82, 239–259.
Cardebat, D., Doyon, B., Puel, M., Goulet, P., Joanette, Y., 1990. [Formal and semantic lexical
evocation in normal subjects. Performance and dynamics of production as a function of sex,
age and educational level]. Acta Neurol Belg 90, 207–217.
Chételat, G., Desgranges, B., Landeau, B., Mézenge, F., Poline, J.B., de la Sayette, V., Viader, F.,
Eustache, F., Baron, J.-C., 2008. Direct voxel-based comparison between gray matter
hypometabolism and atrophy in Alzheimer’s disease. Brain 131, 60–71.
doi:10.1093/brain/awm288
Cummings, J.L., 1997. The Neuropsychiatric Inventory: assessing psychopathology in dementia
M
AN
US
CR
IP
T
AC
CE
PT
ED
J., Payton, A., Pickering-Brown, S.M., Pendleton, N., Horan, M.A., Burns, A., Purandare, N.,
Lendon, C.L., Neary, D., Snowden, J.S., Mann, D.M.A., 2007. Apolipoprotein E epsilon4
allele frequency and age at onset of Alzheimer’s disease. Dement Geriatr Cogn Disord 23,
60–66. doi:10.1159/000097038
Delay J, Brion S. Les démences tardives. Masson et Cie, Paris, 1962, n.d.
Deloche, G., Hannequin, D., Dordain, M., Metz-Lutz, M.N., Kremin, H., Tessier, C., Vendrell, J.,
Cardebat, D., Perrier, D., Quint, S., Pichard, B., 1997. Diversity of patterns of improvement in
confrontation naming rehabilitation: some tentative hypotheses. J Commun Disord 30, 11–21;
quiz 21–22.
Dubois, B., Slachevsky, A., Litvan, I., Pillon, B., 2000. The FAB: a Frontal Assessment Battery at
bedside. Neurology 55, 1621–1626.
Fan, Y., Batmanghelich, N., Clark, C.M., Davatzikos, C., Alzheimer’s Disease Neuroimaging
Initiative, 2008. Spatial patterns of brain atrophy in MCI patients, identified via
high-dimensional pattern classification, predict subsequent cognitive decline. Neuroimage 39,
1731–1743. doi:10.1016/j.neuroimage.2007.10.031
Farrer, L.A., Cupples, L.A., Haines, J.L., Hyman, B., Kukull, W.A., Mayeux, R., Myers, R.H.,
Pericak-Vance, M.A., Risch, N., van Duijn, C.M., 1997. Effects of age, sex, and ethnicity on
the association between apolipoprotein E genotype and Alzheimer disease. A meta-analysis.
APOE and Alzheimer Disease Meta Analysis Consortium. JAMA 278, 1349–1356.
Folstein, M.F., Folstein, S.E., McHugh, P.R., 1975. “Mini-mental state”. A practical method for
grading the cognitive state of patients for the clinician. J Psychiatr Res 12, 189–198.
Freer, R., Sormanni, P., Vecchi, G., Ciryam, P., Dobson, C.M., Vendruscolo, M., 2016. A protein
homeostasis signature in healthy brains recapitulates tissue vulnerability to Alzheimer’s
disease. Sci Adv 2, e1600947. doi:10.1126/sciadv.1600947
M
AN
US
CR
IP
T
AC
CE
PT
ED
Hayashi, K.M., Toga, A.W., Thompson, P.M., 2007. The topography of gray matter
involvement in early and late-onset Alzheimer’s disease. Brain 130, 720–730.
doi:10.1093/brain/awl377
Frisoni, G.B., Testa, C., Sabattoli, F., Beltramello, A., Soininen, H., Laakso, M.P., 2005. Structural
correlates of early and late-onset Alzheimer’s disease: voxel based morphometric study. J.
Neurol. Neurosurg. Psychiatr. 76, 112–114. doi:10.1136/jnnp.2003.029876
Good, C.D., Johnsrude, I.S., Ashburner, J., Henson, R.N., Friston, K.J., Frackowiak, R.S., 2001. A
voxel-based morphometric study of ageing in 465 normal adult human brains. Neuroimage
14, 21–36. doi:10.1006/nimg.2001.0786
Gour, N., Felician, O., Didic, M., Koric, L., Gueriot, C., Chanoine, V., Confort-Gouny, S., Guye, M.,
Ceccaldi, M., Ranjeva, J.P., 2014. Functional connectivity changes differ in early and
late-onset Alzheimer’s disease. Hum Brain Mapp 35, 2978–2994. doi:10.1002/hbm.22379
Grober, E., Buschke, H., Crystal, H., Bang, S., Dresner, R., 1988. Screening for dementia by memory
testing. Neurology 38, 900–903.
Jack, C.R., Knopman, D.S., Chételat, G., Dickson, D., Fagan, A.M., Frisoni, G.B., Jagust, W.,
Mormino, E.C., Petersen, R.C., Sperling, R.A., van der Flier, W.M., Villemagne, V.L.,
Visser, P.J., Vos, S.J.B., 2016. Suspected non-Alzheimer disease pathophysiology--concept
and controversy. Nat Rev Neurol 12, 117–124. doi:10.1038/nrneurol.2015.251
Joubert, S., Gour, N., Guedj, E., Didic, M., Guériot, C., Koric, L., Ranjeva, J.-P., Felician, O., Guye,
M., Ceccaldi, M., 2016. Early-onset and late-onset Alzheimer’s disease are associated with
distinct patterns of memory impairment. Cortex 74, 217–232.
doi:10.1016/j.cortex.2015.10.014
Kalpouzos, G., Eustache, F., de la Sayette, V., Viader, F., Chételat, G., Desgranges, B., 2005.
Working memory and FDG-PET dissociate early and late-onset Alzheimer disease patients. J.
M
AN
US
CR
IP
T
AC
CE
PT
ED
Koedam, E.L.G.E., Lauffer, V., van der Vlies, A.E., van der Flier, W.M., Scheltens, P., Pijnenburg,
Y.A.L., 2010. Early-versus late-onset Alzheimer’s disease: more than age alone. J.
Alzheimers Dis. 19, 1401–1408. doi:10.3233/JAD-2010-1337
McKhann, G.M., Knopman, D.S., Chertkow, H., Hyman, B.T., Jack, C.R., Kawas, C.H., Klunk,
W.E., Koroshetz, W.J., Manly, J.J., Mayeux, R., Mohs, R.C., Morris, J.C., Rossor, M.N.,
Scheltens, P., Carrillo, M.C., Thies, B., Weintraub, S., Phelps, C.H., 2011. The diagnosis of
dementia due to Alzheimer’s disease: recommendations from the National Institute on
Aging-Alzheimer’s Association workgroups on diagnostic guidelines for Aging-Alzheimer’s disease.
Alzheimers Dement 7, 263–269. doi:10.1016/j.jalz.2011.03.005
Montgomery, S.A., Smeyatsky, N., de Ruiter, M., Montgomery, D.B., 1985. Profiles of
antidepressant activity with the Montgomery-Asberg Depression Rating Scale. Acta Psychiatr
Scand Suppl 320, 38–42.
Murray, M.E., Graff-Radford, N.R., Ross, O.A., Petersen, R.C., Duara, R., Dickson, D.W., 2011.
Neuropathologically defined subtypes of Alzheimer’s disease with distinct clinical
characteristics: a retrospective study. Lancet Neurol 10, 785–796.
doi:10.1016/S1474-4422(11)70156-9
Reitan, R.M., 1955. The relation of the trail making test to organic brain damage. J Consult Psychol
19, 393–394.
Rey, A., de MORSIER, null, 1960. [Test for the examination of constructional apraxia]. Rev.
Neurol. (Paris) 102, 653–656.
Salmon, E., Collette, F., Degueldre, C., Lemaire, C., Franck, G., 2000. Voxel-based analysis of
confounding effects of age and dementia severity on cerebral metabolism in Alzheimer’s
disease. Hum Brain Mapp 10, 39–48.
Schmidt, R., Petrovic, K., Ropele, S., Enzinger, C., Fazekas, F., 2007. Progression of leukoaraiosis
M
AN
US
CR
IP
T
AC
CE
PT
ED
Slooter, A.J., Cruts, M., Kalmijn, S., Hofman, A., Breteler, M.M., Van Broeckhoven, C., van Duijn,
C.M., 1998. Risk estimates of dementia by apolipoprotein E genotypes from a
population-based incidence study: the Rotterdam Study. Arch. Neurol. 55, 964–968.
Smits, L.L., Pijnenburg, Y.A.L., van der Vlies, A.E., Koedam, E.L.G.E., Bouwman, F.H., Reuling,
I.E.W., Scheltens, P., van der Flier, W.M., 2015. Early-onset APOE E4-negative Alzheimer’s
disease patients show faster cognitive decline on non-memory domains. Eur
Neuropsychopharmacol 25, 1010–1017. doi:10.1016/j.euroneuro.2015.03.014
Thambisetty, M., An, Y., Tanaka, T., 2013. Alzheimer’s disease risk genes and the age-at-onset
phenotype. Neurobiol. Aging 34, 2696.e1–5. doi:10.1016/j.neurobiolaging.2013.05.028
Thomas-Antérion, C., Collomb, K., Borg, C., Nevers, B., Laurent, B., 2006. [Evaluation of memory
for French public events: EVE-30 in 108 controls, 10 mild cognitively impaired and 10
Alzheimer’s disease patients]. Rev. Neurol. (Paris) 162, 1232–1239.
Van der Linden, M., Juillerat, A.-C., 2004. [Neuropsychological rehabilitation in early stage
Alzheimer’s disease: principles, methods and perspectives]. Rev. Neurol. (Paris) 160, S64–70.
Villain, N., Chételat, G., Desgranges, B., Eustache, F., 2010. Neuroimaging in Alzheimer’s disease: a
synthesis and a contribution to the understanding of physiopathological mechanisms. Biol
Aujourdhui 204, 145–158. doi:10.1051/jbio/2010010
Zarit, S.H., Reever, K.E., Bach-Peterson, J., 1980. Relatives of the impaired elderly: correlates of
feelings of burden. Gerontologist 20, 649–655.
TABLES AND FIGURES:
Tables:
Table 1: Epidemiological, neuropsychiatric and quality of life assessment in patients and controls.
M
AN
US
CR
IP
T
AC
CE
PT
ED
Table 3: Results on neuropsychological assessment in patients and controls.
Table 4: Comparison of neuropsychological Z-scores between EOAD and LOAD patients. Table 5: Statistics and localization of the most significant results of intergroup PET and MRI comparisons between patients and their respective healthy controls.
Figures:
Fig. 1: Results of an intergroup comparison between EOAD and LOAD patients for metabolic and atrophic data: 3D renders.
Fig. 2: Results of an intergroup comparison between patients and matched controls for metabolic and atrophic data: 3D renders and axial slices.
Fig. 3: 3D renders and axial slices for EOAD (A) and LOAD patients (B), showing pure atrophic regions (blue), pure hypometabolic regions (red) or both atrophic and hypometabolic regions (pink) for the whole brain.
Fig. 4: Volume of neurodegenerative lesions (atrophy and hypometabolism) in the whole cortex, in mm3, for EOAD and LOAD patients.
M
AN
US
CR
IP
T
AC
CE
PT
ED
Fig. 1: Results of intergroup comparison between EOAD and LOAD patients for metabolic and atrophic data: 3D renders.
T-score = 3.16, cluster size k> 125 voxels for PET and > 65 voxels for MRI.
In EOAD, hypometabolism is more pronounced in bilateral cuneus, in left precuneus (BA 19) and in right middle temporal gyrus. In LOAD, hypometabolism is more pronounced in right parahippocampus (BA 28) and right inferior temporal gyrus (BA 20).
In EOAD, atrophy is more pronounced in bilateral inferior (BA 40) and superior (BA 7) parietal lobule, in bilateral post central gyrus (BA 2) and in middle temporal gyrus (BA 39). In LOAD, atrophy is more pronounced in right orbito-frontal gyrus (BA 11), in right inferior (BA 20) and superior temporal gyrus (BA 38).
M
AN
US
CR
IP
T
AC
CE
PT
ED
Fig. 2: Results of intergroup comparison between patients and their matched controls for metabolic and atrophic data: 3D renders and axial slices.
False-Discovery Rate, T-score = 3.16, k> 300 voxels. In EOAD, hypometabolism involves the temporo-parietal bilateral junction and the cingulate posterior cortex. In LOAD, it concerns the same regions as well as bilateral temporal areas (anterior and middle temporal areas). In EOAD, atrophy is diffuse, involving the prerolandic and retrorolandic associative neocortex. In LOAD patients, bilateral temporal atrophy is observed, without significant atrophy in neocortical areas.
M
AN
US
CR
IP
T
AC
CE
PT
ED
Fig.3: 3D renders and axial slices for EOAD (A) and LOAD patients (B), showing pure atrophic regions (blue), pure hypometabolic regions (red) or both atrophic and hypometabolic regions (pink) for the whole brain. Significance level is defined for a minimal T-score of 3.16 with a cluster minimal size of 300 contiguous voxels. L=left.
In EOAD and LOAD patients, pure hypometabolic regions (in red) are the bilateral temporo-parietal junctions and the posterior cingulate/precuneus cortex. The posterior and anterior temporal regions are hypometabolic only in LOAD patients. In EOAD patients, pure atrophic regions (in blue) are the temporal and frontal regions, whereas it is limited to temporal structures in LOAD patients. Regions showing both significant hypometabolism and atrophy (in pink) are the bilateral posterior temporal regions in EOAD patients, and middle temporal regions in LOAD patients.
M
AN
US
CR
IP
T
AC
CE
PT
ED
Fig. 4: Volume of neurodegenerative change (atrophy and hypometabolism) in the whole cortex, in mm3, for EOAD and LOAD patients.
There is a dissociation between the total hypometabolic volume (near to 59 000 mm3) and the atrophic volume (near to 14 000 mm3) in LOAD patients. In EOAD patients, the volumes of atrophy or hypometabolism are quite similar, respectively of 61 000 and 65 000 mm3. Both atrophic and hypometabolic regions involve about 11 000 mm3 in EOAD patients and 5400 mm3 in LOAD patients. 0 10000 20000 30000 40000 50000 60000 70000
Volume of neurodegenerative lesions for the whole
brain (mm3)
Atrophy Hypometabolism Atrophy et Hypometabolism
EOAD LOAD
M
AN
US
CR
IP
T
AC
CE
PT
ED
Highlights:o Hypometabolism is similar in topography and volume in EOAD and LOAD patients.
o Atrophy is limited to temporal areas in LOAD patients and widespread in EOAD ones.