HAL Id: inserm-02438637
https://www.hal.inserm.fr/inserm-02438637
Submitted on 14 Jan 2020HAL is a multi-disciplinary open access
archive for the deposit and dissemination of sci-entific research documents, whether they are pub-lished or not. The documents may come from teaching and research institutions in France or abroad, or from public or private research centers.
L’archive ouverte pluridisciplinaire HAL, est destinée au dépôt et à la diffusion de documents scientifiques de niveau recherche, publiés ou non, émanant des établissements d’enseignement et de recherche français ou étrangers, des laboratoires publics ou privés.
Mesenchymal Stem Cell Features of Ewing Tumors
Franck Tirode, Karine Laud-Duval, Alexandre Prieur, Bruno Delorme, Pierre
Charbord, Olivier Delattre
To cite this version:
Franck Tirode, Karine Laud-Duval, Alexandre Prieur, Bruno Delorme, Pierre Charbord, et al.. Mes-enchymal Stem Cell Features of Ewing Tumors. Cancer Cell, Elsevier, 2007, 11 (5), pp.421-429. �10.1016/j.ccr.2007.02.027�. �inserm-02438637�
Mesenchymal stem cell features of Ewing tumors
Franck Tirode 1,2, Karine Laud-Duval 1,2, Alexandre Prieur 1,2, Bruno Delorme 3, Pierre Charbord 3 and Olivier Delattre 1,2,*
1 Institut Curie, 26 rue d’Ulm, 75248 Paris cedex 05, France
2 INSERM, U830, Unité de Génétique et Biologie des Cancers, Paris, France
3 INSERM, ESPRI/EA3855, Microenvironnement de l'Hématopoièse et Cellules Souches, Faculté de Médecine de Tours, 10 Bd Tonnellé, 37032 Tours cedex 1, France
* Corresponding author
Olivier Delattre, INSERMU830, Section de Recherche, Institut Curie, 26 rue d’Ulm, 75248 Paris Cedex 05
Tel: 33 1 42 34 66 81 Fax: 33 1 42 34 66 30
Email: [email protected]
Summary
The cellular origin of Ewing tumor (ET), a tumor of bone or soft tissues characterized
by specific fusions between EWS and ETS genes, is highly debated. Through gene
expression analysis comparing ETs with a variety of normal tissues, we show that the
profiles of different EWS-FLI1-silenced Ewing cell lines converge toward that of
mesenchymal stem cells (MSC). Moreover, upon EWS-FLI1 silencing, two different
Ewing cell lines can differentiate along the adipogenic lineage when incubated in
appropriate differentiation cocktails. In addition, Ewing cells can also differentiate
along the osteogenic lineage upon long-term inhibition of EWS-FLI1. These in silico
and experimental data strongly suggest that the inhibition of EWS-FLI1 may allow
Significance
The precise knowledge of the normal counterpart of cancer cells is dramatically
lacking for Ewing sarcoma, one of the most frequent primary bone tumors. Since its
initial description more than 80 years ago, endothelial, epithelial, neural and
mesenchymal origins have been hypothesized. We have developed original cell
models to regulate EWS-FLI1 expression. In silico analyses and in vitro differentiation
experiments provide strong evidences that Ewing tumors originate from a
mesenchymal precursor that may have both connective and vascular differentiation
potentials. This origin helps to clarify the issue of the predominant localization of ET
Introduction
Ewing tumor (ET), the second most frequent bone tumor in adolescent and
young adult, harbors characteristic translocations which fuse the 5’ portion of the
EWS gene with the 3’ region, encoding DNA binding domain, of one of five ETS family genes (Arvand and Denny, 2001; Janknecht, 2005). The specificity of these
translocations for ET has now been extensively documented. The most frequent
fusion occurs with the FLI1 gene as a consequence of the t(11;22)(q24;q12)
translocation (Delattre et al., 1992). The resulting EWS-FLI1 chimeric protein
behaves as an aberrant transcription regulator that is thought to induce
transformation through induction or repression of specific target genes. Accordingly,
a number of genes controlling cell growth, signal transduction or differentiation have
been shown to be regulated by EWS-FLI1 (reviewed in Janknecht, 2005).
Histologically, ET appears as uniformly undifferentiated small round cells
containing a vesicular nuclei and a small cytoplasm within a sparse intercellular
stroma. These characteristics are poorly indicative of the cell lineage that gives rise
to ET. Since the initial proposal of an endothelial origin by James Ewing in 1921
(Ewing, 1921), the issue of the ET progenitor is highly debated. A neural crest origin
is hypothesized by the observation that EWS-ETS fusions characterize a spectrum of
tumors with undifferentiated ETs at one end and differentiated peripheral primitive
neuroectodermal tumors, expressing various neural markers, at the other end. This
hypothesis is further strengthened by the observation that ET derived cell lines grown
in vitro can undergo neural differentiation upon treatment with various differentiation-inducing agents (Cavazzana et al., 1987; Noguera et al., 1994). A recent study
suggests that EWS-FLI1 expression itself may be responsible, at least in part, for the
specific genes (Hu-Lieskovan et al., 2005). This study indicates that the ultimate
phenotype of ET might be determined not only by the cell lineage from which it
derives but also by intrinsic effects of EWS-FLI1. EWS-FLI1 has also been shown to
inhibit neural differentiation of neuroblastoma cells therefore leading to the proposal
that EWS-FLI1 may shift the sympathetic differentiation program of neuroblastoma to
the parasympathetic one of ET (Rorie et al., 2004).
Other experiments indicate that EWS-FLI1 inhibits mesenchymal
differentiation. In particular, enforced expression of EWS-FLI1 inhibits adipogenic and
osteogenic differentiation in murine marrow stromal cells (Torchia et al., 2003). It also
impairs myogenic differentiation in C2C12 myoblasts (Eliazer et al., 2003). The
hypothesis of a mesenchymal origin of ET is further supported by two recent reports
indicating that EWS-FLI1 can transform primary bone marrow stromal cells and
induce the formation of tumors resembling Ewing sarcomas in SCID mice
(Castillero-Trejo et al., 2005; Riggi et al., 2005). This indicates that, unlike other cell types which
cannot be transformed by EWS-FLI1 alone and necessitate additional events,
mesenchymal stem cells display permissiveness for EWS-FLI1-mediated cell
transformation and may therefore constitute an appropriate background for ET
development.
Finally, together with the observation of occasional cytokeratin staining, the
study of tight junction structural proteins has suggested that ETs exhibit partial
epithelial differentiation (Schuetz et al., 2005).
Presently, all attempts to identify the ET cell of origin have relied on the
overexpression of EWS-FLI1 in various heterologous backgrounds. In this study, we
small hairpin RNA (shRNA), may recover characteristics of their primary origin and
Experimental Procedures
Inhibition of EWS-FLI1
A673 and SK-N-MC were obtained from ATCC. EW24 derived from a bone tumour
was kindly provided by Pr Gilbert Lenoir (Zucman et al., 1993). All three cell lines
exhibit a type 1 fusion transcript. For siRNA mediated silencing, A673 Ewing cells
expressing a type 1 fusion transcript were transfected mainly as previously described
(Prieur et al., 2004), except that transfection medium was removed 6 hours after
transfection instead of 24 hours and replaced by fresh medium changed every two
days. For doxycycline inducible silencing, the oligonucleotides of the EWS-FLI1 short
hairpin RNAs (shEF-1)
5’GATCCCGGCAGCAGAACCCTTCTTAttcaagagaTAAGAAGGGTTCTGCTGCCTTT
TTGGAAA3’ (sense) and
5’GGCCGTCGTCGTCTTGGGAAGAATaagttctctATTCTTCCCAAGACGACGGAAAA
ACCTTTTCGA3’ (antisense) were annealed and then cloned between the BglII and
HindIII restriction sites of the pTER vector (van de Wetering et al., 2003). Expression plasmids were transfected in A673 Ewing cell line with the effectene transfection
reagent (Qiagen, Paris, France) according to the manufacturer’s instructions. A Tet
repressor expressing clone (A673tetR5BIII) was selected on Blasticidine (20µg/mL)
then transfected with the pTER/shEF-1 construct encoding Zeocin resistance
(200µg/mL). Two clones (shA673-1C and -2C), exhibiting strong inhibition of
EWS-FLI1 upon treatment with 1µg/mL Doxycycline (DOX), were selected. For lentivirus-mediated silencing of EW24 and SK-N-MC cell lines, the H1 promoter-tetO-shEF-1
cassette from pTER/shEF-1 vector was inserted in the pTRIP lentiviral expression
vector. Packaging and titration using GFP as a reporter were performed according to
Isolation of human bone marrow stromal cells (BMSC).
Human primary BMSCs were obtained after informed consent from bone marrow
aspirates (iliac crest) of patients undergoing hip replacement surgery. Mononuclear
cells were plated at the density of 50 000 cells/cm2 and cultured in α-MEM without
nucleotides (Gibco BRL, Invitrogen, Cergy-Pontoise, France), supplemented with
10% FCS (Hyclone), L-glutamine 2 mM (Gibco BRL) and 1ng/mL bFGF (AbCys).
After two weeks, confluent cells were detached with trypsin/EDTA and replated at
1000 cells/cm2 (passage 1, P1). Cells were phenotyped as BMSC by flow cytometry
(negative for CD34, CD31 and CD45 and positive for CD73, CD90, CD105 and
CD44). The three-lineages (adipocyte, osteocyte, and chondrocyte) differentiation
potential of these cells was controlled.
Isolation of RNAs and microarray analyses.
Total RNAs were isolated using the Trizol Reagent (Invitrogen). RNAs were isolated
9 days following transfection of A673 Ewing cells with the specific EWS-FLI1 siRNA
(siEF1) or with the control siRNA (siCT) and 3 days after infection of EW24 and
SK-N-MC with lentiviruses encoding EWS-FLI1-specific or control shRNA. RNAs from 27
ET samples and from freshly isolated (P1) BMSCs were also used for microarray
analyses. Experimental procedures for GeneChip microarray were performed
according to the Affymetrix GeneChip Expression Analysis Technical Manual
(Affymetrix, Santa Clara, CA) using HG-U133A arrays. CEL files from E-AFMX-5 (Su
et al., 2004) and from E-MEXP-167 and E-MEXP-168 (Boquest et al., 2005) datasets
were downloaded from the EBI’s ArrayExpress repository (Parkinson et al., 2005).
Additional CEL files for EWS-FLI1-silenced A673 cells were kindly provided by Steve
Lessnick (Smith et al., 2006). All microarray data were simultaneously normalized
Team, 2005). Principal component analyses were performed using the PCA tool of
MeV TM4 software (Saeed et al., 2003). SAM analyses were performed with the
samr package version 1.22 (Tusher et al., 2001). Microarray data are available at
Gene Expression Omnibus (GEO; http://www.ncbi.nlm.nih.gov/geo/) public database
with the accession number GSE7007.
Real-time quantitative reverse transcription-PCR.
cDNAs were synthesized from 1µg of RNA using the GeneAmp RNA PCR core Kit
(Applied Biosystem, Courtaboeuf, France). Quantitative PCR analyses were
performed using TaqMan Assays-on-demand Gene expression reagents (Applied
Biosystem) with qPCR Mastermix Plus without UNG (Eurogentec, Belgium).
Reactions were run on an ABI/PRISM 7500 (Applied Biosystem) and analyzed using
the 7500 system SDS software. The following Assays-on-demand were used: FABP4
(Hs00609791_m1); LPL (Hs00173425_m1); PPARG (Hs00234592_m1); ALPL
(Hs00758162_m1); RUNX2 (Hs00231692_m1); SPP1 (Hs00167093_m1); SOX9
(Hs00165814_m1); COL10A1 (Hs00166657_m1), PAX7 (Hs00242962_m1), FOXD3
(Hs00255287_m1), SNAI2 (Hs00161904_m1) and RPLP0 (Hs99999902_m1).
RPLP0 expression, which does not vary upon shRNA induction or differentiation conditions, was used for normalization. EWS-FLI1 expression was quantified by
SYBR green (Applied Biosystem) using the following primers: forward
5’GAGGCCAGAATTCATGTTATTGC3’; reverse
5’GCCAAGCTCCAAGTCAATATAGC3’.
Cell cycle analyses by flow cytometry
Cell cycle analyses were performed by BrdU incorporation as previously described
(Dauphinot et al., 2001). Samples were subjected to FACS analysis (FACScalibur,
software (BD Biosciences). For cell surface markers detection, 105 cells were
incubated 30 min at 4°C in 100 µL of PBS with phycoerythrin (PE)-conjugated mAb.
Cells were then washed twice and then proceeded immediately for FACS analysis.
The PE-conjugated antibodies from BD Biosciences used were: IgG1-PE (MOPC-2),
CD29-PE (MAR4), CD31-PE (WM59), CD44-PE (G44-26), CD45-PE (HI30),
CD54-PE (HA58), CD59-CD54-PE (H19), CD90-CD54-PE (5E10) and CD166-CD54-PE (3A6). CD105-CD54-PE
(SN6) was from Invitrogen.
Differentiation assays.
For adipogenic differentiation, cells were plated and grown for 2 days at 37°C, 5%
CO2 in DMEM or RPMI containing 10% FCS, 0.5mM IsoButylMethylXanthine
(Sigma), 1µM dexamethasone (Sigma) and 10µg/mL Insulin (Sigma). Medium was
then replaced by DMEM or RPMI, 10% FCS, with 10µg/mL Insulin and cells were
grown for six additional days with medium changes every two days, then collected for
quantitative-RT-PCR or fixed in 4% paraformaldehyde (Sigma) prior to staining with
0.3% w/v Oil-Red-O (Sigma) in 60% isopropanol. For osteogenic differentiation, cells
were grown in DMEM, 10% serum, 0.1µM dexamethasone, 0.15mM L-ascorbic acid
(Sigma), 2mM β-glycerophosphate (Sigma) and 1mM NaH2PO4 for 21 days.
Paraformaldehyde fixed calcium depositions were stained by the Von-Kossa protocol
including incubation with 5% silver nitrate (Sigma) for 30 min, extensive washing with
PBS, exposition for 20 min to UV and incubation in 5% sodium thiosulfate for 5 min.
For chondrogenic differentiation, cells were grown in pellet as previously described
(Johnstone et al., 1998). Briefly, 4x10⁵ cells centrifuged 5 min at 1200 rpm in a 15-ml
polypropylene tube were grown in pellet in 500µl of DMEM without serum but
sodium pyruvate, 1x ITS (Roche, Meylan, France), 10ng/mL TGFβ3 (R&D system,
Results
Convergence of EWS-FLI1-silenced Ewing cells toward mesenchymal stem cells in silico
To gain insight into the origin of Ewing tumors (ET), we compared the
expression profile of 27 ETs with that of various normal human tissues (Su et al.,
2004), human Mesenchymal Stem Cells (MSCs) (Boquest et al., 2005) and freshly
prepared Bone Marrow Stromal Cells (BMSC). This dataset hence contained different
tissues from neural (central or peripheral), epithelial, hematopoietic or mesenchymal
origins. Duplicate data, obtained with three Ewing cell lines silenced for EWS-FLI1
expression by RNA interference, were also included in this in-silico analysis. These
silencing experiments were initially performed with an EWS-FLI1-specific siRNA for
the A673 cell line which can be efficiently transfected (Prieur et al.2004). Given the
low efficiency of such transfection in other cell lines, we developed lentiviral vectors
to express a shRNA corresponding to the junction between EWS and FLI1 genes.
This lentivirus was used to infect EW24 and SK-N-MC cells. In addition, data recently
published for EWS-FLI1-silenced A673 cells (Smith et al., 2006) were also included
in this analysis (a complete description of the whole dataset is provided in Table S1).
All experiments, performed on Affymetrix HG-U133A chips, were simultaneously
normalized using gcrma. Hierarchical clustering and principal component analyses
(PCA) using all probe sets showed that ETs clustered, together EWS-FLI1-silenced
(efRNAi) and control (ctrlRNAi) samples, apart from all other tissues. This indicated
that ET form a homogeneous group not evidently related to any normal tissue (Figure
1A). Based on the hypothesis that EWS-FLI1 may modulate differentiation genes, we
performed a new PCA analysis with genes strongly and significantly modulated by
As shown in figure 1B, ETs were still clustered with ctrlRNAi apart from other tissues.
In contrast, efRNAi samples shifted away from the ET cluster to join the
mesenchymal group containing undifferentiated BMSCs or MSCs but also the more
differentiated adipocytes and myocytes. Hierarchical clustering analysis using the
same probesets also enabled to visualize the vicinity of efRNAi with tissues derived
from the mesenchymal lineage (Figure 1C and Figure S1). These in silico analyses
provided a first clue that EWS-FLI1 may regulate a subset of genes involved in
mesenchymal commitment or differentiation.
We more precisely investigated similarities between genes modulated by
EWS-FLI1 in Ewing cell lines and genes differentially expressed between MSCs and Ewing tumors. SAM analyses enabled the identification of 3238 probe sets (2430
genes) differently expressed between MSCs and ETs (absolute fold change>2;
q-values < 10-2)(Table S2). Comparisons of MSCs/ETs genesets with the 289 genes
identified between efRNAi and ctrlRNAi using the same criteria demonstrated a very
significant overlap of 110 genes (p< 10-16, exact binomial test) (Table S2). Most of
these genes behaved in a consistent manner between both comparisons, genes
downregulated by EWS-FLI1 being overexpressed in MSCs as compared to ETs and
genes upregulated by EWS-FLI1 being underexpressed in MSCs (Figure 1D). We
next investigated gene sets specifically modulated by EWS-FLI1 in each individual
cell lines. As expected, for each cell line, the overlap between MSCs/ETs-differential
genes and EWS-FLI1-regulated genes was highly significant although it was larger
for A673. In addition to a common core set of genes regulated by EWS-FLI1 in all
three cell lines, this analysis pointed out cell line-specific genesets (Figure 1E and
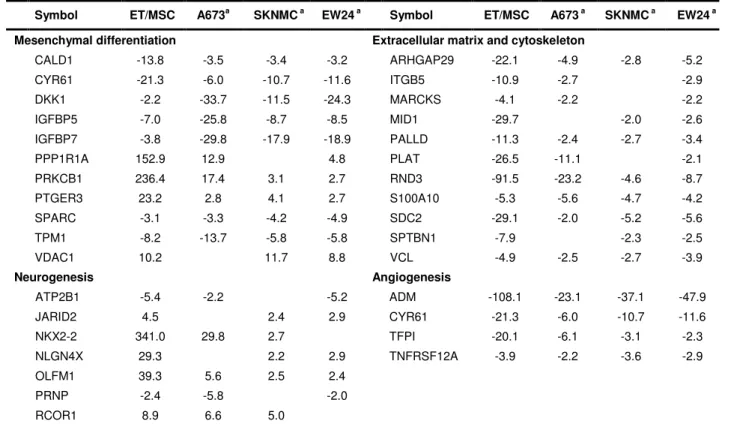
Table S2). Among genes common to the MSC/ET comparison and regulated by
signaling molecules (DKK1, IGFBPs, CYR61) are key regulators of pathways
controlling the commitment of MSCs to different lineages (Kiepe et al., 2006; Schutze
et al., 2005; van der Horst et al., 2005). The overlap also contains numerous genes
whose products are involved in the cytoskeleton and matrix remodeling associated
with mesenchymal cell biology (Table 1). In agreement with the proposed endothelial
potential of MSCs, some genes modulated by EWS-FLI1 and expressed by MSCs
have critical role in angiogenesis (Table 1). Finally, the inhibition of EWS-FLI1 also
induced the expression of some master genes of the mesenchymal differentiation
(including SOX9 and BMP1) that are not expressed in undifferentiated MSCs.
Together, these results strongly suggested that the EWS-FLI1-silenced Ewing cells
recover an expression pattern related to that of MSCs. They also showed that a
number of neural genes expressed in ETs, but not in MSCs, are regulated by
EWS-FLI1 (Table 1).
EWS-FLI1-silenced Ewing cells harbor mesenchymal features.
From these in silico analyses, we postulated that terminal differentiation in the
mesenchymal lineages might be achieved upon combined effects of EWS-FLI1
silencing and treatment of cells with appropriate differentiation cocktails. To test this
hypothesis, EWS-FLI1 silenced EW24, SK-N-MC and A673 cells were used to
conduct in vitro adipogenic differentiation experiments (Figure 2). Upon differentiation
conditions, EW24 infected with the control lentivirus and hence harboring a normal
EWS-FLI1 expression exhibited a mild induction of PPAR
γ
2 and FABP4 and a strong induction of LPL, three specific markers of the adipocyte lineage (Figure 2A). Thesilencing of EWS-FLI1 in EW24 cells grown in standard or differentiation media led to
staining, which labels lipidic vesicles, was not significant for EW24 infected with the
control virus either in basal or differentiation conditions. The inhibition of EWS-FLI1
by itself induced a light Oil-Red-O staining of a few cells (Figure 3B). However, this
staining was much more obvious when EWS-FLI1-silenced cells were incubated in
the presence of differentiation medium (Figure 2B). These results indicated that
EW24 cells exhibit some degree of adipogenic conversion upon incubation with
specific cocktail or upon EWS-FLI1 silencing but that this commitment is much more
pronounced when both conditions are combined. A similar observation was made
with A673 (data not shown and see below). In contrast, neither induction of markers,
nor Oil-Red-O staining was observed in the SK-N-MC cell line.
In addition to adipogenic differentiation, MSC can also commit to the
osteogenic or chondrogenic lineages. However, these differentiations necessitate up
to several weeks of incubation with specific media, which is hardly compatible with
the si or shRNA approaches used in the previous experiments. Indeed, due to a
progressive overgrowth of poorly inhibited cells, a long term and stable EWS-FLI1
silencing could not be achieved with these systems. To circumvent this technical
constrain we constructed Ewing cell lines expressing a doxycycline (DOX) inducible
shRNA targeting EWS-FLI1. Two independent clones (shA673-1C and -2C) were
isolated. As shown in figure 3A, the induction of the shRNA led to a dramatic
reduction of EWS-FLI1 transcript and protein levels observed by 24h after addition of
DOX in the culture medium and remaining stable over time. In agreement with
previous observations based on siRNAs (Chansky et al., 2004; Prieur et al., 2004),
inducible EWS-FLI1 silencing resulted in a considerable decrease of cell proliferation
associated with a reduced number of cells in the S-phase of the cell cycle and a
confirmed that adipogenic differentiation conducted with both inducible clones led to
results similar to those described above. In the presence of EWS-FLI1 (-DOX),
differentiation medium led to a significant induction of the three adipogenic markers
(Figure 3B). The knock-down of EWS-FLI1 in standard medium also led to an
induction of these transcripts. Nevertheless, the increased expression of these three
genes was higher when differentiation was conducted in the presence of DOX,
suggesting that inhibition of EWS-FLI1 and differentiation cocktail may provide
additive or even synergistic effects (see PPAR
γ
2 and LPL). Finally, Oil-Red-Ostaining was positive only for cells treated by both DOX and the differentiation
cocktail (Figure 3C). Altogether these data show that EWS-FLI1-inhibited Ewing cells
can accumulate lipid vesicles and express adipogenic markers, two features highly
suggestive of a differentiation along the adipocyte lineage.
Similar experiments were conducted for osteogenic differentiation using
quantitative RT-PCR analyses of three markers specific for this lineage (SPP1, ALPL
and RUNX2) and Von-Kossa staining. The EWS-FLI1 silencing and subsequent
growth arrest observed with DOX treatment of shA673 cells were stable over time
and long-term differentiation experiments could thus be conducted. The three
afore-mentioned osteogenic markers were induced by DOX and/or differentiation mix with
different patterns. The induction of ALPL was clearly dependent upon the medium
but not influenced by EWS-FLI1 (Figure 3D). Contrarily, differentiation medium and
DOX exhibited additive or even synergistic effects for RUNX2 and SPP1 inductions.
Even more strikingly, the Von-Kossa staining of shA673 grown for three weeks in
differentiation medium and DOX demonstrated the presence of a calcified matrix
whereas this was observed neither in cells grown in differentiation medium without
results show that EWS-FLI1-silenced Ewing cells can exhibit characteristic features
of osteocytes.
As MSCs are also precursors of chondrocytes, we tested whether shA673
cells could differentiate along this lineage. Pellet cultures of shA673 cells were
performed either in presence or absence of DOX and chondrogenic differentiation
medium. Whereas EWS-FLI1-expressing shA673 cells remained flat and rapidly died,
EWS-FLI1-silenced shA673 formed a round pellet, but ultimately died prior to the delay necessary to evaluate terminal chondrocyte differentiation. However,
quantitative RT-PCR experiments showed that, in addition to the afore-mentioned
RUNX2 induction, COL10A1 and SOX9, two markers of the chondrocyte lineage, were upregulated upon EWS-FLI1 silencing (Figure 3D). These results suggested
that Ewing cells can engage the initial steps of chondrocyte differentiation but cannot
fully complete this process.
Finally, since MSCs can be characterized by the expression of several surface
antigens (Covas et al., 2005; Izadpanah et al., 2005; Oswald et al., 2004; Pittenger et
al., 1999), we investigated the expression of 10 surface markers using FACS
analyses in the presence or absence of EWS-FLI1 (Figure 3F). Five of these (CD44,
CD59, CD73, CD29 and CD54) were expressed on shA673 cells and induced by
EWS-FLI1 inhibition. Three (CD90, CD105 and CD166) were expressed but not modified by EWS-FLI1 modulation. Finally, CD45 and CD31, two markers expressed
in hematopoeitic stem cells or endothelial cells, but not in mesenchymal stem cells,
were not detected at the surface of Ewing cells whatever the EWS-FLI1 status.
Altogether these results strengthen the hypothesis of EWS-FLI1-silenced Ewing cells
Discussion
The fusion between EWS and members of the ETS family, usually FLI1, is a
critical event of Ewing sarcoma development. EWS-ETS fusions are only observed in
tumors of the Ewing family, suggesting that transformation is dependent upon the
specific action of this oncogene within a precise cell background. Consequently, a
thorough phenotypic analysis of EWS-FLI1-silenced Ewing cells should give insights
into this cellular context. We have addressed this issue investigating the transcription
profile of EWS-FLI1-silenced Ewing cells. Numerous genes involved in neural
development and differentiation are expressed in ET and repressed upon inhibition of
EWS-FLI1. This observation is in complete agreement with the occasional presence of neural markers in ETs and with the recently reported shift from myogenic to neural
phenotype induced by EWS-FLI1 expression in rhabdomyosarcoma cells
(Hu-Lieskovan et al., 2005). It confirms that EWS-FLI1 by itself can promote the induction
of some neural crest genes. However, our data show that the neural profile of Ewing
cells is not sufficient for ETs to cluster among neural tissues (Figure 1A).
The more striking in silico observation is that three different
EWS-FLI1-inhibited Ewing cell lines cluster with MSCs when the analysis is performed with
EWS-FLI1-modulated genes. MSCs were initially described by Friedenstein (Friedenstein et al., 1976) who isolated plastic adherent cells from bone marrow
capable of differentiating into adipocytes, chondrocytes and osteocytes. More
recently, a number of investigators have shown that multi-potent MSCs can be
isolated from a variety of sources including bone marrow, adipose tissue, connective
tissues, placenta and umbilical cord blood (for review see Dennis and Charbord,
2002; Gregory et al., 2005). In addition to the afore-mentioned lineages, MSCs can
endothelial and vascular smooth muscle cells. Our study show that markers currently
used for the isolation of MSCs may be induced upon EWS-FLI1 inhibition (CD44,
CD54, CD59 and CD73). The in silico analysis described above is strongly supported
by experiments showing that EWS-FLI1-inhibited Ewing cells, but not parental Ewing
cells, exhibit differentiation characteristics of mesenchymal lineages. Indeed, two out
of three Ewing cell lines can be clearly differentiated along the adipogenic lineage.
This indicates that at least in these two cell lines, the apparatus responsible for the
adipogenic differentiation is present but impaired by EWS-FLI1. Long term inhibition
of EWS-FLI1 also shows that terminal osteogenic differentiation can be observed
with synthesis of a calcified matrix. These experimental data are fully consistent with
the previous description of osteoid matrix in a subgroup of EWS-FLI1-positive tumors
called small cell osteosarcoma (Oshima et al., 2004). A less evident commitment of
EWS-FLI1 silenced cells toward the chondrogenic lineage is also observed. Despite the death of Ewing cells observed upon chondrocyte differentiation conditions,
impairing the evaluation of the terminal differentiation, COL10A1, SOX9 and RUNX2,
three markers suggestive of a commitment toward the chondrocyte lineage are
induced upon EWS-FLI1 silencing. SOX9 can be induced in chondrogenic but also in
neural differentiation. To further investigate the hypothesis of SOX9 induction being
related to differentiation along the neural lineage, we also analyzed the expression of
SNAI2, FOXD3 and PAX7, three markers which are required for neural crest cells differentiation (Basch et al., 2006). PAX7 was strongly (10X) inhibited by EWS-FLI1
silencing. FOXD3 and SNAI2 were slightly inhibited or induced, respectively.
Interestingly, none of these markers were induced upon treatment of Ewing cells with
DMSO/HBA or DMSO/RA, two protocols previously described for neural
These results strongly suggest that the SOX9 induction is rather related to a
chondrocyte than a neural commitment.
Altogether, these in silico and experimental data strongly suggest that Ewing
cells arise from MSC which terminal mesenchymal differentiation is blocked by
EWS-FLI1. It also shows that the phenotype of Ewing cells is perverted from the mesenchymal to neural lineage by EWS-FLI1. However, some Ewing cell lines
(SK-N-MC), despite a strong convergence toward a MSC gene expression profile upon
EWS-FLI1 silencing do not differentiate, at least along the adipogenic lineage. This indicates that the Ewing cell background, although related to MSC, harbor cell
line-specific differences which may reflect diverse mesenchymal potentials of the original
progenitors in which the EWS-FLI1 fusion occurred. Alternatively, some Ewing cell
lines may have acquired secondary genetic changes impairing differentiation
processes.
The MSCs compartment consists of heterogeneous population of cells and
presently, no single marker can be used to isolate subpopulations of MSCs
committed to specific lineages. Stem cells with an extended differentiation potential,
in particular in the angiogenic lineage, can be isolated from adipose tissue and bone
marrow. In that respect, it is striking that different genes involved in angiogenesis are
modulated by EWS-FLI1. The hypothesis of a vascular differentiation potential of ET
cells, which was proposed by James Ewing himself, is further supported by recent
microarray data and by the observation of vascular mimicry in ET associated with the
ability of some Ewing cell lines to form vascular-like tubes in vitro (Staege et al.,
2004; van der Schaft et al., 2005). In that respect, it is interesting to mention that
FLI1, the wild type counterpart of EWS-FLI1, is a key regulator of early blood vessel formation (Brown et al., 2000). Taken together, in silico and experimental results
suggest that ETs are derived from MSCs that may have both mesenchymal and
vascular potentials. ET may therefore constitute an appropriate model to further study
the characteristics of a common mesenchymal and vascular progenitor.
The identification of the Ewing primary cell constitutes a key step toward a
better understanding of ET biology. The MSC origin may account for the predominant
localization of ET in bones or soft tissues, two major sources for these stem cells.
Through a precise spatio-temporal targeting of EWS-FLI1 expression in the mouse, it
should foster the development of a Ewing tumor model, which is presently lacking
and which may be of considerable help to achieve comprehensive insights into tumor
Acknowledgments
We thank Zofia Maciorowski from the department of tumor biology of the Institut
Curie for the BrdU analyses, Hans Clevers for the generous gift of the pTER and the
Tet repressor expression plasmid (pTet-R) and Pierre Charneau for providing us the
pTRIP lentivirus. We also thank Gilbert Lenoir and Steve Lessnick for materials used
in this study. This work was supported by grants from the Institut National de la
Santé et de la Recherche Médicale, the Institut Curie, the Ligue Nationale contre le
Cancer (Equipe labellisée and CIT program), the Réseau National des Génopoles
Figure legends
Figure 1. EWS-FLI1-silenced Ewing cells profiles converge toward a mesenchymal
stem cell expression pattern.
(A) Principal component analysis comparing the gene expression profiles of
EWS-FLI1-silenced (efRNAi) and control (ctrlRNAi) A673, EW24 and SK-N-MC Ewing cell lines, Ewing tumors (ET), mesenchymal stem cells (MSC) and various tissues, using
the whole transcriptome data. Mesench.: differentiated mesenchymal tissues (smooth
muscle, adipocytes), Hemato: Hematopoietic tissues, Epith: Epithelial tissues. The
precise description of these tissues is provided in Table S1. Each plotted data point
represents a single profile. In particular, individual data points for inhibition of
EWS-FLI1 by RNA interference are shown.
(B) Same analysis than in (A) but performed with EWS-FLI1-modulated probe sets
(SAM analyses between efRNAi and ctrlRNAi samples, absolute fold change >3;
q-value <0.01). The two first components account for 41.8% of the variation.
(C) Hierarchical clustering analysis (average linkage method, 1- rank correlation
distance metric) using EWS-FLI1-modulated probe sets. efRNAi samples cluster with
mesenchymal tissues and stem cells. The complete annotated cluster is provided as
Figure S1.
(D) A significant proportion of genes differentially expressed between efRNAi and
ctrlRNAi also distinguishes MSCs from ET. The blue circle schematizes the set of
genes exhibiting significant variation (>2 fold; q-value<0.01) between
EWS-FLI1-silenced or -expressing Ewing cells (efRNAi/ctrlRNAi) and the red circle represents
the set of genes differentially expressed between MSCs and ETs (the complete list of
genes is provided in Table S2). The table represents the distribution of the 110 genes
ef/ctrlRNAi: 44 genes upregulated in MSCs as compared to ETs are downregulated
by EWS-FLI1 and 55 genes downregulated in MSCs as compared to ETs are
upregulated by EWS-FLI1.
(E) Venn diagram showing, among the 2540 genes which discriminates MSCs and
ETs, the number of genes regulated by EWS-FLI1 in a cell line specific manner. For
each cell line, the number of EWS-FLI1-modulated genes (Welch test p-value<0.01,
absolute fold change >2) common with the gene set of the MSC/ET comparison is
represented. Among the 782, 364 and 382 genes regulated by EWS-FLI1 in A673,
EW24 or SK-N-MC, 320, 93 and 82 are common with the MSC/ET comparison,
respectively.
Figure 2. Differentiation of EWS-FLI1-silenced EW24 cells along the adipogenic
lineage.
(A) Quantitative RT-PCR analysis of specific adipocyte markers on EW24 cells
infected by the EWS-FLI1 specific (shEF1) or control (shCT) lentiviruses grown in
either standard (-) or differentiation medium (Diff). The mean values and standard
deviation obtained for duplicate experiments are indicated.
(B) Oil-Red-O staining of EW24 cells infected with shCT or shEF1-encoding
lentiviruses and cultured in standard (-) or adipogenic conditions (diff).
Figure 3. Long term silencing of EWS-FLI1 induces mesenchymal features.
(A) Temporal analysis of EWS-FLI1 mRNA (left panel) and protein (right panel)
expression upon doxycycline treatment of shA673 cells. β-actin is used as a control.
For mRNA expression, the mean values +/- SD obtained for duplicate experiments
are indicated.
(B) Quantitative RT-PCR analysis of the specific adipocyte markers on shA673
differentiation medium (Diff). The mean values +/- SD obtained for duplicate
experiments on both shA673 clones are indicated.
(C) Oil-Red-O staining of shA673-1C cultured in standard (-) or adipogenic conditions
(diff) in the absence or presence of DOX.
(D) Quantitative RT-PCR analysis of specific osteocyte and chondrocyte markers.
The mean values +/- SD obtained for duplicate experiments on both shA673 clones
are indicated.
(E) Von-Kossa staining of the mineralized matrix for shA673-1C cultured in standard
(-) or osteogenic differentiation (diff) conditions in the presence or absence of DOX.
(F) FACS analyses of four cell surface markers (CD59, CD73, CD54 and CD44).
Cells were treated (black lines) or not (grey lines) with DOX during 6 days prior to
References
Arvand, A., and Denny, C. T. (2001). Biology of EWS/ETS fusions in Ewing's family tumors. Oncogene 20, 5747-5754.
Basch, M. L., Bronner-Fraser, M., and Garcia-Castro, M. I. (2006). Specification of the neural crest occurs during gastrulation and requires Pax7. Nature 441, 218-222.
Boquest, A. C., Shahdadfar, A., Fronsdal, K., Sigurjonsson, O., Tunheim, S. H., Collas, P., and Brinchmann, J. E. (2005). Isolation and transcription profiling of purified uncultured human stromal stem cells: alteration of gene expression after in vitro cell culture. Mol Biol Cell 16, 1131-1141.
Brown, L. A., Rodaway, A. R., Schilling, T. F., Jowett, T., Ingham, P. W., Patient, R. K., and Sharrocks, A. D. (2000). Insights into early vasculogenesis revealed by expression of the ETS-domain transcription factor Fli-1 in wild-type and mutant zebrafish embryos. Mech Dev 90, 237-252.
Castillero-Trejo, Y., Eliazer, S., Xiang, L., Richardson, J. A., and Ilaria, R. L., Jr. (2005). Expression of the EWS/FLI-1 oncogene in murine primary bone-derived cells Results in EWS/FLI-1-dependent, ewing sarcoma-like tumors. Cancer research 65, 8698-8705.
Cavazzana, A. O., Miser, J. S., Jefferson, J., and Triche, T. J. (1987). Experimental evidence for a neural origin of Ewing's sarcoma of bone. Am J Pathol 127, 507-518.
Chansky, H. A., Barahmand-Pour, F., Mei, Q., Kahn-Farooqi, W., Zielinska-Kwiatkowska, A., Blackburn, M., Chansky, K., Conrad, E. U., 3rd, Bruckner, J. D., Greenlee, T. K., and Yang, L. (2004). Targeting of EWS/FLI-1 by RNA interference attenuates the tumor phenotype of Ewing's sarcoma cells in vitro. J Orthop Res 22, 910-917.
Covas, D. T., Piccinato, C. E., Orellana, M. D., Siufi, J. L., Silva, W. A., Jr., Proto-Siqueira, R., Rizzatti, E. G., Neder, L., Silva, A. R., Rocha, V., and Zago, M. A. (2005). Mesenchymal stem cells can be obtained from the human saphena vein. Experimental cell research 309, 340-344.
Dauphinot, L., De Oliveira, C., Melot, T., Sevenet, N., Thomas, V., Weissman, B. E., and Delattre, O. (2001). Analysis of the expression of cell cycle regulators in Ewing cell lines: EWS-FLI-1 modulates p57KIP2and c-Myc expression. Oncogene 20, 3258-3265.
Delattre, O., Zucman, J., Plougastel, B., Desmaze, C., Melot, T., Peter, M., Kovar, H., Joubert, I., de Jong, P., Rouleau, G., and et al. (1992). Gene fusion with an ETS DNA-binding domain caused by chromosome translocation in human tumours. Nature 359, 162-165.
Dennis, J. E., and Charbord, P. (2002). Origin and differentiation of human and murine stroma. Stem Cells 20, 205-214.
Eliazer, S., Spencer, J., Ye, D., Olson, E., and Ilaria, R. L., Jr. (2003). Alteration of mesodermal cell differentiation by EWS/FLI-1, the oncogene implicated in Ewing's sarcoma. Molecular and cellular biology 23, 482-492.
Ewing, J. (1921). Diffuse endothelioma of bone. Proc New York Pathol Soc 21, 17-24.
Friedenstein, A. J., Gorskaja, J. F., and Kulagina, N. N. (1976). Fibroblast precursors in normal and irradiated mouse hematopoietic organs. Exp Hematol 4, 267-274.
Gregory, C. A., Prockop, D. J., and Spees, J. L. (2005). Non-hematopoietic bone marrow stem cells: molecular control of expansion and differentiation. Experimental cell research 306, 330-335.
Hu-Lieskovan, S., Zhang, J., Wu, L., Shimada, H., Schofield, D. E., and Triche, T. J. (2005). EWS-FLI1 fusion protein up-regulates critical genes in neural crest development and is responsible for the observed phenotype of Ewing's family of tumors. Cancer research 65, 4633-4644.
Izadpanah, R., Joswig, T., Tsien, F., Dufour, J., Kirijan, J. C., and Bunnell, B. A. (2005). Characterization of multipotent mesenchymal stem cells from the bone marrow of rhesus macaques. Stem Cells Dev 14, 440-451.
Janknecht, R. (2005). EWS-ETS oncoproteins: the linchpins of Ewing tumors. Gene 363, 1-14.
Johnstone, B., Hering, T. M., Caplan, A. I., Goldberg, V. M., and Yoo, J. U. (1998). In vitro chondrogenesis of bone marrow-derived mesenchymal progenitor cells. Experimental cell research 238, 265-272.
Kiepe, D., Ciarmatori, S., Haarmann, A., and Tonshoff, B. (2006). Differential expression of IGF system components in proliferating vs. differentiating growth plate chondrocytes: the functional role of IGFBP-5. American journal of physiology 290, E363-371.
Noguera, R., Navarro, S., Peydro-Olaya, A., and Llombart-Bosch, A. (1994). Patterns of differentiation in extraosseous Ewing's sarcoma cells. An in vitro study. Cancer 73, 616-624. Oshima, Y., Kawaguchi, S., Nagoya, S., Wada, T., Kokai, Y., Ikeda, T., Nogami, S., Oya, T., and Hirayama, Y. (2004). Abdominal small round cell tumor with osteoid and EWS/FLI1. Human pathology 35, 773-775.
Oswald, J., Boxberger, S., Jorgensen, B., Feldmann, S., Ehninger, G., Bornhauser, M., and Werner, C. (2004). Mesenchymal stem cells can be differentiated into endothelial cells in vitro. Stem Cells 22, 377-384.
Parkinson, H., Sarkans, U., Shojatalab, M., Abeygunawardena, N., Contrino, S., Coulson, R., Farne, A., Lara, G. G., Holloway, E., Kapushesky, M., et al. (2005). ArrayExpress--a public repository for microarray gene expression data at the EBI. Nucleic Acids Res 33, D553-555. Pittenger, M. F., Mackay, A. M., Beck, S. C., Jaiswal, R. K., Douglas, R., Mosca, J. D., Moorman, M. A., Simonetti, D. W., Craig, S., and Marshak, D. R. (1999). Multilineage potential of adult human mesenchymal stem cells. Science 284, 143-147.
Prieur, A., Tirode, F., Cohen, P., and Delattre, O. (2004). EWS/FLI-1 silencing and gene profiling of Ewing cells reveal downstream oncogenic pathways and a crucial role for repression of insulin-like growth factor binding protein 3. Molecular and cellular biology 24, 7275-7283.
R Development Core Team, ed. (2005). R: A language and environment for statistical computing., (Vienna, Austria.).
Riggi, N., Cironi, L., Provero, P., Suva, M. L., Kaloulis, K., Garcia-Echeverria, C., Hoffmann, F., Trumpp, A., and Stamenkovic, I. (2005). Development of Ewing's sarcoma from primary bone marrow-derived mesenchymal progenitor cells. Cancer research 65, 11459-11468.
Rorie, C. J., Thomas, V. D., Chen, P., Pierce, H. H., O'Bryan, J. P., and Weissman, B. E. (2004). The Ews/Fli-1 fusion gene switches the differentiation program of neuroblastomas to Ewing sarcoma/peripheral primitive neuroectodermal tumors. Cancer research 64, 1266-1277. Saeed, A. I., Sharov, V., White, J., Li, J., Liang, W., Bhagabati, N., Braisted, J., Klapa, M., Currier, T., Thiagarajan, M., et al. (2003). TM4: a free, open-source system for microarray data management and analysis. BioTechniques 34, 374-378.
Schuetz, A. N., Rubin, B. P., Goldblum, J. R., Shehata, B., Weiss, S. W., Liu, W., Wick, M. R., and Folpe, A. L. (2005). Intercellular junctions in Ewing sarcoma/primitive neuroectodermal tumor: additional evidence of epithelial differentiation. Mod Pathol 18, 1403-1410.
Schutze, N., Noth, U., Schneidereit, J., Hendrich, C., and Jakob, F. (2005). Differential expression of CCN-family members in primary human bone marrow-derived mesenchymal stem cells during osteogenic, chondrogenic and adipogenic differentiation. Cell Commun Signal 3, 5.
Scintu, F., Reali, C., Pillai, R., Badiali, M., Sanna, M. A., Argiolu, F., Ristaldi, M. S., and Sogos, V. (2006). Differentiation of human bone marrow stem cells into cells with a neural phenotype: diverse effects of two specific treatments. BMC neuroscience [electronic resource] 7, 14.
Smith, R., Owen, L. A., Trem, D. J., Wong, J. S., Whangbo, J. S., Golub, T. R., and Lessnick, S. L. (2006). Expression profiling of EWS/FLI identifies NKX2.2 as a critical target gene in Ewing's sarcoma. Cancer cell 9, 405-416.
Staege, M. S., Hutter, C., Neumann, I., Foja, S., Hattenhorst, U. E., Hansen, G., Afar, D., and Burdach, S. E. (2004). DNA microarrays reveal relationship of Ewing family tumors to both endothelial and fetal neural crest-derived cells and define novel targets. Cancer research 64, 8213-8221.
Su, A. I., Wiltshire, T., Batalov, S., Lapp, H., Ching, K. A., Block, D., Zhang, J., Soden, R., Hayakawa, M., Kreiman, G., et al. (2004). A gene atlas of the mouse and human protein-encoding transcriptomes. Proc Natl Acad Sci U S A 101, 6062-6067.
Torchia, E. C., Jaishankar, S., and Baker, S. J. (2003). Ewing tumor fusion proteins block the differentiation of pluripotent marrow stromal cells. Cancer research 63, 3464-3468.
Tusher, V. G., Tibshirani, R., and Chu, G. (2001). Significance analysis of microarrays applied to the ionizing radiation response. Proc Natl Acad Sci U S A 98, 5116-5121.
van de Wetering, M., Oving, I., Muncan, V., Pon Fong, M. T., Brantjes, H., van Leenen, D., Holstege, F. C., Brummelkamp, T. R., Agami, R., and Clevers, H. (2003). Specific inhibition of gene expression using a stably integrated, inducible small-interfering-RNA vector. EMBO Rep 4, 609-615.
van der Horst, G., van der Werf, S. M., Farih-Sips, H., van Bezooijen, R. L., Lowik, C. W., and Karperien, M. (2005). Downregulation of Wnt signaling by increased expression of Dickkopf-1 and -2 is a prerequisite for late-stage osteoblast differentiation of KS483 cells. J Bone Miner Res 20, 1867-1877.
van der Schaft, D. W., Hillen, F., Pauwels, P., Kirschmann, D. A., Castermans, K., Egbrink, M. G., Tran, M. G., Sciot, R., Hauben, E., Hogendoorn, P. C., et al. (2005). Tumor cell plasticity in Ewing sarcoma, an alternative circulatory system stimulated by hypoxia. Cancer research 65, 11520-11528.
Woodbury, D., Reynolds, K., and Black, I. B. (2002). Adult bone marrow stromal stem cells express germline, ectodermal, endodermal, and mesodermal genes prior to neurogenesis. Journal of neuroscience research 69, 908-917.
Woodbury, D., Schwarz, E. J., Prockop, D. J., and Black, I. B. (2000). Adult rat and human bone marrow stromal cells differentiate into neurons. Journal of neuroscience research 61, 364-370.
Zucman, J., Melot, T., Desmaze, C., Ghysdael, J., Plougastel, B., Peter, M., Zucker, J. M., Triche, T. J., Sheer, D., Turc-Carel, C., and et al. (1993). Combinatorial generation of variable fusion proteins in the Ewing family of tumours. EMBO J 12, 4481-4487.
Table 1. Main genes modulated by EWS-FLI-1 and differentially expressed between MSC and ET
a
Mean fold change between ctrlRNAi and efRNAi samples. - indicates EWS/FLI-1-repressed genes.
Symbol ET/MSC A673a
SKNMC a
EW24 a
Symbol ET/MSC A673 a
SKNMC a
EW24 a
Mesenchymal differentiation Extracellular matrix and cytoskeleton
CALD1 -13.8 -3.5 -3.4 -3.2 ARHGAP29 -22.1 -4.9 -2.8 -5.2 CYR61 -21.3 -6.0 -10.7 -11.6 ITGB5 -10.9 -2.7 -2.9 DKK1 -2.2 -33.7 -11.5 -24.3 MARCKS -4.1 -2.2 -2.2 IGFBP5 -7.0 -25.8 -8.7 -8.5 MID1 -29.7 -2.0 -2.6 IGFBP7 -3.8 -29.8 -17.9 -18.9 PALLD -11.3 -2.4 -2.7 -3.4 PPP1R1A 152.9 12.9 4.8 PLAT -26.5 -11.1 -2.1 PRKCB1 236.4 17.4 3.1 2.7 RND3 -91.5 -23.2 -4.6 -8.7 PTGER3 23.2 2.8 4.1 2.7 S100A10 -5.3 -5.6 -4.7 -4.2 SPARC -3.1 -3.3 -4.2 -4.9 SDC2 -29.1 -2.0 -5.2 -5.6 TPM1 -8.2 -13.7 -5.8 -5.8 SPTBN1 -7.9 -2.3 -2.5 VDAC1 10.2 11.7 8.8 VCL -4.9 -2.5 -2.7 -3.9 Neurogenesis Angiogenesis ATP2B1 -5.4 -2.2 -5.2 ADM -108.1 -23.1 -37.1 -47.9 JARID2 4.5 2.4 2.9 CYR61 -21.3 -6.0 -10.7 -11.6 NKX2-2 341.0 29.8 2.7 TFPI -20.1 -6.1 -3.1 -2.3 NLGN4X 29.3 2.2 2.9 TNFRSF12A -3.9 -2.2 -3.6 -2.9 OLFM1 39.3 5.6 2.5 2.4 PRNP -2.4 -5.8 -2.0 RCOR1 8.9 6.6 5.0
C D efRNAi ctrlRNAi MSC efRNAi ctrlRNAi MSC A673 Nervous Syst. MSC Hemato. Epith. Ewing Tumors ctrlRNAi EW24 SK-N-MC Mesench. A efRNAi & MSC Ctrl
RNAi ET Other Tissues Hem.
B E efRNAi Up regulated Down regulated 9 44 55 2 EWS-FLI1 Overexpressed in MSC Underexpressed in MSC ctrl/efRNAi MSC/ET ef/ctrl RNAi MSC/ET
A B shEF1 shCT R e la ti v e e x p re s s io n (L o g s c a le ) (-) Diff (-) Diff (-) Diff PPARγ2 FABP4 LPL 100 10 1 shCT shEF1 Diff (-)
C -DOX +DOX (-) Diff B 1000 1 10 100 (-) Diff (-) Diff (-) Diff
SPP1 ALPL RUNX2COLSOX9 10A1 DOX + DOX -(-) (-) R el at iv e ex pr es si on (L og s ca le ) D E -DOX +DOX Diff (-) β-actin EWS-FLI1 0 1 2 3 6 11
DOX treatment (days)
A F E W S -F LI 1 m R N A 10 080 60 40 20 0 0 1 2 3 6 11
DOX treatment (days)
CD59 0 20 40 60 80 100 % M ax 1 10 102103104 CD54 0 20 40 60 80 100 % M ax 1 10 102103104 % M ax CD44 0 20 40 60 80 100 1 10 102103104 1 10 102103104 CD73 % M ax 0 20 40 60 80 100 R el at iv e ex pr es si on (L og s ca le ) 1 10 100 1000 (-) Diff (-) Diff (-) Diff PPARγ2 FABP4 LPL DOX + DOX